

QinetiQ Annual Report 2017

Create successful ePaper yourself
Turn your PDF publications into a flip-book with our unique Google optimized e-Paper software.
www.qinetiq.com<br />
<strong>QinetiQ</strong><br />
<strong>QinetiQ</strong> Group<br />
Group<br />
plc<br />
plc<br />
<strong>Annual</strong><br />
<strong>Annual</strong><br />
<strong>Report</strong><br />
<strong>Report</strong><br />
and<br />
and<br />
Accounts<br />
Accounts<br />
<strong>2017</strong><br />
<strong>2017</strong><br />
Financial statements<br />
Financial statements 119<br />
119<br />
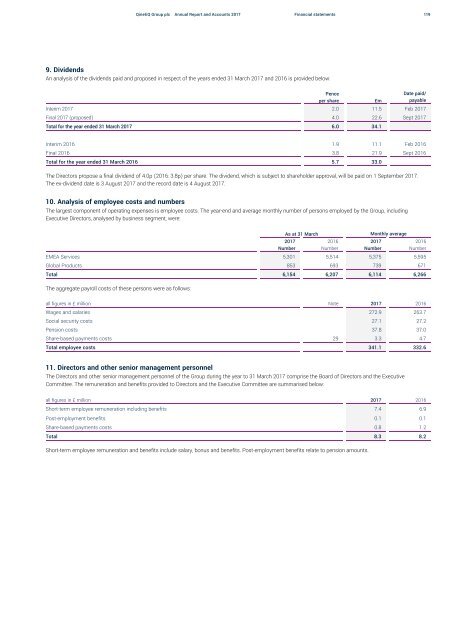
9. Dividends<br />
An analysis of the dividends paid and proposed in respect of the years ended 31 March <strong>2017</strong> and 2016 is provided below:<br />
Pence<br />
per share £m<br />
Date paid/<br />
payable<br />
Interim <strong>2017</strong> 2.0 11.5 Feb <strong>2017</strong><br />
Final <strong>2017</strong> (proposed) 4.0 22.6 Sept <strong>2017</strong><br />
Total for the year ended 31 March <strong>2017</strong> 6.0 34.1<br />
Interim 2016 1.9 11.1 Feb 2016<br />
Final 2016 3.8 21.9 Sept 2016<br />
Total for the year ended 31 March 2016 5.7 33.0<br />
The Directors propose a final dividend of 4.0p (2016: 3.8p) per share. The dividend, which is subject to shareholder approval, will be paid on 1 September <strong>2017</strong>.<br />
The ex-dividend date is 3 August <strong>2017</strong> and the record date is 4 August <strong>2017</strong>.<br />
10. Analysis of employee costs and numbers<br />
The largest component of operating expenses is employee costs. The year-end and average monthly number of persons employed by the Group, including<br />
Executive Directors, analysed by business segment, were:<br />
As at 31 March<br />
<strong>2017</strong><br />
Number<br />
2016<br />
Number<br />
Monthly average<br />
<strong>2017</strong><br />
Number<br />
EMEA Services 5,301 5,514 5,375 5,595<br />
Global Products 853 693 739 671<br />
Total 6,154 6,207 6,114 6,266<br />
The aggregate payroll costs of these persons were as follows:<br />
2016<br />
Number<br />
all figures in £ million Note <strong>2017</strong> 2016<br />
Wages and salaries 272.9 263.7<br />
Social security costs 27.1 27.2<br />
Pension costs 37.8 37.0<br />
Share-based payments costs 29 3.3 4.7<br />
Total employee costs 341.1 332.6<br />
11. Directors and other senior management personnel<br />
The Directors and other senior management personnel of the Group during the year to 31 March <strong>2017</strong> comprise the Board of Directors and the Executive<br />
Committee. The remuneration and benefits provided to Directors and the Executive Committee are summarised below:<br />
all figures in £ million <strong>2017</strong> 2016<br />
Short-term employee remuneration including benefits 7.4 6.9<br />
Post-employment benefits 0.1 0.1<br />
Share-based payments costs 0.8 1.2<br />
Total 8.3 8.2<br />
Short-term employee remuneration and benefits include salary, bonus and benefits. Post-employment benefits relate to pension amounts.


