

QinetiQ Annual Report 2017

Create successful ePaper yourself
Turn your PDF publications into a flip-book with our unique Google optimized e-Paper software.
120<br />
120<br />
Financial<br />
Financial statements<br />
statements <strong>QinetiQ</strong><br />
<strong>QinetiQ</strong> Group<br />
Group<br />
plc<br />
plc<br />
<strong>Annual</strong><br />
<strong>Annual</strong><br />
<strong>Report</strong><br />
<strong>Report</strong><br />
and<br />
and<br />
Accounts<br />
Accounts<br />
<strong>2017</strong><br />
<strong>2017</strong><br />
www.qinetiq.com<br />
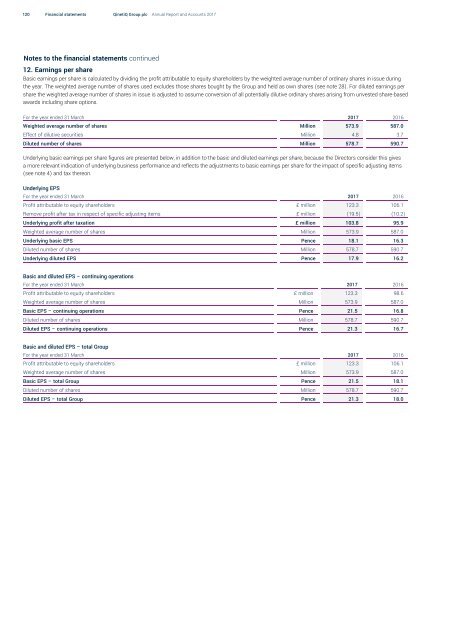
Notes to the financial statements continued<br />
12. Earnings per share<br />
Basic earnings per share is calculated by dividing the profit attributable to equity shareholders by the weighted average number of ordinary shares in issue during<br />
the year. The weighted average number of shares used excludes those shares bought by the Group and held as own shares (see note 28). For diluted earnings per<br />
share the weighted average number of shares in issue is adjusted to assume conversion of all potentially dilutive ordinary shares arising from unvested share-based<br />
awards including share options.<br />
For the year ended 31 March <strong>2017</strong> 2016<br />
Weighted average number of shares Million 573.9 587.0<br />
Effect of dilutive securities Million 4.8 3.7<br />
Diluted number of shares Million 578.7 590.7<br />
Underlying basic earnings per share figures are presented below, in addition to the basic and diluted earnings per share, because the Directors consider this gives<br />
a more relevant indication of underlying business performance and reflects the adjustments to basic earnings per share for the impact of specific adjusting items<br />
(see note 4) and tax thereon.<br />
Underlying EPS<br />
For the year ended 31 March <strong>2017</strong> 2016<br />
Profit attributable to equity shareholders £ million 123.3 106.1<br />
Remove profit after tax in respect of specific adjusting items £ million (19.5) (10.2)<br />
Underlying profit after taxation £ million 103.8 95.9<br />
Weighted average number of shares Million 573.9 587.0<br />
Underlying basic EPS Pence 18.1 16.3<br />
Diluted number of shares Million 578.7 590.7<br />
Underlying diluted EPS Pence 17.9 16.2<br />
Basic and diluted EPS – continuing operations<br />
For the year ended 31 March <strong>2017</strong> 2016<br />
Profit attributable to equity shareholders £ million 123.3 98.6<br />
Weighted average number of shares Million 573.9 587.0<br />
Basic EPS – continuing operations Pence 21.5 16.8<br />
Diluted number of shares Million 578.7 590.7<br />
Diluted EPS – continuing operations Pence 21.3 16.7<br />
Basic and diluted EPS – total Group<br />
For the year ended 31 March <strong>2017</strong> 2016<br />
Profit attributable to equity shareholders £ million 123.3 106.1<br />
Weighted average number of shares Million 573.9 587.0<br />
Basic EPS – total Group Pence 21.5 18.1<br />
Diluted number of shares Million 578.7 590.7<br />
Diluted EPS – total Group Pence 21.3 18.0


