

QinetiQ Annual Report 2017

You also want an ePaper? Increase the reach of your titles
YUMPU automatically turns print PDFs into web optimized ePapers that Google loves.
www.qinetiq.com<br />
<strong>QinetiQ</strong><br />
<strong>QinetiQ</strong> Group<br />
Group<br />
plc<br />
plc<br />
<strong>Annual</strong><br />
<strong>Annual</strong><br />
<strong>Report</strong><br />
<strong>Report</strong><br />
and<br />
and<br />
Accounts<br />
Accounts<br />
<strong>2017</strong><br />
<strong>2017</strong><br />
Financial statements<br />
Financial statements<br />
147<br />
147<br />
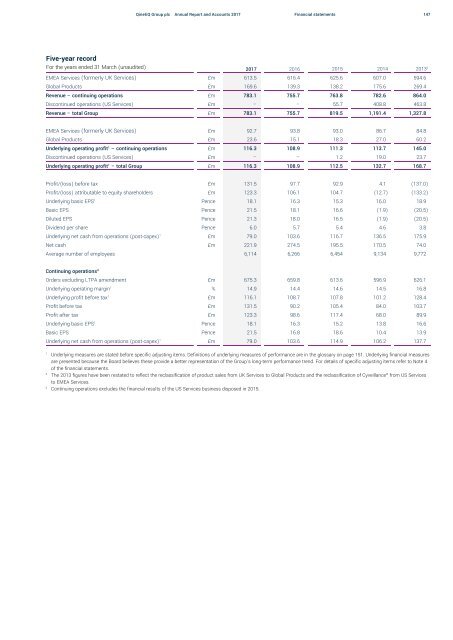
Five-year record<br />
For the years ended 31 March (unaudited)<br />
<strong>2017</strong> 2016 2015 2014 2013 2<br />
EMEA Services (formerly UK Services) £m 613.5 616.4 625.6 607.0 594.6<br />
Global Products £m 169.6 139.3 138.2 175.6 269.4<br />
Revenue – continuing operations £m 783.1 755.7 763.8 782.6 864.0<br />
Discontinued operations (US Services) £m – – 55.7 408.8 463.8<br />
Revenue – total Group £m 783.1 755.7 819.5 1,191.4 1,327.8<br />
EMEA Services (formerly UK Services) £m 92.7 93.8 93.0 86.7 84.8<br />
Global Products £m 23.6 15.1 18.3 27.0 60.2<br />
Underlying operating profit 1 – continuing operations £m 116.3 108.9 111.3 113.7 145.0<br />
Discontinued operations (US Services) £m – – 1.2 19.0 23.7<br />
Underlying operating profit 1 – total Group £m 116.3 108.9 112.5 132.7 168.7<br />
Profit/(loss) before tax £m 131.5 97.7 92.9 4.1 (137.0)<br />
Profit/(loss) attributable to equity shareholders £m 123.3 106.1 104.7 (12.7) (133.2)<br />
Underlying basic EPS 1 Pence 18.1 16.3 15.3 16.0 18.9<br />
Basic EPS Pence 21.5 18.1 16.6 (1.9) (20.5)<br />
Diluted EPS Pence 21.3 18.0 16.5 (1.9) (20.5)<br />
Dividend per share Pence 6.0 5.7 5.4 4.6 3.8<br />
Underlying net cash from operations (post-capex) 1 £m 79.0 103.6 116.7 136.5 175.9<br />
Net cash £m 221.9 274.5 195.5 170.5 74.0<br />
Average number of employees 6,114 6,266 6,454 9,134 9,772<br />
Continuing operations 3<br />
Orders excluding LTPA amendment £m 675.3 659.8 613.6 596.9 626.1<br />
Underlying operating margin 1 % 14.9 14.4 14.6 14.5 16.8<br />
Underlying profit before tax 1 £m 116.1 108.7 107.8 101.2 128.4<br />
Profit before tax £m 131.5 90.2 105.4 84.0 103.7<br />
Profit after tax £m 123.3 98.6 117.4 68.0 89.9<br />
Underlying basic EPS 1 Pence 18.1 16.3 15.2 13.8 16.6<br />
Basic EPS Pence 21.5 16.8 18.6 10.4 13.9<br />
Underlying net cash from operations (post-capex) 1 £m 79.0 103.6 114.9 106.2 137.7<br />
1<br />
Underlying measures are stated before specific adjusting items. Definitions of underlying measures of performance are in the glossary on page 151. Underlying financial measures<br />
are presented because the Board believes these provide a better representation of the Group’s long-term performance trend. For details of specific adjusting items refer to Note 4<br />
of the financial statements.<br />
2<br />
The 2013 figures have been restated to reflect the reclassification of product sales from UK Services to Global Products and the reclassification of Cyveillance ® from US Services<br />
to EMEA Services.<br />
3<br />
Continuing operations excludes the financial results of the US Services business disposed in 2015.


