

QinetiQ Annual Report 2017

Create successful ePaper yourself
Turn your PDF publications into a flip-book with our unique Google optimized e-Paper software.
124<br />
124<br />
Financial<br />
Financial statements<br />
statements <strong>QinetiQ</strong><br />
<strong>QinetiQ</strong> Group<br />
Group<br />
plc<br />
plc<br />
<strong>Annual</strong><br />
<strong>Annual</strong><br />
<strong>Report</strong><br />
<strong>Report</strong><br />
and<br />
and<br />
Accounts<br />
Accounts<br />
<strong>2017</strong><br />
<strong>2017</strong><br />
www.qinetiq.com<br />
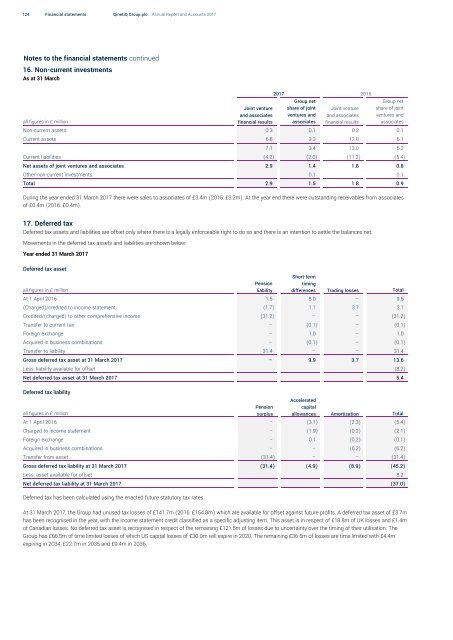
Notes to the financial statements continued<br />
16. Non-current investments<br />
As at 31 March<br />
all figures in £ million<br />
Joint venture<br />
and associates<br />
financial results<br />
<strong>2017</strong> 2016<br />
Group net<br />
share of joint<br />
ventures and<br />
associates<br />
Joint venture<br />
and associates<br />
financial results<br />
Group net<br />
share of joint<br />
ventures and<br />
associates<br />
Non-current assets 0.3 0.1 0.2 0.1<br />
Current assets 6.8 3.3 12.8 6.1<br />
7.1 3.4 13.0 6.2<br />
Current liabilities (4.2) (2.0) (11.2) (5.4)<br />
Net assets of joint ventures and associates 2.9 1.4 1.8 0.8<br />
Other non-current investments 0.1 0.1<br />
Total 2.9 1.5 1.8 0.9<br />
During the year ended 31 March <strong>2017</strong> there were sales to associates of £3.4m (2016: £3.2m). At the year end there were outstanding receivables from associates<br />
of £0.4m (2016: £0.4m).<br />
17. Deferred tax<br />
Deferred tax assets and liabilities are offset only where there is a legally enforceable right to do so and there is an intention to settle the balances net.<br />
Movements in the deferred tax assets and liabilities are shown below:<br />
Year ended 31 March <strong>2017</strong><br />
Deferred tax asset<br />
Short-term<br />
all figures in £ million<br />
Pension<br />
liability<br />
timing<br />
differences Trading losses Total<br />
At 1 April 2016 1.5 8.0 – 9.5<br />
(Charged)/credited to income statement (1.7) 1.1 3.7 3.1<br />
Credited/(charged) to other comprehensive income (31.2) – – (31.2)<br />
Transfer to current tax – (0.1) – (0.1)<br />
Foreign exchange – 1.0 – 1.0<br />
Acquired in business combinations – (0.1) – (0.1)<br />
Transfer to liability 31.4 – – 31.4<br />
Gross deferred tax asset at 31 March <strong>2017</strong> – 9.9 3.7 13.6<br />
Less: liability available for offset (8.2)<br />
Net deferred tax asset at 31 March <strong>2017</strong> 5.4<br />
Deferred tax liability<br />
Accelerated<br />
all figures in £ million<br />
Pension<br />
surplus<br />
capital<br />
allowances Amortisation Total<br />
At 1 April 2016 – (3.1) (2.3) (5.4)<br />
Charged to income statement – (1.9) (0.2) (2.1)<br />
Foreign exchange – 0.1 (0.2) (0.1)<br />
Acquired in business combinations – – (6.2) (6.2)<br />
Transfer from asset (31.4) – – (31.4)<br />
Gross deferred tax liability at 31 March <strong>2017</strong> (31.4) (4.9) (8.9) (45.2)<br />
Less: asset available for offset 8.2<br />
Net deferred tax liability at 31 March <strong>2017</strong> (37.0)<br />
Deferred tax has been calculated using the enacted future statutory tax rates.<br />
At 31 March <strong>2017</strong>, the Group had unused tax losses of £141.7m (2016: £154.8m) which are available for offset against future profits. A deferred tax asset of £3.7m<br />
has been recognised in the year, with the income statement credit classified as a specific adjusting item. This asset is in respect of £18.8m of UK losses and £1.4m<br />
of Canadian losses. No deferred tax asset is recognised in respect of the remaining £121.5m of losses due to uncertainty over the timing of their utilisation. The<br />
Group has £66.5m of time limited losses of which US capital losses of £30.0m will expire in 2020. The remaining £36.5m of losses are time limited with £4.4m<br />
expiring in 2034, £22.7m in 2035 and £9.4m in 2036.


