

QinetiQ Annual Report 2017

You also want an ePaper? Increase the reach of your titles
YUMPU automatically turns print PDFs into web optimized ePapers that Google loves.
www.qinetiq.com<br />
<strong>QinetiQ</strong><br />
<strong>QinetiQ</strong> Group<br />
Group<br />
plc<br />
plc<br />
<strong>Annual</strong><br />
<strong>Annual</strong><br />
<strong>Report</strong><br />
<strong>Report</strong><br />
and<br />
and<br />
Accounts<br />
Accounts<br />
<strong>2017</strong><br />
<strong>2017</strong><br />
Financial statements<br />
Financial statements 113<br />
113<br />
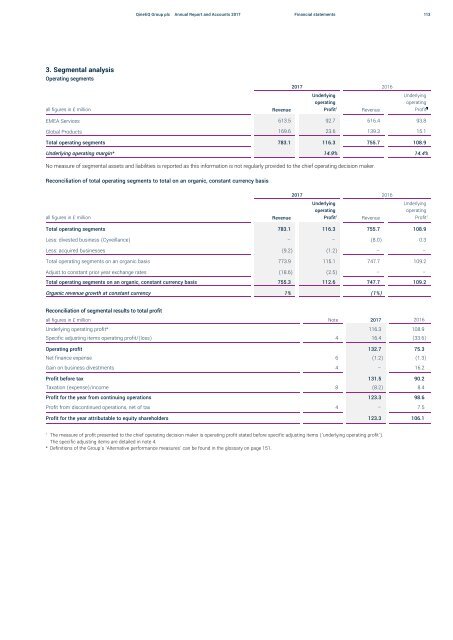
3. Segmental analysis<br />
Operating segments<br />
all figures in £ million<br />
Revenue<br />
<strong>2017</strong> 2016<br />
Underlying<br />
operating<br />
Profit 1<br />
Revenue<br />
Underlying<br />
operating<br />
Profit 1<br />
EMEA Services 613.5 92.7 616.4 93.8<br />
Global Products 169.6 23.6 139.3 15.1<br />
Total operating segments 783.1 116.3 755.7 108.9<br />
Underlying operating margin* 14.9% 14.4%<br />
No measure of segmental assets and liabilities is reported as this information is not regularly provided to the chief operating decision maker.<br />
Reconciliation of total operating segments to total on an organic, constant currency basis<br />
all figures in £ million<br />
Revenue<br />
<strong>2017</strong> 2016<br />
Underlying<br />
operating<br />
Profit 1<br />
Revenue<br />
Underlying<br />
operating<br />
Profit 1<br />
Total operating segments 783.1 116.3 755.7 108.9<br />
Less: divested business (Cyveillance) – – (8.0) 0.3<br />
Less: acquired businesses (9.2) (1.2) – –<br />
Total operating segments on an organic basis 773.9 115.1 747.7 109.2<br />
Adjust to constant prior year exchange rates (18.6) (2.5) – –<br />
Total operating segments on an organic, constant currency basis 755.3 112.6 747.7 109.2<br />
Organic revenue growth at constant currency 1% (1%)<br />
Reconciliation of segmental results to total profit<br />
all figures in £ million Note <strong>2017</strong> 2016<br />
Underlying operating profit* 116.3 108.9<br />
Specific adjusting items operating profit/(loss) 4 16.4 (33.6)<br />
Operating profit 132.7 75.3<br />
Net finance expense 6 (1.2) (1.3)<br />
Gain on business divestments 4 – 16.2<br />
Profit before tax 131.5 90.2<br />
Taxation (expense)/income 8 (8.2) 8.4<br />
Profit for the year from continuing operations 123.3 98.6<br />
Profit from discontinued operations, net of tax 4 – 7.5<br />
Profit for the year attributable to equity shareholders 123.3 106.1<br />
1<br />
The measure of profit presented to the chief operating decision maker is operating profit stated before specific adjusting items (‘underlying operating profit’).<br />
The specific adjusting items are detailed in note 4.<br />
* Definitions of the Group’s ‘Alternative performance measures’ can be found in the glossary on page 151.


