

ADMIN+Magazine+Sample+PDF

You also want an ePaper? Increase the reach of your titles
YUMPU automatically turns print PDFs into web optimized ePapers that Google loves.
Icinga<br />
Features<br />
Table 1: States<br />
Option Status<br />
Server<br />
o<br />
OK<br />
d<br />
Down<br />
u<br />
Unreachable<br />
r<br />
Recovered<br />
Services<br />
o<br />
OK<br />
w<br />
Warning<br />
c<br />
Critical<br />
r<br />
Recovered<br />
u<br />
Unknown<br />
counter has risen every couple of<br />
months ever since.<br />
Icinga comprises three components:<br />
the core, the API, and the optional<br />
web interface. The core collects system<br />
health information generated by<br />
plugins and passes it via the IDOMOD<br />
interface to the Icinga Data Out Database<br />
(IDODB) or the IDO2DB service<br />
daemon. The PHP-based API accepts<br />
information from the IDODB and<br />
displays it in a web-based interface.<br />
Additionally, the API facilitates the<br />
development of add-ons and plugins.<br />
Icinga Web is designed to be a stateof-the-art<br />
web interface that is easily<br />
customized for administrators to keep<br />
an eye on the state of the systems<br />
they manage. At the time of writing,<br />
Icinga Web was in beta, and it has a<br />
couple of bugs that make it difficult<br />
to recommend for production use.<br />
If you only need to monitor a single<br />
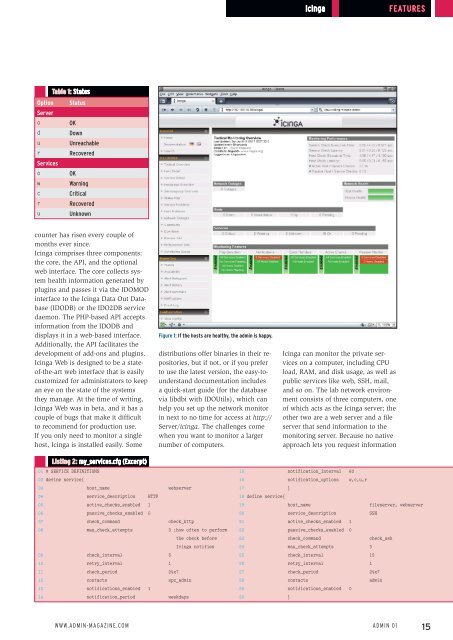
host, Icinga is installed easily. Some<br />
Figure 1: If the hosts are healthy, the admin is happy.<br />
distributions offer binaries in their repositories,<br />
but if not, or if you prefer<br />
to use the latest version, the easy-tounderstand<br />
documentation includes<br />
a quick-start guide (for the database<br />
via libdbi with IDOUtils), which can<br />
help you set up the network monitor<br />
in next to no time for access at http://<br />
Server/icinga. The challenges come<br />
when you want to monitor a larger<br />
number of computers.<br />
Icinga can monitor the private services<br />
on a computer, including CPU<br />
load, RAM, and disk usage, as well as<br />
public services like web, SSH, mail,<br />
and so on. The lab network environment<br />
consists of three computers, one<br />
of which acts as the Icinga server; the<br />
other two are a web server and a file<br />
server that send information to the<br />
monitoring server. Because no native<br />
approach lets you request information<br />
Listing 2: my_services.cfg (Excerpt)<br />
01 # SERVICE DEFINITIONS<br />
02 define service{<br />
03 host_name webserver<br />
04 service_description HTTP<br />
05 active_checks_enabled 1<br />
06 passive_checks_enabled 0<br />
07 check_command check_http<br />
08 max_check_attempts 3 ;how often to perform<br />
the check before<br />
Icinga notifies<br />
09 check_interval 5<br />
10 retry_interval 1<br />
11 check_period 24x7<br />
12 contacts spz_admin<br />
13 notifications_enabled 1<br />
14 notification_period weekdays<br />
15 notification_interval 60<br />
16 notification_options w,c,u,r<br />
17 }<br />
18 define service{<br />
19 host_name fileserver, webserver<br />
20 service_description SSH<br />
21 active_checks_enabled 1<br />
22 passive_checks_enabled 0<br />
23 check_command check_ssh<br />
24 max_check_attempts 3<br />
25 check_interval 15<br />
26 retry_interval 1<br />
27 check_period 24x7<br />
28 contacts admin<br />
29 notifications_enabled 0<br />
30 }<br />
www.admin-magazine.com<br />
Admin 01<br />
15