FLEISCHWIRTSCHAFT international_04_2018
- No tags were found...

You also want an ePaper? Increase the reach of your titles
YUMPU automatically turns print PDFs into web optimized ePapers that Google loves.
.......................................................<br />
Fleischwirtschaft <strong>international</strong> 4_<strong>2018</strong><br />
43<br />
Research & Development<br />
Calorific value<br />
Two grams of sample was electrically burnt in excess of oxygen in a bomb<br />
calorimeter. The maximum temperature rise of the bomb calorimeter was<br />
measured with a thermocouple and a galvanometer system. By comparing this<br />
rise with that obtained when a sample of known calorific value is burnt, the<br />
calorific value of the sample material could be determined. Gross energy of<br />
samples was determined by a Gallenkamp and Ballistic Bomb Calorimeter (HAQUE<br />
andMURALI LAL, 1999).<br />
Water activity (aw)<br />
The water activity of functional mutton patties was measured by an Aqua LAB<br />
dew point water activity meter 4TE.<br />
Total phenolics<br />
The total phenolic content in the phyto-ingredients powder and mutton patties<br />
were quantified using the Folin-Ciocalteu colorimetric method as described by<br />
MAKKAR (2000). Suitable aliquots of the extracts were taken in test tubes, and<br />
the volume was made upto 0.5 ml with distilled water and 0.25 ml Folin-Ciocalteu<br />
(1N) reagent was added and then the reaction was neutralized by addition<br />
with 1.25 ml sodium carbonate solution (20%). The tubes were vortexed and the<br />
absorbance of the resulting blue color was measured using a Beckman DU-640<br />
UV/Vis spectrophotometer at 760 nm against blank after incubation for 40min<br />
at room temperature. From the standard calibration curve equation y= f(x) the<br />
quantification of phenolics was done and expressed as mg tannic acid equivalents<br />
per gram of sample.<br />
Texture profile analysis<br />
The texture profile of mutton patties was measured with the help of instrumental<br />
texture profile analyzer (TAHD Plus Texture analyser). The procedure used for<br />
instrumental texture profile analysis was similar to those described by BOURNE<br />
(1978). Chilled samples were tempered to bring to room temperature and were<br />
cut into 1cm squares. The samples were placed on a platform in a fixture and<br />
compressed twice to 85% of their original height by a compression probe (P75)<br />
at a cross head speed of 10 mm/s through a two cycle sequence, using a 50 kg<br />
load cell.<br />
Antioxidant capacity<br />
Total Phenolics by F-C Method<br />
Dried (finely ground) phyto-ingredients powder (0.2g) was taken in a centrifuge<br />
tube of 25 ml capacity. 10 ml of aqueous acetone (70%) was added and subjected<br />
to centrifugation for 10 min at 3000 g in a REMI research centrifuge and<br />
then the contents were cooled by keeping the centrifuge tube in the refrigerator<br />
at 4±1°C (MAKKAR, 2000). Five gram of mutton patties was taken in a beaker<br />
of 100ml capacity. 25 ml of aqueous ice cold 70% acetone was added and<br />
subjected to homogenization for 60 s in an Ultra Turrax T25 tissue homogenizer<br />
(Janke and Kenkel IKA Labortechnik, Germany) and then the beaker was<br />
wrapped with aluminium foil and kept overnight for extraction at a refrigeration<br />
temperature of 4±1°C (NAVEENA et al., 2008).<br />
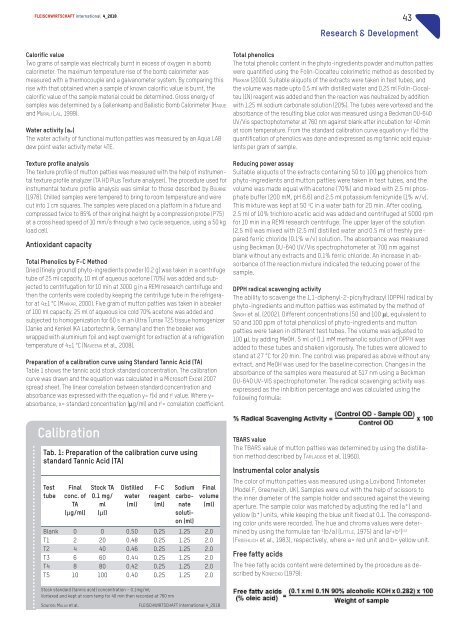
Preparation of a calibration curve using Standard Tannic Acid (TA)<br />
Table 1 shows the tannic acid stock standard concentration. The calibration<br />
curve was drawn and the equation was calculated in a Microsoft Excel 2007<br />
spread sheet. The linear correlation between standard concentration and<br />
absorbance was expressed with the equation y= f(x) and r 2 value. Where y=<br />
absorbance, x= standard concentration (µg/ml) and r 2 = correlation coefficient.<br />
Reducing power assay<br />
Suitable aliquots of the extracts containing 50 to 100 µg phenolics from<br />
phyto-ingredients and mutton patties were taken in test tubes, and the<br />
volume was made equal with acetone (70%) and mixed with 2.5 ml phosphate<br />
buffer (200 mM, pH 6.6) and 2.5 ml potassium ferricynide (1% w/v).<br />
This mixture was kept at 50 o C in a water bath for 20 min. After cooling,<br />
2.5 ml of 10% trichloro acetic acid was added and centrifuged at 5000 rpm<br />
for 10 min in a REMI research centrifuge. The upper layer of the solution<br />
(2.5 ml) was mixed with (2.5 ml) distilled water and 0.5 ml of freshly prepared<br />
ferric chloride (0.1% w/v) solution. The absorbance was measured<br />
using Beckman DU-640 UV/Vis spectrophotometer at 700 nm against<br />
blank without any extracts and 0.1% ferric chloride. An increase in absorbance<br />
of the reaction mixture indicated the reducing power of the<br />
sample.<br />
DPPH radical scavenging activity<br />
The ability to scavenge the 1,1-diphenyl-2-picrylhydrazyl (DPPH) radical by<br />
phyto-ingredients and mutton patties was estimated by the method of<br />
SINGH et al. (2002). Different concentrations (50 and 100 µL equivalent to<br />
50 and 100ppm of total phenolics) of phyto-ingredients and mutton<br />
patties were taken in different test tubes. The volume was adjusted to<br />
100 µL by adding MeOH. 5ml of 0.1mM methanolic solution of DPPH was<br />
added to these tubes and shaken vigorously. The tubes were allowed to<br />
stand at 27 °C for 20 min. The control was prepared as above without any<br />
extract, and MeOH was used for the baseline correction. Changes in the<br />
absorbance of the samples were measured at 517 nm using a Beckman<br />
DU-640 UV-VIS spectrophotometer. The radical scavenging activity was<br />
expressed as the inhibition percentage and was calculated using the<br />
following formula:<br />
Calibration<br />
Tab. 1: Preparation of the calibration curve using<br />
standard Tannic Acid (TA)<br />
Test<br />
tube<br />
Final<br />
conc. of<br />
TA<br />
(µg/ml)<br />
Stock TA<br />
0.1 mg/<br />
ml<br />
(µl)<br />
Distilled<br />
water<br />
(ml)<br />
F-C<br />
reagent<br />
(ml)<br />
Sodium<br />
carbonate<br />
solution<br />
(ml)<br />
Final<br />
volume<br />
(ml)<br />
Blank 0 0 0.50 0.25 1.25 2.0<br />
T1 2 20 0.48 0.25 1.25 2.0<br />
T2 4 40 0.46 0.25 1.25 2.0<br />
T3 6 60 0.44 0.25 1.25 2.0<br />
T4 8 80 0.42 0.25 1.25 2.0<br />
T5 10 100 0.40 0.25 1.25 2.0<br />
Stock standard (tannic acid) concentration – 0.1mg/ml;<br />
Vortexed and kept at room temp for 40 min then recorded at 760 nm<br />
Source: MALAV et al. <strong>FLEISCHWIRTSCHAFT</strong> <strong>international</strong> 4_<strong>2018</strong><br />
TBARS value<br />
The TBARS value of mutton patties was determined by using the distillation<br />
method described by TARLADGIS et al. (1960).<br />
Instrumental color analysis<br />
The color of mutton patties was measured using a Lovibond Tintometer<br />
(Model F, Greenwich, UK). Samples were cut with the help of scissors to<br />
the inner diameter of the sample holder and secured against the viewing<br />
aperture. The sample color was matched by adjusting the red (a*) and<br />
yellow (b*) units, while keeping the blue unit fixed at 0.1. The corresponding<br />
color units were recorded. The hue and chroma values were determined<br />
by using the formulae tan -1 (b/a) (LITTLE, 1975) and (a 2 +b 2 ) 1/2<br />
(FROEHLICH et al., 1983), respectively, where a= red unit and b= yellow unit.<br />
Free fatty acids<br />
The free fatty acids content were determined by the procedure as described<br />
by KONIECKO (1979):