GEOmedia_3_2018
GEOmedia - the first Italian magazine on geomatics
GEOmedia - the first Italian magazine on geomatics

Create successful ePaper yourself
Turn your PDF publications into a flip-book with our unique Google optimized e-Paper software.
Rivista bimestrale - anno XXII - Numero 3/<strong>2018</strong> - Sped. in abb. postale 70% - Filiale di Roma<br />
TERRITORIO CARTOGRAFIA<br />
GIS<br />
CATASTO<br />
3D<br />
INFORMAZIONE GEOGRAFICA<br />
FOTOGRAMMETRIA<br />
URBANISTICA<br />
GNSS<br />
BIM<br />
RILIEVO TOPOGRAFIA<br />
CAD<br />
REMOTE SENSING SPAZIO<br />
EDILIZIA<br />
WEBGIS<br />
UAV<br />
SMART CITY<br />
AMBIENTE<br />
NETWORKS<br />
LiDAR<br />
BENI CULTURALI<br />
LBS<br />
Mag/Giu <strong>2018</strong> anno XXII N°3<br />
La prima rivista italiana di geomatica e geografia intelligente<br />
Satellite-based<br />
Information<br />
Services for<br />
Utilities<br />
HIGH POSITIONING<br />
ACCURACY IN GNSS<br />
COPERNICUS FOR<br />
AGRICULTURE<br />
MANIFESTO OF<br />
SOCIETY 5.0
Porta il #fresh surveying nel tuo business con<br />
innovazioni uniche e pratiche di GeoMax<br />
30°<br />
(video) Zoom3D Catalogo Generale Zenith 35 Pro<br />
www.geomax-positioning.it<br />
works when you do
KNOWLEDGE AND ACTION FOR PLANET EARTH<br />
This is the motto of this edition of INTERGEO <strong>2018</strong> and <strong>GEOmedia</strong> is proud to share this message!<br />
The German Minister of the Interior, Building and Community is bringing an important message about inviting us to<br />
focus on the fact that the “spatial reference is its uniting element. As a result, abstract values become maps, digital data<br />
become comprehensible facts and complex information provides us with access to the world. Be it broad access, swift<br />
processing or comprehensive interconnectedness – digital technology will make it easier for us to achieve all of this. At the<br />
same time, questions about the future of geodesy arise. How will the work routines and tasks of geodesy specialists change?<br />
How will we find our experts? How can we help them develop their expertise?”<br />
<strong>GEOmedia</strong> since many years is pushing the Italian geomatics in an international frame and INTERGEO is one of<br />
the focus event to meet international growth on the context of Geospatial 4.0, Smart City, Smart Villages, digital<br />
construction, cloud computing and the Geo artificial intelligence.<br />
The Director of the Fair remember to us “The key are always geo issues of digitalisation and the digital revolution.<br />
Without digitalisation there can be no smart cities and villages, no BIM and no eGovernment. Our industry is currently<br />
undergoing rapid change, as geoinformation is a vital element of the digital revolution. It helps make our environment<br />
available digitally in three dimensions and opens up a wealth of applications when combined with specialist data. This<br />
in turn gives rise to a whole range of new and innovative business models. In addition, the importance of artificial<br />
intelligence processes, augmented reality and virtual reality is also on the rise. These will have a huge impact on our work<br />
processes, transforming our jobs forever”.<br />
<strong>GEOmedia</strong> and INTERGEO will continuously address these issues in their respective role.<br />
Enjoy your reading,<br />
Renzo Carlucci<br />
Conoscenza e azione per il pianeta Terra<br />
Questo è il motto di questa edizione di INTERGEO <strong>2018</strong> e <strong>GEOmedia</strong> è orgogliosa di condividere questo messaggio!<br />
Il ministro dell'Interno tedesco, responsabile anche dell’edificato e della comunità, sta portando un messaggio importante<br />
invitando a concentrarsi sul fatto che "Il riferimento spaziale è elemento di unione. Di conseguenza, i valori astratti<br />
diventano mappe, i dati digitali diventano fatti comprensibili e le informazioni complesse forniscono l'accesso al mondo.<br />
Sia che si tratti di un accesso ampio, di un'elaborazione rapida o di un'interconnessione completa, la tecnologia digitale ci<br />
renderà più facile il raggiungimento di tutto questo. Allo stesso tempo, sorgono domande sul futuro della geodesia. Come<br />
cambieranno routine di lavoro e mansioni degli specialisti di geodesia? Come troveremo i nostri esperti? Come possiamo<br />
aiutarli a sviluppare la loro esperienza? "<br />
<strong>GEOmedia</strong> da molti anni sta spingendo la geomatica italiana in una cornice internazionale e INTERGEO è uno dei<br />
momenti chiave per la crescita internazionale nel contesto di Geospatial 4.0, Smart City, Smart Villages, costruzione<br />
digitale, cloud computing e geo-artificial-intelligence.<br />
E il direttore di INTERGEO ci ricorda che: "Le questioni geografiche della digitalizzazione e della rivoluzione digitale<br />
sono sempre questioni chiave. Senza la digitalizzazione non ci possono essere città e villaggi intelligenti, nessun BIM e<br />
nessun e-Government. Il nostro settore sta attualmente subendo rapidi cambiamenti, poiché la geoinformazione è un<br />
elemento vitale della rivoluzione digitale. Aiuta a rendere disponibile digitalmente il nostro ambiente in tre dimensioni<br />
e apre una vasta gamma di applicazioni combinate con dati specialistici. Ciò a sua volta dà origine a un'intera gamma di<br />
modelli di business nuovi e innovativi. Inoltre, l'importanza dei processi di intelligenza artificiale, realtà aumentata e realtà<br />
virtuale è in aumento. Questi avranno un enorme impatto sui nostri processi lavorativi, trasformando il nostro lavoro per<br />
sempre ".<br />
<strong>GEOmedia</strong> e INTERGEO affronteranno continuamente questi problemi nel loro rispettivo ruolo.<br />
Buona lettura,<br />
Renzo Carlucci
In this<br />
issue...<br />
FOCUS<br />
REPORT<br />
High positioning<br />
accuracy in GNSS<br />
systems<br />
and receivers<br />
by Marco Lisi<br />
6<br />
SECTIONS<br />
24 ESA IMAGE<br />
26 NEWS<br />
40 Italy’s National<br />
Archive of<br />
Aerial Photography<br />
48 EVENTS<br />
12<br />
seIsmIc<br />
vulnerabIlIty oF<br />
exIstIng buIldIngs:<br />
non-InvasIve<br />
approach For<br />
dynamIc<br />
behavIour<br />
ASSESMENT<br />
BY GIANLUCA ACUNZO,<br />
MICHELE VICENTINO,<br />
ANTONIO BOTTARO<br />
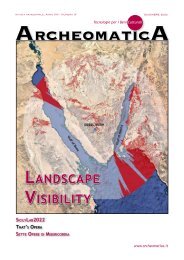
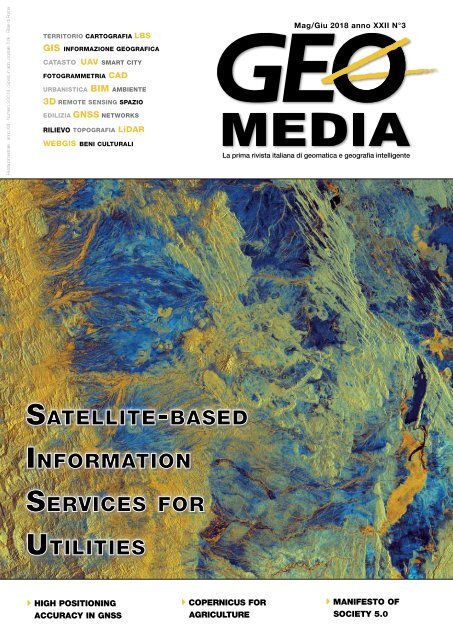
On the cover a Copernicus<br />
Sentinel-1B satellite image<br />
over Semera in northeast<br />
Ethiopia. The landscape of the<br />
Afar region is characterised<br />
by desert shrubland and<br />
volcanoes, particularly in the<br />
north. In this image we can<br />
see differences in altitude<br />
represented in the variations<br />
in colour. The left part of<br />
the image is dominated by<br />
yellow, signifying changes in<br />
vegetation found at higher<br />
altitudes. Two lakes, Hayk<br />
Lake and Hardibo Lake, are<br />
shown in the bottom left.<br />
Sentinel-1B was launched<br />
in April 2016, carrying an<br />
advanced radar instrument to<br />
provide an all-weather, dayand-night<br />
supply of imagery<br />
of Earth’s surface. This image<br />
was captured on 5 April <strong>2018</strong>.<br />
(Credits: ESA - Image of the<br />
week: "Northeast Ethiopia")<br />
22<br />
THE<br />
MANIFesto OF<br />
THE SOCIETY<br />
5.0<br />
by Bruno Ratti<br />
geomediaonline.it<br />
<strong>GEOmedia</strong>, published bi-monthly, is the Italian magazine for<br />
geomatics. Since 20 years is publishing to open a worldwide<br />
window to the Italian market and viceversa. Themes are on<br />
latest news, developments and applications in the complex<br />
field of earth surface sciences. <strong>GEOmedia</strong> dial with all activities<br />
relating to the acquisition, processing, querying, analysis,<br />
presentation, dissemination, management and use of geo-data<br />
and geo-information. The magazine covers subjects such as<br />
surveying, environment, mapping, GNSS systems, GIS, Earth<br />
Observation, Geospatial Data, BIM, UAV and 3D technologies.
ADVERTASING<br />
3DTarget 39<br />
32 Copernicus Sentinels<br />
missions and<br />
crowdsourcing as<br />
game changers for<br />
geospatial information<br />
in agriculture<br />
by Flavio Lupia,<br />
Vyron Antoniou<br />
Epsilon 27<br />
Esri Italia 31<br />
Geogrà 10<br />
Geomax 2<br />
Geospatial World Forum 29<br />
GIS3W 20<br />
Gter 22<br />
Planetek Italia 11<br />
aerRobotix 45<br />
Stonex 21<br />
Rheticus:<br />
Satellite-based<br />
Information<br />
Services for<br />
Utilities<br />
by Vincenzo Massimi<br />
36<br />
Studio SIT 35<br />
Intergeo 47<br />
Teorema 46<br />
Topcon 48<br />
42<br />
RUNNIng up<br />
that HIll<br />
Italian civic<br />
addresses and<br />
the quest for<br />
accuracy<br />
by Valerio Zunino<br />
In the background of the summary<br />
a Copernicus Sentinel-2A<br />
satellite takes us over the largest<br />
island of the Azores: São<br />
Miguel. ESA, in collaboration<br />
with the French Space Agency,<br />
CNES, is organising a symposium<br />
on 25 years of progress<br />
in radar altimetry, which will<br />
be held in Ponta Delgada from<br />
24–29 September. With global<br />
sea-level rise a global concern,<br />
the symposium will focus on<br />
the advances made in our understanding<br />
of the open ocean,<br />
the cryosphere, and coastal and<br />
land processes. The annual meeting<br />
of the Ocean Surface Topography<br />
Science Team and the<br />
International DORIS Service<br />
Workshop will also be held in<br />
the same week.<br />
This image was captured on 8<br />
September 2016.<br />
(Credits: ESA - Image of the<br />
week: "São Miguel, Azores")<br />
Science & Technology Communication<br />
Chief Editor<br />
RENZO CARLUCCI, direttore@rivistageomedia.it<br />
Editorial Board<br />
Vyron Antoniou, Fabrizio Bernardini, Mario Caporale,<br />
Luigi Colombo, Mattia Crespi, Luigi Di Prinzio,<br />
Michele Dussi, Michele Fasolo, Marco Lisi, Flavio Lupia,<br />
Beniamino Murgante, Aldo Riggio, Mauro Salvemini,<br />
Domenico Santarsiero, Attilio Selvini, Donato Tufillaro<br />
Managing Director<br />
FULVIO BERNARDINI, fbernardini@rivistageomedia.it<br />
Editorial Staff<br />
VALERIO CARLUCCI, GIANLUCA PITITTO,<br />
redazione@rivistageomedia.it<br />
Marketing Assistant<br />
TATIANA IASILLO, diffusione@rivistageomedia.it<br />
Account manager<br />
ALFONSO QUAGLIONE, marketing@rivistageomedia.it<br />
Design<br />
DANIELE CARLUCCI, dcarlucci@rivistageomedia.it<br />
MediaGEO soc. coop.<br />
Via Palestro, 95 00185 Roma<br />
Tel. 06.64871209 - Fax. 06.62209510<br />
info@rivistageomedia.it<br />
ISSN 1128-8132<br />
Reg. Trib. di Roma N° 243/2003 del 14.05.03<br />
Stampa: SPADAMEDIA srl<br />
VIA DEL LAVORO 31, 00043 CIAMPINO (ROMA)<br />
Publisher: mediaGEO società cooperativa<br />
Science & Technology Communication<br />
Paid subscriptions<br />
<strong>GEOmedia</strong> is available bi-monthly on a subscription basis.<br />
The annual subscription rate is € 45. It is possible to subscribe<br />
at any time via https://geo4all.it/abbonamento. The cost of one<br />
issue is € 9 €, for the previous issue the cost is € 12 €. Prices and<br />
conditions may be subject to change.<br />
Magazine founded by: Domenico Santarsiero.<br />
Issue closed on: 20/08/<strong>2018</strong>.
FOCUS<br />
High positioning accuracy<br />
in GNSS systems and receivers<br />
by Marco Lisi<br />
In the last few months we have been<br />
witnessing a remarkable (and, to<br />
some extent, surprising) increase<br />
of interest for GNSS high accuracy<br />
positioning, involving both systems<br />
and receivers. In particular, this<br />
growing demand for increased<br />
positioning accuracy is evident<br />
for mass-market applications,<br />
in areas such as: IoT tracking<br />
devices, wearable tracking devices,<br />
automotive, UAV’s; Robotic vehicles.<br />
Several GNSS augmentation methods<br />
have been developed over the years,<br />
aiming at improving the navigation<br />
system performance not only in terms<br />
of positioning accuracy, but also in<br />
terms of reliability, availability and<br />
sometime integrity.<br />
Satellite Based Augmentation<br />
Systems<br />
One first family of augmentation<br />
systems is based on<br />
the principle of “Differential<br />
GNSS”. This method consists<br />
in using reference receivers, positioned<br />
in fixed, well-located<br />
positions, known as “base”<br />
stations, to derive correction<br />
errors that apply with a good<br />
degree of approximation to all<br />
user receivers located nearby.<br />
Well known and already fully<br />
operational are the so-called<br />
Satellite-Based Augmentation<br />
Systems (SBAS), such as the<br />
American Wide Area Augmentation<br />
System (WAAS) and the<br />
European Geostationary Overlay<br />
Service (EGNOS) (fig. 1).<br />
These systems provide a widearea<br />
or regional augmentation<br />
of existing GNSS (e.g. GPS)<br />
through the broadcasting of<br />
additional satellite messages to<br />
users.<br />
The augmentation messages are<br />
derived after processing information<br />
collected by dedicated<br />
stations and then sent to one<br />
or more satellites (usually geostationary)<br />
for broadcast to the<br />
end users. The augmentation<br />
messages can also be broadcasted<br />
to users via Internet. This<br />
is the case of the EGNOS Data<br />
Access Service (EDAS), a terrestrial<br />
commercial service<br />
offering ground-based access<br />
to EGNOS data through the<br />
Internet on controlled access<br />
basis. Geared to users requiring<br />
Fig. 1 - Satellite Based Augmentation Systems around the world<br />
6 <strong>GEOmedia</strong> n°3-<strong>2018</strong>
FOCUS<br />
enhanced performance for professional<br />
use, EDAS provides<br />
users with the same data broadcast<br />
by the EGNOS satellites<br />
(EGNOS Message) in near realtime<br />
(fig. 2).<br />
Real –Time Kinematic (RTK)<br />
and Precise Point Positioning<br />
(PPP)<br />
Presently, GNSS correction<br />
services to achieve very high<br />
positioning (centimetre-level)<br />
accuracy are already offered to<br />
professional users. They are based<br />
on two main technologies:<br />
Real-Time Kinematic (RTK)<br />
and Precise Point Positioning<br />
(PPP).<br />
The RTK technology is a differential<br />
GNSS technique based<br />
on the use of code and carrier<br />
phase measurements from the<br />
satellites of the GNSS constellation<br />
and on corrections provided<br />
wirelessly to a user receiver<br />
by a local reference ground station,<br />
at a well-known location<br />
(fig. 3).<br />
Using carrier-phase measurements,<br />
together with ionospheric<br />
and tropospheric error<br />
corrections, allows reaching<br />
centimetre-level accuracies.<br />
The drawback is that for carrier-phase<br />
measurements, phase<br />
ambiguity has to be solved, a<br />
process requiring non-negligible<br />
convergence times.<br />
Atmospheric (ionospheric and<br />
tropospheric) corrections require<br />
a reference station (the<br />
“base station”) not too far away<br />
Fig. 2 - EGNOS System Architecture<br />
from the user (the “rover’), with<br />
baselines not longer than about<br />
15 kilometers (usually between<br />
10 and 20 km).<br />
Besides atmospheric corrections,<br />
the base station helps reducing<br />
errors from such sources<br />
as satellite clock and ephemeris.<br />
With PPP, satellite clock and<br />
orbit corrections (significantly<br />
more precise than those available<br />
in the broadcast navigation<br />
message), generated from a<br />
network of global reference<br />
stations and calculated through<br />
sophisticated algorithms by<br />
a centralized processing facility,<br />
are delivered to the end<br />
users via satellite or over the<br />
Internet (fig. 4).<br />
It is worth noting that, as<br />
compared to RTK, PPP does<br />
not provide atmospheric effects<br />
corrections. On the other<br />
hand, PPP does not require a<br />
local base station and offers a<br />
worldwide service.<br />
Combining the precise orbit<br />
and clock corrections with a<br />
dual-frequency GNSS receiver<br />
(thus removing the first order<br />
ionospheric errors), PPP is able<br />
to provide position solutions<br />
with accuracy at centimeter<br />
level.<br />
As compared to RTK, PPP<br />
offers a worldwide service<br />
and, being based on a global<br />
network of reference stations,<br />
guarantees a highly redundant<br />
and robust infrastructure (while<br />
RTK is totally dependent on<br />
the availability of the local base<br />
station). One drawback of PPP<br />
Fig. 3 - Real-Time Kinematic Concept<br />
Fig. 4 - Precise Point Positioning Concept.<br />
<strong>GEOmedia</strong> n°3-<strong>2018</strong> 7
FOCUS<br />
is that the processing algorithms<br />
generating orbit and clock<br />
corrections require rather long<br />
convergence times to achieve<br />
maximum performance, although<br />
real-time or quasi realtime<br />
PPP systems are being<br />
developed.<br />
Summarizing, both RTK and<br />
PPP technologies are able to<br />
provide positioning accuracies<br />
in the order of few centimeters,<br />
with reasonable convergence<br />
times, while single-frequency<br />
pseudorange-based positioning<br />
using navigation message data<br />
provides meter-level accuracy<br />
at best.<br />
System-Level High Accuracy<br />
Services<br />
As already mentioned, technologies<br />
for very accurate positioning,<br />
such as RTK and PPP,<br />
have been adopted so far mostly<br />
by professional users, not<br />
targeting mass-market applications<br />
such as, e.g., smartphones.<br />
Something is changing, as far<br />
as system-level solutions are<br />
concerned.<br />
In Japan, the GPS-based, regional<br />
Quasi-Zenith Satellite<br />
System (QZSS) is already planning<br />
to provide centimetrelevel<br />
positioning and navigation<br />
services over the Japanese<br />
territory. The system is based<br />
on more than one thousand<br />
reference stations to constantly<br />
correct satellite errors. The corrected<br />
data is then compressed<br />
for real-time transmission back<br />
to the constellation of three satellites<br />
for broadcasting to user<br />
receivers.<br />
In Europe, a fairly radical and<br />
strategic decision was taken in<br />
March <strong>2018</strong>, with the Implementing<br />
Decision by the European<br />
Commission redefining<br />
the scope of the Galileo Commercial<br />
Service.<br />
The EC decision, recognizing<br />
the increasing demand for higher<br />
positioning accuracy by<br />
fast expanding sectors, such as<br />
autonomous vehicles, robotics<br />
and drones, introduced a “freeaccess”<br />
High Accuracy Commercial<br />
Service (HA CS) on E6<br />
signal, allowing users “to obtain<br />
a positioning error of less than<br />
two decimetres in nominal<br />
conditions of use”. The convergence<br />
time of this new service<br />
should be , on the other hand,<br />
in the order of about five minutes,<br />
thus making it attractive<br />
for mass-market applications,<br />
including smartphones, but<br />
not in direct competition with<br />
“external” services such as RTK<br />
and PPP.<br />
The approach of offering the<br />
High Accuracy Commercial<br />
Service (HA CS) to all interested<br />
users on a free of charge<br />
basis, with content and format<br />
of data publicly and openly<br />
available on a global scale, was<br />
deemed to increase the public<br />
benefit delivered by Galileo. It<br />
was also estimated that it will<br />
contribute to position Galileo<br />
in the market as the first GNSS<br />
system offering high accuracy<br />
services on a free of charge basis.<br />
On the other hand, since<br />
departing from the scheme originally<br />
foreseen by Implementing<br />
Decision (EU) 2017/2243<br />
of 8 February 2017, the new<br />
Implementing Decision was<br />
taken after consultation with all<br />
potential stakeholders.<br />
The practical implementation<br />
of the EC decision is being<br />
studied jointly by the European<br />
GNSS Agency and ESA, leading<br />
to industrial developments<br />
in 2019.<br />
Multi-Constellation, Dual-Frequency<br />
GNSS Receivers for<br />
mass-Market Applications<br />
A little revolution is also taking<br />
place in the world of GNSS<br />
receivers and chipsets manufacturers:<br />
four major companies<br />
(Broadcom, Intel, STMicroelectronics<br />
and U-blox) decided<br />
to make commercially available<br />
for mass market applications<br />
dual-frequency receivers, offering<br />
position accuracies down<br />
to 30 centimeters (fig. 5). Several<br />
flagship smartphones are<br />
planning to integrate them in<br />
<strong>2018</strong>.<br />
The technical specifications<br />
and technological solutions<br />
adopted vary slightly among<br />
the four manufacturers, but<br />
they all start from recognizing<br />
the same market requirements:<br />
Fig. 5 - Broadcom and U-blox Multi-Constellation, Dual-frequency Receivers.<br />
4Smartphones, IoT, wearable<br />
and other mobile devices;<br />
4Commercial unmanned<br />
vehicle applications (drones,<br />
heavy trucks, UAVs);<br />
4Applications in “hostile” urban<br />
environments;<br />
4Assisted and autonomous<br />
driving;<br />
4Automotive safety compliance<br />
(ISO 26262, ASIL);<br />
8 <strong>GEOmedia</strong> n°3-<strong>2018</strong>
FOCUS<br />
4Built-in integrity checking;<br />
4Built-in jamming and spoofing<br />
detection capabilities;<br />
4Sensor data fusion.<br />
In particular, the lane-level navigation<br />
accuracy on highways<br />
(to allow Lane-Departure Warning,<br />
LDW) seems to be a very<br />
important requirement for car<br />
manufacturers.<br />
All receivers of new generation,<br />
apart from some technical differences,<br />
are essentially based<br />
on the same architecture: multi-constellation,<br />
dual-frequency,<br />
high power efficiency, low cost.<br />
The dual-frequency capability<br />
(L1/E1 and L5/E5) makes<br />
them able to better cope with<br />
reflections off buildings in<br />
urban environments: multipath<br />
correction, detection of<br />
reflected signals, ionospheric<br />
errors correction, resolution<br />
of phase ambiguity (in case<br />
carrier-phase measurements are<br />
performed) are all made possible.<br />
It is worth noting that dualfrequency<br />
operation starts<br />
being attractive because as from<br />
<strong>2018</strong> there are enough L5/E5<br />
satellites in orbit (about 30,<br />
including Galileo, GPS-3 and<br />
QZSS).<br />
Fig. 6 - Google Prototype Driverless Car<br />
Advanced Processing Software<br />
for Autonomous Driving<br />
Autonomous and connected<br />
vehicles are positioning<br />
themselves among the most disruptive<br />
mass-market technologies<br />
of the future. Despite some<br />
unfortunate accidents and a<br />
rather different approach to<br />
standardization and regulation,<br />
the deployment of autonomous<br />
vehicles will soon become a reality<br />
on US and European road<br />
networks.<br />
Autonomous vehicles can take<br />
over activities traditionally performed<br />
by the driver, thanks to<br />
their ability to sense the environment,<br />
navigate and communicate<br />
with other vehicles and<br />
road infrastructure when combined<br />
with connected vehicle<br />
solutions. Widespread adoption<br />
of autonomous driving can<br />
reduce traffic accidents, reduce<br />
fuel consumption and improve<br />
traffic flow, as well as improve<br />
driver comfort.<br />
The adoption of autonomous<br />
driving is probably going<br />
to happen much faster than<br />
everyone thinks, following<br />
adoption curves closer to those<br />
typical for digital technologies,<br />
rather than to those typical for<br />
transportation systems.<br />
In other words, while cars took<br />
decades to be widely adopted,<br />
autonomous driving will have a<br />
worldwide spread in just a few<br />
years.<br />
Many believe that autonomous<br />
driving will probably be the<br />
single largest societal change<br />
after the Internet. One thing is<br />
for sure: autonomous driving<br />
will destroy the traditional<br />
concept of the car as a personal<br />
good to be owned, moving to<br />
the paradigm of “transportation<br />
as a service”.<br />
For some years now big corporations<br />
such as Waymo<br />
(Waymo is an autonomous car<br />
development company and<br />
subsidiary of Google's parent<br />
company, Alphabet Inc.), Uber,<br />
Tesla, GM and many others,<br />
from Mazda to Maserati, have<br />
been testing their driverless cars<br />
(fig. 6).<br />
While all of them consider<br />
Fig. 7 - Uber Simplified Merging of Satellite SNRs and 3D Maps<br />
<strong>GEOmedia</strong> n°3-<strong>2018</strong> 9
FOCUS<br />
standard-precision GNSS as an<br />
indispensable component of<br />
their automated vehicle sensor<br />
suite, they still view it as a secondary<br />
sensor, not accurate or<br />
reliable enough for positioning<br />
the vehicle within the lane.<br />
In order to achieve the level<br />
of positioning required for the<br />
safe operation of autonomous<br />
vehicles, an intimate fusion of<br />
on-board sensors, computer 3D<br />
modelling and GNSS technologies<br />
is needed.<br />
One well known problem is<br />
that ground vehicles often operate<br />
under sky-obstructed areas,<br />
where GNSS signals can be<br />
altered or blocked by buildings<br />
and trees. In these cases, GNSS<br />
receivers<br />
can become wildly inaccurate,<br />
just when they would be most<br />
needed, i.e. in densely populated<br />
and highly built-up urban<br />
areas (where incidentally most<br />
of the users are located).<br />
Multi-constellation and dualfrequency<br />
are partially solving<br />
the problem. To further overcome<br />
this challenge, companies<br />
like Google and Uber are developing<br />
software applications<br />
to substantially improves location<br />
accuracy in urban environments<br />
utilizing 3D maps together<br />
with fairly sophisticated<br />
ray-tracing, probabilistic computations<br />
on GNSS raw data<br />
available from the on-board<br />
user receiver (fig. 7).<br />
Conclusion<br />
These recent developments in<br />
the “race” for higher positioning<br />
accuracy prove on one side<br />
that there is no single technology<br />
capable of providing a reliable<br />
and continuous solution<br />
in all environments, so the<br />
need for integration and fusion;<br />
on the other hand, that high<br />
accuracy navigation is part of<br />
a much larger technological revolution,<br />
triggered by 5G, IoT,<br />
unmanned vehicles, vehicle-toeverything<br />
(V2X), augmented<br />
reality.<br />
ABSTRACT<br />
In the last few months we have been witnessing<br />
a remarkable (and, to some extent,<br />
surprising) increase of interest for GNSS<br />
high accuracy positioning, involving both<br />
systems and receivers.<br />
In particular, this growing demand for increased<br />
positioning accuracy is evident for<br />
mass-market applications, in areas such as:<br />
IoT tracking devices, wearable tracking<br />
devices, automotive, UAV’s; Robotic vehicles.<br />
Several GNSS augmentation methods<br />
have been developed over the years, aiming<br />
at improving the navigation system<br />
performance not only in terms of positioning<br />
accuracy, but also in terms of reliability,<br />
availability and sometime integrity.<br />
KEYWORD<br />
High positioning accuracy; GNSS; autonomous<br />
driving; RTK; PPP; 5G; IoT; UAV<br />
AUTHOR<br />
Dr. ing. Marco Lisi<br />
marco.lisi@esa.int<br />
European Space Agency – ESTEC<br />
Noordwijk, The Netherlands<br />
Via Indipendenza, 106<br />
46028 Sermide - Mantova - Italy<br />
Phone +39.0386.62628<br />
info@geogra.it<br />
www.geogra.it<br />
10 <strong>GEOmedia</strong> n°3-<strong>2018</strong>
FOCUS<br />
<strong>GEOmedia</strong> n°3-<strong>2018</strong> 11
REPORT<br />
Seismic vulnerability of existing<br />
buildings: non-invasive approach for<br />
dynamic behaviour assessment<br />
by Gianluca Acunzo, Michele<br />
Vicentino, Antonio Bottaro<br />
In recent years, the partnership<br />
between the Department of<br />
Mathematics and Physics of Roma Tre<br />
University and GEOWEB S.p.A. has led<br />
to the creation of an applied research<br />
program named Metior. The main aim<br />
of this program is the research and<br />
development of a set of innovative<br />
tools for the creation of easy-tomanipulate<br />
virtual models, where<br />
the concept of measurement and<br />
geometric survey can be enhanced.<br />
Such virtual reality environments<br />
are built through<br />
photogrammetric techniques<br />
like stereoscopy, orthophotography,<br />
Digital Terrain<br />
Modeling (DTM), Digital<br />
Surface Modeling (DSM)<br />
and 3D Point Clouds joined<br />
with advanced 3D modeling<br />
and computational geometry<br />
techniques developed by the<br />
research groups of Roma Tre<br />
University (Fig. 1).<br />
Nowadays, it is well known<br />
how 3D virtual reality, and augmented<br />
virtual reality as well,<br />
can support any kind of geometric,<br />
topologic and numerical<br />
ex-post analysis just by relying<br />
on a certified instrumental data<br />
acquisition campaign.<br />
In the framework of this agreement,<br />
also a research fellowship<br />
Fig. 1 - Example of 3D point cloud created in the Metior platform.<br />
has been set up with the purpose<br />
of researching and developing<br />
new techniques and tools<br />
which may give a contribution<br />
to the workflow aimed to the<br />
reduction of the seismic risk for<br />
civil buildings.<br />
In the field of seismic vulnerability<br />
assessment there is a<br />
very useful, non-invasive and<br />
not so well-known typology of<br />
survey that can provide significant<br />
added value to such a<br />
kind of assessment. This measurement<br />
is commonly known<br />
as environmental vibration<br />
measurement. In order to understand<br />
the potential of the<br />
environmental vibrations and<br />
how they can be used, we will<br />
give a brief overview of some<br />
of the key concepts to keep in<br />
mind when talking about “seismic<br />
risk”.<br />
Therefore, what do we mean<br />
when we talk about seismic risk<br />
for a civil building?<br />
To answer this question, it is<br />
appropriate to briefly introduce<br />
the three main factors that are<br />
involved and whose combination<br />
defines the seismic risk:<br />
12 <strong>GEOmedia</strong> n°3-<strong>2018</strong>
REPORT<br />
seismic hazard (H), seismic<br />
vulnerability (V) and exposure<br />
(E). The seismic hazard is<br />
related to the site where the<br />
building is located: the hazard<br />
of a certain area is determined<br />
by the characteristics (in terms<br />
of frequency and intensity) of<br />
the earthquakes that may occur.<br />
On the other hand, seismic vulnerability<br />
is something related<br />
to the building itself and to the<br />
potential damage that could<br />
occur during a seismic event<br />
of a given intensity. Finally,<br />
exposure is related to the number<br />
of assets that are exposed<br />
to risk and takes into account<br />
the possible consequences of<br />
an earthquake, such as loss of<br />
human lives, damage to cultural<br />
heritage and damage in economic<br />
terms.<br />
The so-called seismic risk is<br />
given by the combination of<br />
these three factors and can be<br />
conceptually expressed as the<br />
product of the previously introduced<br />
terms:<br />
R=HxVxE<br />
In the first part of this article<br />
we will synthetically discuss<br />
some aspects related to hazard<br />
and vulnerability, in order to<br />
understand how the expected<br />
seismic input at the base of the<br />
building is determined for a<br />
considered site and what is important<br />
to consider when a seismic<br />
vulnerability verification is<br />
performed for a civil building.<br />
The current Italian legislation<br />
envisages that only architects<br />
and engineers are the professional<br />
figures who can deal<br />
with the seismic vulnerability<br />
assessment, in particular with<br />
regard to the aspects related to<br />
numerical modeling, structural<br />
analysis and retrofitting design.<br />
Moreover, GEOWEB strongly<br />
believes that the role of the surveyor,<br />
who is typically involved<br />
in the due diligence processes<br />
related to the certification of<br />
the actual state of buildings,<br />
can undoubtedly be actively<br />
involved in the seismic vulnerability<br />
analysis by designing,<br />
executing and validating the<br />
results of environmental vibration<br />
measurements, supporting<br />
the following structural analysis<br />
delegated by the legislation to<br />
architects and civil engineers.<br />
So, after the overview about<br />
the environmental vibrations<br />
analysis approach, some of the<br />
tools that are being developed<br />
in the context of the cooperation<br />
between GEOWEB S.p.A.<br />
and Roma Tre University, will<br />
be discussed.<br />
Fig. 2 - Seismic hazard map for Italian peninsula (INGV).<br />
Seismic hazard and expected<br />
seismic input<br />
As previously introduced, the<br />
seismic hazard of an area is basically<br />
given by its seismicity: it is<br />
expressed in probabilistic terms<br />
and it is defined, in a given<br />
area and in a certain interval of<br />
time, as the probability of an<br />
earthquake occurring beyond a<br />
certain intensity threshold.<br />
Thinking about the seismic<br />
hazard in the Italian peninsula,<br />
the first image that comes<br />
to mind is the Seismic<br />
Hazard Map produced by the<br />
Italian National Institute of<br />
Geophysics and Volcanology<br />
(INGV) (Fig. 2).<br />
The colors show the value of<br />
the Peak Ground Acceleration<br />
(PGA) for each area of the<br />
Italian soil, with colors ranging<br />
from light gray (lowest value) to<br />
purple (highest value).<br />
How should this map be read?<br />
We have just said that the<br />
hazard is defined in probabilistic<br />
terms as the probability<br />
that in a certain time lapse an<br />
earthquake with a certain intensity<br />
occurs: in this map, as<br />
described in its upper banner,<br />
what we can read is the maximum<br />
ground acceleration that<br />
has a probability of 10% to be<br />
exceeded in a time lapse of 50<br />
years on stiff soils. Without<br />
going into the details of formulas,<br />
this means that the value of<br />
acceleration we are reading is<br />
the one that has a return period<br />
of 475 years, that is the one<br />
of the seismic action used to<br />
design and verify ordinary buildings<br />
according to the Italian<br />
Building Code (NTC).<br />
Table in Fig. 3 shows the relation<br />
between the value of PGA<br />
and the corresponding seismic<br />
Fig. 3 - Seismic zone classification and PGA values.<br />
<strong>GEOmedia</strong> n°3-<strong>2018</strong> 13
REPORT<br />
Fig. 4 - Amplification of seismic waves (site effect).<br />
Fig. 5 - Simple oscillator.<br />
zone, from Zone 1 (highest<br />
hazard) to Zone 4 (lowest hazard).<br />
Furthermore, as specified in<br />
the description of the map, the<br />
value of PGA we can read is<br />
the one expected on a hard soil,<br />
corresponding to the bedrock.<br />
This allows us to introduce<br />
another fundamental aspect<br />
that must be considered to<br />
determine the value of acceleration<br />
expected at the base of the<br />
building: the soil effect.<br />
The layers of soft soil act like<br />
a filter and modify the seismic<br />
waves that arrive from the bedrock,<br />
emphasizing some of the<br />
frequencies in the signal and<br />
modifying the actual accelerations<br />
that will reach the base of<br />
the building (Fig. 4). Basically,<br />
it is like an equalizer in a hi-fi<br />
audio system: the original input<br />
signal passes through the filter<br />
that modifies its frequency<br />
content, giving the equalized<br />
signal as its output. In terms<br />
of amplitude, when a seismic<br />
wave passes from a stiffer layer<br />
to a softer one, it decreases its<br />
speed. As a consequence, in<br />
order to conserve the energy, its<br />
amplitude increases. In general,<br />
we can say that the softer the<br />
ground is, the more the accelerations<br />
on the ground level will<br />
be amplified. In light of the<br />
above, the soil plays an important<br />
role in the seismic hazard<br />
of a given site: depending on<br />
the situation, a building lying<br />
on a soft soil in a seismic zone<br />
3 could be actually subject to<br />
a higher acceleration than the<br />
one lying on a hard soil in a<br />
seismic zone 2.<br />
In conclusion, the seismic hazard<br />
gives us the value of acceleration<br />
we expect at the base<br />
of a given building, depending<br />
on the site location and the<br />
characteristics of the soil.<br />
Can we say that this acceleration<br />
is the same that acts on the<br />
building?<br />
To answer this question, let’s<br />
make a little mental experiment:<br />
let’s consider a sphere<br />
with a given mass m that lies<br />
on top of a stick, with a given<br />
stiffness k (Fig. 5). If we take<br />
the base of this object and<br />
start to move the base back<br />
and forth, the sphere on the<br />
top will start to move as well.<br />
It is easy to imagine that the<br />
sphere will not exactly follow<br />
the movement of the base, but<br />
will move in a different way,<br />
depending on the stiffness k<br />
of the stick and the mass m<br />
of the sphere. This is exactly<br />
what happens when a building<br />
is subject to an earthquake:<br />
the way in which the building<br />
tends to behave depends on<br />
the input excitation, obviously,<br />
but also on its characteristics in<br />
terms of stiffness and mass. In<br />
particular, the way a structure<br />
behaves when subject to vibration<br />
is described by its mode of<br />
vibration, that will be described<br />
further into this article.<br />
Seismic vulnerability of buildings:<br />
the local mechanism of<br />
collapse<br />
When an earthquake occurs,<br />
the ground starts moving horizontally<br />
and vertically and<br />
the building starts to sway and<br />
deform. The way in which<br />
buildings respond to a given<br />
seismic action can be very different,<br />
depending on factors like<br />
structural typology, materials,<br />
age, level of maintenance.<br />
The seismic action at the base<br />
results in an additional load<br />
that induces a further stress<br />
distribution in the structural<br />
parts. When the building has a<br />
box-like behaviour and acts as<br />
a single body, the stresses are<br />
distributed among the elements<br />
according to their stiffness and<br />
the whole structure gives a contribution<br />
in terms of resistance.<br />
This is the typical behaviour<br />
of a Reinforced Concrete (RC)<br />
building, where the frame composed<br />
by beams and columns is<br />
a continuous structure that internally<br />
distributes the stresses<br />
14 <strong>GEOmedia</strong> n°3-<strong>2018</strong>
REPORT<br />
among the elements.<br />
Unfortunately, although this<br />
kind of behaviour is highly<br />
desirable, this too often doesn’t<br />
happen in masonry structures:<br />
during the seismic event the<br />
masonry building can experience<br />
partial collapses due to<br />
the loss of equilibrium of some<br />
masonry portions. These kinds<br />
of collapses are called local collapse<br />
mechanisms and they are<br />
one of the main issues in the<br />
seismic analysis of masonry buildings.<br />
The causes of this behaviour<br />
generally lie in the lack<br />
of construction (e.g. poor masonry<br />
quality, poor connection<br />
between orthogonal walls, no<br />
connection between slabs and<br />
walls) or lack of maintenance<br />
during the building’s lifecycle.<br />
One of the most common and<br />
dangerous mechanisms of local<br />
collapse is the overturning of<br />
the perimeter walls (Fig. 6):<br />
due to poor connection with<br />
the transversal walls, a portion<br />
of the building subject to the<br />
earthquake comes loose from<br />
the rest and overturns on its<br />
base, involving one or more<br />
floors depending on the connections<br />
between the elements.<br />
When the condition of the building<br />
makes this local mechanism<br />
possible, this is generally<br />
the one that activates first, for<br />
relatively low levels of acceleration.<br />
Another local mechanism<br />
that is pretty common in masonry<br />
building is the vertical<br />
bending (Fig. 7): during the<br />
seismic event, the slab pushes<br />
against the facade and the wall<br />
bends out of its plane.<br />
This kind of mechanism is<br />
generally caused by a poor masonry<br />
quality and no connection<br />
between slabs and vertical<br />
walls and the level of acceleration<br />
required for its activation<br />
is pretty higher than the previously<br />
described overturning.<br />
For this reason, it can take<br />
place when the first mechanism<br />
is prevented by an effective<br />
connection at the top of the<br />
perimeter wall.<br />
Seismic vulnerability of buildings:<br />
the global response<br />
From a seismic point of view,<br />
a well-designed building must<br />
not be damaged by a low intensity<br />
earthquake, not structurally<br />
damaged by a medium intensity<br />
earthquake and must not collapse<br />
when a strong earthquake<br />
occurs, despite severe damages.<br />
The concept of low, medium<br />
and strong intensity is closely<br />
related to the previously described<br />
seismic hazard of the site.<br />
This is the basic philosophy of<br />
today’s seismic codes.<br />
A building in its operating<br />
conditions is mainly subject<br />
to the static loads induced by<br />
the permanent and variable<br />
loads, where the former are<br />
the weights of its structural<br />
and non-structural parts and<br />
the latter are those that are not<br />
constant over the time (e.g., the<br />
presence of people, furniture in<br />
the rooms and the action of the<br />
wind).<br />
The analysis of the previously<br />
described local mechanisms is<br />
a fundamental part in the seismic<br />
vulnerability assessment of<br />
masonry buildings, as their prevention<br />
shall ensure the desired<br />
box-like behaviour in which<br />
the structure responds to the<br />
seismic action as a single body<br />
involving all of its structural<br />
parts.<br />
In order to check how this single<br />
body will behave under a<br />
given seismic event, we have to<br />
introduce the concept of mode<br />
of vibration.<br />
Each building, and more in<br />
general each physical object, is<br />
characterized by a series of vibration<br />
modes that describe the<br />
way in which the system tends<br />
to oscillate naturally, i.e. with<br />
Fig. 6 – Example of overturning of perimeter wall.<br />
no excitation force. The frequency<br />
value at which it oscillates<br />
is called natural frequency<br />
and the shape it assumes during<br />
the oscillation is called mode<br />
shape.<br />
When the frequency of the<br />
exciting vibration is equal,<br />
or very close, to the natural<br />
frequency of a given mode of<br />
vibration, we have the phenomenon<br />
of the resonance and<br />
the system starts to oscillate<br />
according to the mode shape.<br />
A simple example of this<br />
phenomenon is given by the<br />
diapason: when you hit the<br />
diapason, it starts to vibrate ac-<br />
Fig. 7 - Example of vertical bending.<br />
<strong>GEOmedia</strong> n°3-<strong>2018</strong> 15
REPORT<br />
Fig. 8 - Apartment complex collapsed after the 1985 Mexico<br />
City earthquake.<br />
cording to its natural frequency<br />
at 440 Hz (corresponding to<br />
the musical note A4) and if we<br />
put a vibrating diapason near a<br />
still one, after a few seconds the<br />
latter will start to oscillate in<br />
the same way.<br />
The same happens for buildings:<br />
the seismic waves of an<br />
earthquake contain a number<br />
of frequencies and if the frequency<br />
content is very close to<br />
the natural frequencies of the<br />
building the resonance phenomenon<br />
induces an amplification<br />
of the strong motion. An<br />
even worse case is the double<br />
resonance phenomenon: this<br />
happens when the soil and the<br />
building have similar frequencies<br />
and they are both strongly<br />
excited by the earthquake, so<br />
that they both acts as amplifiers<br />
of the seismic motion. One of<br />
the most famous cases of double<br />
resonance is the earthquake<br />
which struck Mexico City in<br />
1985 (Fig. 8).<br />
In general, the damages produced<br />
by an earthquake tend to<br />
decrease as the distance from<br />
the epicenter increases, because<br />
the seismic waves are subject to<br />
an attenuation but in the case<br />
of Mexico City the most of the<br />
damage occurred at about 400<br />
Km from the epicenter: the<br />
softness of the soil where the<br />
city lies caused an amplification<br />
of the seismic waves and<br />
the very similar frequencies of<br />
buildings and soil has led to a<br />
double resonance phenomenon<br />
(Fig. 9).<br />
In the light of above, the correct<br />
estimation of the structural<br />
modes of vibration plays a<br />
fundamental role in the seismic<br />
vulnerability assessment. In<br />
general, they are determined<br />
through a modal analysis using<br />
a numerical model like a Finite<br />
Element (FE) model, built on<br />
the basis of data like the structural<br />
geometry, the mechanical<br />
features of the materials, the<br />
masses and their disposition<br />
(Fig. 10).<br />
Once a suitable seismic input is<br />
defined, the stress acting on the<br />
structural elements due to the<br />
seismic action are determined<br />
on the basis of the vibrational<br />
characteristics obtained with<br />
the modal analysis. Finally,<br />
the structural elements of the<br />
buildings are verified according<br />
to their material strength,<br />
considering the state of stress<br />
induced by both the static and<br />
dynamic loads, in order to<br />
assess the vulnerability of the<br />
considered building.<br />
The accuracy of the results<br />
clearly relies on the accuracy of<br />
the numerical model and one<br />
of the key aspects is a proper assessment<br />
of the mode of vibration<br />
of the structure. Upstream<br />
of a numerical model, a number<br />
of inspections and surveys<br />
are carried out in order to get<br />
the information about geometrical<br />
and mechanical features<br />
of the structural elements<br />
which will be included in the<br />
FE model.<br />
Of course, the more comprehensive<br />
these local surveys<br />
are the more accurate the global<br />
model will be in terms of<br />
modes of vibration estimation<br />
and, consequently, assessment<br />
of dynamic response of the<br />
structure. Which begs the question:<br />
is it possible to identify<br />
the real modes of vibration of<br />
an existing building, in order<br />
to compare them with the ones<br />
calculated numerically?<br />
Yes, it is. Through the dynamic<br />
identification.<br />
Dynamic identification of existing<br />
buildings<br />
Basically, a building subject to a<br />
vibration tends to act as a filter<br />
which modifies the original signal<br />
on the basis of its physical<br />
characteristics. Once again, the<br />
Fig. 9 - Soil effect during the 1985 Mexico City earthquake.<br />
Fig. 10 - Example of FE model.<br />
16 <strong>GEOmedia</strong> n°3-<strong>2018</strong>
REPORT<br />
Fig. 11 – A vibrodyne used to apply an input<br />
to a building.<br />
example of the equalizer in a<br />
hi-fi audio system that we used<br />
when talking about the soil has<br />
a good match with our specific<br />
case. The way in which the original<br />
signal is modified when<br />
passing through the building is<br />
highly dependent on its dynamic<br />
characteristics and a suitable<br />
analysis of these signals allow<br />
us to extract the vibrational<br />
characteristics of the building,<br />
i.e. its modes of vibration.<br />
The dynamic identification<br />
of an existing building can be<br />
carried out using two main<br />
techniques, which differ in<br />
terms of required equipment<br />
and implementation rules: the<br />
Experimental Modal Analysis<br />
(EMA) and the Operational<br />
Modal Analysis (OMA).<br />
Both of the techniques require<br />
the positioning of sensors in<br />
different points of the building<br />
under examination (typically<br />
accelerometers or velocimeters)<br />
in order to acquire the structural<br />
response, but the main difference<br />
between the former and<br />
the latter is due to the exciting<br />
force.<br />
In EMA, the structure is<br />
artificially excited by using<br />
equipment which applies an<br />
external known excitation (Fig.<br />
11). As these machines must<br />
be able to induce forces that<br />
involve the entire building, it<br />
is easy to imagine that they are<br />
massive equipment that have to<br />
be fixed to the structural parts,<br />
generally at the top level of the<br />
building, making their transportation<br />
and assembly very<br />
onerous. As a consequence, this<br />
kind of measurements are quite<br />
invasive and lead to the interruption<br />
of the serviceability in<br />
the examined building until all<br />
the equipment has been removed.<br />
On the contrary, in the case of<br />
OMA no external excitation<br />
force is required: the sensors<br />
placed in the structure acquire<br />
the very small vibrations induced<br />
by external factors like<br />
the people moving inside, the<br />
wind, the traffic in neighboring<br />
streets and so on. This feature<br />
implies an important advantage<br />
over the previously described<br />
EMA: such measures do not<br />
require the building to become<br />
off-limits location, as the target<br />
of the measurements are the<br />
vibrations of the building in<br />
its operational condition when<br />
subject to the so-called environmental<br />
noise. Furthermore,<br />
due to the low level of vibrations,<br />
the sensors can be often<br />
just placed on the floor with no<br />
need to drill holes in the walls.<br />
Of course, there is also some<br />
drawback: as the amplitude of<br />
the environmental vibrations<br />
can be orders of magnitude<br />
lower than the ones induced<br />
by the heavy machines used in<br />
EMA, the accelerometers to be<br />
used must have a very high sensitivity,<br />
which leads to a higher<br />
equipment cost.<br />
Despite this, it’s quite clear that<br />
in the application to the civil<br />
engineering field a non-invasive<br />
approach like the Operational<br />
Modal Analysis is much more<br />
suitable than the Experimental<br />
Modal Analysis, which remains<br />
a profitable technique widely<br />
used in fields like mechanics<br />
and aerospace engineering.<br />
Regardless of whether EMA<br />
or OMA is performed for the<br />
identification, the knowledge<br />
of the experimentally identified<br />
modes of vibration provides<br />
a significant added value to<br />
the seismic vulnerability assessment<br />
of buildings. When<br />
performing a typical seismic<br />
vulnerability analysis, the theoretical<br />
frequencies and mode<br />
shapes computed through the<br />
numerical model can be compared<br />
with the experimental<br />
ones in order to improve the<br />
accuracy of the calculation model,<br />
making it closer to the real<br />
behaviour of the considered<br />
structure.<br />
For example, the model can be<br />
calibrated by fine-tuning some<br />
of the parameters characterized<br />
by a greater uncertainty,<br />
e.g. the stiffness of the infill<br />
walls in a Reinforced Concrete<br />
building. When modeling<br />
complex buildings, the comparison<br />
between the numerical<br />
and experimental mode shapes<br />
can also highlight the need to<br />
include other structural blocks<br />
whose influence on the dynamic<br />
global response cannot be<br />
neglected.<br />
Furthermore, experimental<br />
modes of vibration can also<br />
be used to check and valida-<br />
Fig. 12 - Tool for the analysis of the local mechanisms<br />
of collapse (top) and example of two<br />
custom mechanisms (bottom).<br />
<strong>GEOmedia</strong> n°3-<strong>2018</strong> 17
REPORT<br />
te the efficiency of a seismic<br />
retrofitting, by verifying the<br />
actual match between the real<br />
dynamic behaviour and the designed<br />
one.<br />
Another application is in the<br />
structural health monitoring:<br />
the natural frequencies of a building<br />
depends on its mechanical<br />
features. The occurrence of<br />
a damage produces a reduction<br />
of the structural stiffness and<br />
a decrease in the natural frequencies.<br />
As a consequence, the<br />
comparison between the modes<br />
of vibration identified before<br />
and after a seismic event may<br />
point out a non-visible damage,<br />
which can be also located and<br />
quantified by using appropriate<br />
techniques.<br />
Fig. 13 - 3D model created from 2D floor plan in Planner.<br />
Tools and instruments: work<br />
in progress<br />
As part of the collaboration<br />
between Roma Tre University<br />
and GEOWEB S.p.A., some<br />
tools are being developed relating<br />
to the topic of seismic risk.<br />
In particular, two of them are<br />
related to the topics briefly described<br />
in this article.<br />
The first one is designed for<br />
masonry buildings and allows<br />
the practitioner to verify the<br />
potential occurrence of local<br />
mechanisms of collapse (Fig.<br />
12 - top), in accordance with<br />
the provisions of the Italian<br />
building code. This tool will<br />
be integrated in the Planner,<br />
the 2D/3D graphical editor<br />
developed by GEOWEB in its<br />
Metior Platform, which easily<br />
allows the user to create 3D<br />
models of buildings from the<br />
2D floor plans (Fig. 13), to<br />
be used for several purposes:<br />
in the context of the Selective<br />
Deconstruction, for instance,<br />
they allow to schedule, quantify<br />
and support either the demolition<br />
or the refurbishment activities<br />
aiming to maximize the<br />
amount of materials recycled<br />
or even reused, and minimizing<br />
the amount of materials<br />
dumped to landfill; an ad-hoc<br />
version of the Planner, named<br />
BaM (Building and Modeling),<br />
has been adopted in an education<br />
program which is currently<br />
being carried out at the first<br />
level of Italian secondary school<br />
to promote the adoption of<br />
recycling best practices and to<br />
raise awareness about energy<br />
saving issues.<br />
Thanks to the implementation<br />
of the previously described tool,<br />
its integration in the Planner<br />
will enable the user to choose<br />
the portion of the building –<br />
i.e. its modeled geometry - to<br />
analyze and to calculate the<br />
acceleration required for the<br />
activation of a local mechanism<br />
of collapse, comparing it with<br />
the provisions of the building<br />
code.<br />
In addition to the more common<br />
mechanisms like the<br />
previously described ones, the<br />
user is also able to define and<br />
analyze custom mechanisms,<br />
which may be required for the<br />
structural situation under examination<br />
(Fig. 12 - bottom).<br />
The second tool is focused on<br />
the dynamic identification of<br />
existing buildings and allows<br />
the practitioner to analyze the<br />
environmental vibration signals<br />
acquired by the accelerometers,<br />
supporting all the steps that<br />
lead from the model definition<br />
to the identification of the experimental<br />
modes of vibration.<br />
The software implements some<br />
robust and reliable algorithms<br />
from scientific literature for the<br />
modal parameters extraction<br />
and offers several advanced<br />
tools for signal preprocessing<br />
and the validation of the final<br />
results (Fig. 14).<br />
The software is specifically designed<br />
for application in the field<br />
of civil engineering, and thanks<br />
to its building-oriented nature,<br />
specific control indices have<br />
18 <strong>GEOmedia</strong> n°3-<strong>2018</strong>
REPORT<br />
been implemented given their<br />
relevance in the identification<br />
of buildings dynamics.<br />
The geometric information<br />
input is very flexible: geometry<br />
data import can be carried<br />
out from several widespread<br />
formats, like spreadsheets and<br />
CAD files; it is also possible to<br />
directly import geometry data<br />
from a model created in the<br />
Planner (Fig. 15).<br />
The equipment used for the<br />
acquisition is generally quite<br />
expensive, due to the high level<br />
of sensitivity required to detect<br />
small amplitude vibrations like<br />
environmental ones, and when<br />
a significant number of measuring<br />
points is required this set<br />
of instruments can cost several<br />
thousand Euros. Given the importance<br />
that this kind of measurements<br />
has in the seismic<br />
behaviour assessment of buildings,<br />
efforts are being made to<br />
develop a measurement system<br />
with a suitable trade-off between<br />
the required performance<br />
and the cost.<br />
A significant cost reduction,<br />
both in terms of hardware and<br />
software, together with the development<br />
of tools able to assist<br />
the user during the design and<br />
the execution of the measurement<br />
phase, would certainly<br />
help to increase the usage of<br />
the dynamic identification in<br />
the seismic vulnerability assessment.<br />
The implementation of a lowcost<br />
hardware will also lead<br />
to the development of an affordable<br />
monitoring system,<br />
designed to be permanently<br />
installed on the building, in<br />
order to periodically acquire<br />
environmental vibrations and<br />
perform a check of its vibrational<br />
characteristics over time.<br />
Nowadays, the Building<br />
Information Modeling (BIM)<br />
process is becoming increasingly<br />
important and widespread<br />
in the building sector,<br />
playing a key role in<br />
all stages of the building’s<br />
lifecycle - from<br />
its design to its maintenance.<br />
The tools developed<br />
in the framework of<br />
the Metior research<br />
project allow the user<br />
to create a virtual reality<br />
in which the 3D<br />
representation of the<br />
real-world objects is<br />
combined with their<br />
semantics, i.e. their<br />
features and the role they play<br />
in the building system, in full<br />
accordance to the BIM philosophy<br />
whose aim is to create a digital<br />
representation of physical<br />
and functional features of the<br />
building.<br />
As a consequence, with a view<br />
to enhancing this 3D virtual<br />
reality model, relevant information<br />
which would be helpful in<br />
safeguarding and maintaining<br />
Fig. 14 - Software for dynamic identification: signal acquisition and preprocessing<br />
panel.<br />
of existing buildings can be added.<br />
One of the next targets in<br />
the Metior platform is the integration<br />
of the semantic model<br />
with the data related to the experimental<br />
modes of vibration<br />
of the building.<br />
And this is something that, as<br />
we have seen throughout this<br />
article, can offer a huge added<br />
value in understanding the real<br />
dynamic behaviour of the existing<br />
building stock.<br />
Fig. 15 - Import of geometry from Planner 3D model.<br />
<strong>GEOmedia</strong> n°3-<strong>2018</strong> 19
REPORT<br />
REFERENCES<br />
Acunzo, G., Fiorini, N., Mori, F., Spina, D., (<strong>2018</strong>), Modal mass estimation from ambient vibrations measurement: A method for civil buildings,<br />
Mechanical Systems and Signal Processing 98C, 580-593<br />
Acunzo, G., Gabriele, S., Spina, D., Valente, C., (2014), MuDI: a multilevel damage identification platform, Proceedings of the 12th International<br />
Conference on Computational Structures Technology (CST2014), Naples, Italy, paper 123.<br />
Di Carlo A., Shapiro V., and Paoluzzi A., Linear Algebraic Representation for Topological Structures, Computer-Aided Design, Volume 46,<br />
Issue 1, January 2014, Pages 269-274<br />
Marino, E., Spini, F., Paoluzzi, A., Salvati, D., Vadalà, C., Bottaro, A., Vicentino, M. (2017), Modeling Semantics for Building Deconstruction,<br />
Proceedings of the 12th International Joint Conference on Computer Vision, Imaging and Computer Graphics Theory and Applications<br />
(VISIGRAPP 2017), Porto, Portugal, 274 - 281<br />
Norme Tecniche per le Costruzioni - Approvate con Decreto Ministeriale 17 gennaio <strong>2018</strong><br />
Ranieri, G., Fabbrocino, Operational Modal Analysis of Civil Engineering Structures: An Introduction and Guide for Applications, Springer,<br />
Berlin (2014)<br />
KEYWORDS<br />
Structural engineering; seismic risk; environmental vibration; operational modal analysis; BIM; 3D modeling<br />
ABSTRACT<br />
This paper presents a brief overview of the concept of seismic risk, with particular regard to existing civil buildings. Given that the seismic risk can be<br />
expressed as a combination involving seismic hazard and seismic vulnerability, these aspects are both discussed, describing the factors that lead to the<br />
expected seismic input at the base of a building as well as the ones determining its vulnerability.<br />
The way a building tends to react when it is subject to an external vibration is closely connected to its geometrical and mechanical features, which<br />
determine what in structural engineering are commonly called “vibrational modes”. As a consequence, an accurate estimation of these modes is a<br />
fundamental condition in order to assess the structural response under seismic action. Several experimental techniques aimed at the identification<br />
of the vibrational modes for existing buildings and the way in which such parameters can be used in the vulnerability assessment field are described<br />
in the present work.<br />
AUTHOR<br />
Gianluca Acunzo , gacunzo@os.uniroma3.it<br />
Michele Vicentino, mvicentino@geoweb.it<br />
Antonio Bottaro, abottaro@geoweb.it<br />
Geoweb<br />
SUITE DEDICATA ALLA GESTIONE E PUBBLICAZIONE<br />
DI PROGETTI QGIS SU SERVIZI WEBGIS<br />
- Pubblicazione autonoma di progetti QGIS per la condivisione<br />
delle proprie realizzazioni<br />
- Pubblicazione di servizi OGC WMS e WFS<br />
- Gestione degli accessi (anche con integrazione LDAP)<br />
- Creazione di gestionali cartografici web configurabili<br />
direttamente da QGIS<br />
- Creazione flussi di lavoro configurabili direttamente da QGIS<br />
- Strumenti di editing per la raccolta condivisa di dati geografici<br />
- Client dedicati all'utilizzo su tablet per il lavoro su campo<br />
CORSI SU PRINCIPALI SOFTWARE GEOGRAFICI OPEN SOURCE<br />
www.gis3w.it 20 <strong>GEOmedia</strong> n°3-<strong>2018</strong> - info@gis3w.it - Phone +39 349 1310164
REPORT<br />
Try the S900A with the<br />
Android Soluuon<br />
S900 | SERIES<br />
THE ITALIAN GNSS RECEIVER<br />
Meet us at<br />
HALL 12<br />
BOOTH: 12.0D.089<br />
Where Phone Contacts Contacts<br />
Follow us<br />
Via Cimabue, 39<br />
20851, Lissone (MB)<br />
Tel. +39 039 2783008 / +39 039 2785575<br />
Fax +39 039 2789576<br />
www.stonex.it<br />
info@stonex.it - sales@stonex.it<br />
<strong>GEOmedia</strong> n°3-<strong>2018</strong> 21
REPORT<br />
THE MANIFESTO OF THE SOCIETY 5.0<br />
Ground movements are common<br />
phenomena across Europe and<br />
worldwide. It is known that<br />
sometimes they can be quite<br />
severe, causing displ There is a<br />
tide in the affairs of men.<br />
Which, taken at the flood, leads<br />
on to fortune; Omitted, all the<br />
voyage of their life Is bound in<br />
shallows and in miseries. dal<br />
“Giulius Caesar” di Shakespeare<br />
acement of upto one meter over<br />
few years. Actually, movements of<br />
only few centimetres can cause<br />
damage around buried pipes and<br />
infrastructures.<br />
This Manifesto is addressed<br />
to all the participants of the<br />
Digital Revolution (scientists,<br />
technologists, administrators, entrepreneurs)<br />
who, in the context<br />
of social transformations induced<br />
by new technologies, want to contribute<br />
to creating the future of<br />
our children according to ideals<br />
of positive and sustainable values.<br />
Today, we are at the beginning of<br />
the Digital Revolution and like all<br />
revolutions, at this stage, it is not<br />
possible to predict with certainty<br />
what the social outcomes will be.<br />
Premise<br />
Social development has always<br />
been featured by epic transitions<br />
enabled by technological innovation.<br />
Nowadays technology is<br />
not just more powerful than it<br />
used to be in the past, it is different<br />
too: it generated a Digital<br />
Revolution that is creating a new<br />
knowledge ecosystem that includes<br />
all the topics.<br />
The Manifesto of Society 5.0<br />
is a call to action. Through the<br />
Manifesto I wanted to state, in<br />
this early stage of Digital revolution,<br />
the importance of a<br />
model of society called ‘Society<br />
5.0’ which, setting Man and his<br />
needs in the focus point, is able<br />
to answer the challenges of his<br />
own time balancing economic<br />
progress and social issues solutions.<br />
With the ‘Society 5.0’ the<br />
look on Industry 4.0 becomes<br />
wider: from the optimisation of<br />
production processes to the actual<br />
treatment of social subjects,<br />
with the aim of reaching a<br />
complete cooperation between<br />
Technology, Artificial intelligence<br />
and Mankind.<br />
In order to realize the Vision<br />
of Society 5.0 is necessary a paradigma<br />
that starts from needs<br />
& solutions mapping to C2B<br />
(citizen to business) concrete<br />
resolutions. In other words starting<br />
from citizens’ needs. The<br />
enabling element of this paradigma<br />
is the ‘Science of Where’,<br />
because everything starts from<br />
Humanity’s necessities.<br />
I think we can operate to determine<br />
our future to produce positive<br />
outcomes for Man, working<br />
not just at technologies but at<br />
their destination.<br />
The ‘Society 5.0’ development<br />
will happen in different geographical<br />
areas and at different<br />
times because it is a result of the<br />
meeting - on land – between government<br />
actions and Research<br />
and Industry’s initiatives.<br />
For the objective of establishing<br />
this model of society and<br />
sharing the Manifesto, I make<br />
Geoknowledge Foundation<br />
(www.geoknowledgefoundation.<br />
com) available, as founded by<br />
me, with the aim of promoting<br />
the use of geographic knowledge<br />
for ethical-social purposes.<br />
Bruno Ratti - Founder of<br />
Geoknowledge Foundation<br />
We can instead provide innovative<br />
products and services generating<br />
technologies that vertebrate this<br />
revolution.<br />
So we can, using the Shumpeter's<br />
model, predict the possible impacts<br />
on society, but we have no answer<br />
to the question: Will the progress<br />
of technologies lead to a society<br />
that is oblivious to human needs<br />
or will it generate a society that<br />
is polarized only on productive<br />
efficiency with a labor force humiliated<br />
by the competition with<br />
Artificial Intelligence? We can only<br />
22 <strong>GEOmedia</strong> n°3-<strong>2018</strong>
REPORT<br />
say that everything will depend<br />
on how the process of change will<br />
be governed. So, it is essential to<br />
operate in order to affirm the paradigm<br />
of a society that, by leveraging<br />
new technologies, is better<br />
able to respond to the challenges<br />
of its time such as:<br />
• the protection of Creation,<br />
• safety from natural and manmade<br />
disasters,<br />
• preservation of natural and cultural<br />
heritage,<br />
• socio-economic development,<br />
• the education of the new generations,<br />
that is, "a society, with man at<br />
the center, that balances economic<br />
progress with the solution<br />
of social problems through a<br />
system that strongly integrates<br />
cyber space with physical space",<br />
defined as Society 5.0 in the 5th<br />
Science and Technology Basic<br />
Plan document published by the<br />
Japanese Government in April<br />
2016. With the Society 5.0 the<br />
Vision of the Industry 4.0 is<br />
extended, going from the optimization<br />
of production processes<br />
to the treatment of social problems,<br />
with the aim of achieving<br />
a complete collaboration between<br />
Technology, Artificial Intelligence<br />
and Man. In order to implement<br />
the Vision of the Society 5.0, a<br />
paradigm is needed which starts<br />
from the mapping of needs and<br />
solutions in terms of C2B (citizen<br />
to business), so that starts from<br />
the needs of citizens. The enabling<br />
element of this paradigm<br />
is the Science of Where, because<br />
everything starts from where<br />
human needs are. The Science<br />
of Where brings benefits in all<br />
the processes of knowledge because<br />
it combines the dimension<br />
of Where with the traditional<br />
dimensions of How, When and<br />
Why and allows to direct the focus<br />
of the social development on<br />
the individual needs.<br />
The methods and enabling<br />
technologies of the Science of<br />
Where derive from the progress<br />
of Digital Geography generated<br />
by the research and development<br />
carried out in the laboratories of<br />
the Esri (Environment Systems<br />
Research Institute). Through the<br />
Esri WebGIS platform technologies<br />
and the systemic analysis<br />
of Big Data, coming from the<br />
Internet of Things and aerospace<br />
sensors, the Science of Where is<br />
defining new ways of designing<br />
and living the environment and<br />
the city. By predicting the social<br />
consequences of the Digital<br />
Revolution, we are faced with a<br />
dilemma: will the innovation process<br />
be governed only to increase<br />
the production capacity of the<br />
machines, or will the innovation<br />
process be governed to respond to<br />
the vital needs of man?<br />
It does not seem opportune to<br />
me to leave to historians the task<br />
of diagnosing, once things are<br />
done, how social development<br />
will have been determined as a<br />
result of the Digital Revolution.<br />
I call for action in order to<br />
contribute to the realization<br />
of the Vision of our future according<br />
to a humanistic ideal.<br />
It is essential to act, because as<br />
Jack Dangermond says: Vision<br />
without Action is only a dream,<br />
Action without Vision is a hobby,<br />
Vision and Action together<br />
can change the world. To implement<br />
this action I propose to<br />
apply the Futurecraft method,<br />
"the art of building the future:<br />
hypothesizing future scenarios<br />
examining the consequences and<br />
needs and sharing the results, to<br />
allow an exchange of ideas and<br />
open a public debate", as Carlo<br />
Ratti writes in his book "The<br />
City of Tomorrow". The target<br />
is therefore to create a society<br />
vision, where a higher value is<br />
recognized for human interaction<br />
with technology and the Society's<br />
ethical, social and economic values<br />
are rooted throughout the<br />
Society 5.0. The development of<br />
a Society 5.0 will take place in<br />
different countries with different<br />
methods and timing, because it<br />
will depend on the meeting that<br />
will take place between the actions<br />
of governments and the initiatives<br />
of Industry and Research.<br />
In order to do this, I propose that<br />
all those who wish to contribute<br />
to the realization of this Vision<br />
constitute in their countries a<br />
Community which, operating<br />
according to the sharing and reuse<br />
paradigms of the Knowledge<br />
Society, guarantee:<br />
• the verbalization of a common<br />
epistemology 5.0;<br />
• coordination of public or private<br />
initiatives;<br />
• sharing and reuse of the results<br />
of the experiments;<br />
• assessment of the social impact<br />
of initiatives;<br />
• conducting a public debate on<br />
the results achieved.<br />
As a community aggregation<br />
point, I make available the<br />
Academy of the Geoknowledge<br />
Foundation founded by me to<br />
promote the use of Geographical<br />
Knowledge for ethical and social<br />
purposes www.geoknowledgefoundation.it.<br />
The action of the Communities<br />
will realize our ideal of contributing<br />
to the creation of a future<br />
with a human face.<br />
Bruno Ratti<br />
<strong>GEOmedia</strong> n°3-<strong>2018</strong> 23
Cabo Verde<br />
For World Oceans Day, the Copernicus Sentinel-3A satellite<br />
takes us over the Atlantic Ocean and the Republic of Cabo<br />
Verde.<br />
Several of the small islands that make up the archipelago of Cabo Verde can<br />
be seen peeking out from beneath the clouds. These volcanic islands lie in the<br />
Atlantic Ocean about 570 km off the west coast of Senegal and Mauritania, which<br />
frame the image on the right.<br />
The most striking thing about this image, however, is the dust and sand being carried<br />
by the wind towards Cabo Verde from Africa. The sand comes mainly from the Sahara and<br />
Sahel region. Owing to Cabo Verde's position and the trade winds, these storms are not uncommon<br />
and can disrupt air traffic.<br />
However, this sand also fertilises the ocean with nutrients and promotes the growth of phytoplankton,<br />
which are microscopic plants that sustain the marine food web.<br />
The iron in the dust is particularly important. Without iron mammals cannot make haemoglobin<br />
to transport oxygen around the bloodstream and plants cannot make chlorophyll to photosynthesise.<br />
Research has shown that around 80% of iron in samples of water taken across the North Atlantic<br />
originates from the Sahara. It can be assumed, therefore, that life in the deep ocean<br />
depends on this delivery of fertiliser from one of the worldís most parched regions.<br />
World Oceans Day takes place on 8 June each year and celebrates the ocean, its importance<br />
in all our lives, and how we can protect it.<br />
This image was captured on 30 May <strong>2018</strong>.<br />
(Credits: ESA - Image of the week: "Capo Verde".
MERCATO<br />
PIX4D’S FIRST FULLY DEDICATED PRODUCT<br />
FOR AGRICULTURE – PIX4DFIELDS: CREATED<br />
WITH THE INPUT OF FARMERS, AGRONOMISTS<br />
AND BREEDERS IS NOW LIVE.<br />
We worked with farmers, agronomists and breeders to shape<br />
Pix4Dfields. Over the past two months, a select group of beta testers<br />
has used the product all over the world. Their feedback not<br />
only demonstrates that Pix4Dfields values real-world situations,<br />
but has also set the pace for new features you can expect to see in<br />
the coming months.<br />
Today, we are happy to announce that Pix4Dfields is now commercially<br />
available and open for everyone on both macOS and<br />
Windows.<br />
Why you should consider Pix4Dfields for your agriculture<br />
workflow:<br />
• This product is developed with input from farmers, agronomists<br />
and breeders, meaning Pix4Dfields focuses on what matters<br />
when it comes to agriculture fields of application.<br />
• Pix4Dfields is equipped with our instant results processing engine<br />
that provides accurate results faster than before.<br />
• The software has an easy-to-use interface with tools tailored to<br />
agricultural workflows.<br />
• Pix4Dfields allows you to produce results efficiently and rapidly<br />
in the field, while performing more detailed analysis in<br />
the office.<br />
• The built-in analysis tools allow you to produce accurate and<br />
repeatable measurements of crop health.<br />
‘The processing speed of Pix4Dfields is excellent. You can have<br />
your data in real time‘, Federico Alva, Consultant, ATYGES<br />
Ingeniería.<br />
‘Pix4Dfields has solved the processing bottleneck and without<br />
compromising in image resolution’, Greg Crutsinger, Drone ecologist,<br />
Scholar Farms<br />
This product will continue to grow and evolve rapidly.<br />
Pix4Dfields was designed with input from the agricultural industry,<br />
and so will continue to evolve with the feedback from<br />
our users.<br />
Pix4Dfields is now available for both macOS and Windows<br />
and supports RGB, Parrot Sequoia and MicaSense RedEdge<br />
cameras(awaiting latest firmware update)<br />
To learn more about Pix4Dfields, visit the Pix4Dfields product<br />
page and test it out one month for free.<br />
www.pix4d.com/<br />
VIDALASER AND FOIF INVITE AT<br />
INTERGEO <strong>2018</strong><br />
vidaLaser, leading company in the production of laser for tunnel<br />
excavation since 1975 with instruments designed for this specific<br />
use. vidaLaser is able to customize its products following the<br />
user's requirements and is able to produce instruments starting<br />
from the specific requirements of the user following design, construction<br />
and certification.<br />
vidaLaser is the official importer of the FOIF Company, it follows<br />
the commercialization and the official technical assistance.<br />
FOIF has been producing topographic instruments since 1958<br />
and is the world's leading company in this sector with official<br />
offices all over the world.<br />
vidaLaser has a laboratory equipped with primary instruments<br />
certified by ACCREDIA for the calibration / calibration of topographic<br />
instruments.<br />
vidaLaser uses only original and official FOIF spare parts.<br />
The technical staff, with a thirty-year experience in the service of<br />
topographic instruments, a professional training matured with<br />
refresher courses and daily experience, guarantees assistance and<br />
professionalism in the official technical assistance of all FOIF<br />
products in all its aspects.<br />
FOIF products, famous all over the world for their precision and<br />
reliability, include a wide range of topographic instruments, all<br />
characterized by a constructive excellence and a care for details<br />
that distinguish them on the world market.<br />
26 <strong>GEOmedia</strong> n°3-<strong>2018</strong>
MERCATO<br />
GNSS:<br />
- multi-constellation systems for creating CORS networks.<br />
- Multi-constellation receivers with connection to CORS<br />
networks in RTK and connection in the local BASE-<br />
ROVER system via uhf radio or via 3G telephone network<br />
- Static multi-constellation receivers for the PPK<br />
- GIS dedicated receivers<br />
Total stations:<br />
- Instruments for topographic and cadastral use.<br />
- High-precision engineering and construction tools.<br />
- Structural monitoring tools.<br />
- Tools for tunnelling with gyroscope integrated in the total<br />
station system - gyroscope, specific topographic programs<br />
and resistance to the specific work environment.<br />
Theodolites:<br />
- Mechanical instruments of very fine construction and precision<br />
in the best tradition.<br />
- Electronic instruments also with high brightness laser<br />
pointer integrated in the optical unit.<br />
Mechanical optical levels:<br />
- Self-levelling instruments for constructions.<br />
- Self-levelling instruments for high precision levelling with<br />
micrometer and reading at the invar rod.<br />
Electronic optical levels:<br />
- Instruments for levelling in the construction sector with<br />
reading of the horizontal distance, calculation of the difference<br />
in height and storage of the detected data.<br />
- High precision levelling instruments with reading at the<br />
bar code rod.<br />
vidaLaser and FOIF invite you to discover all the <strong>2018</strong> news<br />
at:<br />
INTERGEO <strong>2018</strong> 16-18 October <strong>2018</strong> Francoforte stand<br />
No: 12.0C.071<br />
info@vidalaser.com<br />
www.vidalaser.com<br />
<strong>GEOmedia</strong> n°3-<strong>2018</strong> 27
MERCATO<br />
SATELLITES AND BIG DATA ANALYTICS<br />
PROVIDE NEW EYES TO PROTECT THE SEA:<br />
LEONARDO’S SEONSE PLATFORM<br />
SEonSE (Smart Eyes on the SEas), Leonardo’s geospatial maritime<br />
security platform is now available online. Thanks to the use<br />
of cloud computing and of advanced big data analysis models,<br />
SEonSE makes it possible to access in real-time, even from tablets<br />
or smartphones, customised information on what happens at sea.<br />
The announcement was made at the “Farnborough International<br />
Airshow” exhibition being held in theUnited Kingdom, where<br />
the solution implemented by e-GEOS (a joint venture between<br />
Telespazio 80%and ASI 20%) was presented. This platform integrates<br />
data coming from multiple sources and provide smultiple<br />
services for maritime security and surveillance, monitoring of illegal<br />
traffic, environment protection as well as fight against piracy.<br />
“With SEonSE, maritime security can fully leverage on the advantages<br />
offered by digital technology. A huge amount of data is automatically<br />
processed in real-time for the protection of people and<br />
the maritime environment” declared Luigi Pasquali, Leonardo’s<br />
Coordinator of Space activities and Telespazio’s CEO. “This revolutionary<br />
platform is based on the knowledge of an industrial<br />
Group, Leonardo, a leader in the development and supply of integrated<br />
systems and technologies for maritime domain awareness,<br />
and on 25-years of experience in the Earth observation domain,<br />
with e-GEOS as an international leader.”<br />
SEonSE processes information acquired from satellites and coastline<br />
radars and merges them on an automatic and continuous basis,<br />
thanks to proprietary algorithms, with positioning data sent by<br />
vessels (AIS, VMS, LRIT), registries of ships and various databases<br />
along with meteorological and oceanographic information. This<br />
data is then compared with historical information and customary<br />
behaviors, making it possible to identify anomalous activities and<br />
potential threats to security. The result is timely and easily accessible<br />
information, crucial to identifying possible risks which are<br />
signaled by automatically generated alerts to intercept the vessel<br />
in question, to plan the actions of the relevant authorities and to<br />
trace secure routes in hostile environments.<br />
Crucial in terms of security and monitoring is the contribution<br />
of satellite images, which allow the observation on a global scale<br />
of cooperating or non-cooperating vessels – therefore even the<br />
ones that do not comply with identification requirements at sea<br />
– in any weather conditions, in remote areas, by day and night.<br />
SEonSE, in particular, combines the high resolution and the flexibility<br />
of the Italian COSMO-SkyMed radar satellite constellation<br />
with the frequency of programmed acquisitions of the Sentinels of<br />
the Copernicus European programme. In addition, the platform<br />
already allows the integration of data generated by the constellations<br />
of mini-satellites, like Planet and BlackSky, granting a nonstop<br />
and complete updating of the situation at sea.<br />
SEonSE also leverages on, in real-time, over 7 million AIS signals<br />
sent every day by about 165,000 vessels which are managed by<br />
exactEarth, the worldwide leader in Satellite AIS data services,for<br />
global tracking of commercial ships. e-GEOS and exactEarth have<br />
signed a partnership agreement at the Farnborough show.<br />
SEonSE is based on an e-GEOS’ patent for the processing of satellite<br />
data, already used in many activities for maritime security<br />
and in international projects, like OCEAN2020, the European<br />
Defence Fund strategic research programme for naval surveillance<br />
technology and maritime safety, that is led by Leonardo.<br />
RHETICUS®: THE NEW ERA OF<br />
SATELLITE MONITORING<br />
The European Copernicus Sentinel open<br />
data together with the power of cloud infrastructures<br />
provide players in the EO sector<br />
with the unprecedented opportunity to<br />
design operational Earth monitoring services,<br />
shifting from the provision of data<br />
to the provision of continuous monitoring<br />
services.<br />
At the forefront of this new innovative<br />
model there is Rheticus®, a cloud-based<br />
hub that processes satellite imagery and<br />
geospatial data automatically, and delivers<br />
geo-information services ready-to-use by<br />
end-users. Actionable information are provided by means of thematic<br />
maps, geo-analytics, pre-set reports, and alerts. Contents are<br />
dynamically displayed through an intuitive and user-friendly web<br />
dashboard, available 24/7 on any device.<br />
By integrating contents generated by Rheticus® Platform with<br />
Hexagon Geospatial’s Smart M.App technology, Planetek Italia<br />
succeeded in creating several monitoring services that provide timely<br />
solutions to address users’ needs in various industries. The<br />
result is a series of Smart M.Apps, which are able to present users<br />
with analytical views and help organizations<br />
in easily detect varied patterns<br />
and trends in data.<br />
Rheticus® Network Alert is the first<br />
successful Smart M.App developed.<br />
It helps utility companies in the complex<br />
and expensive task of the management<br />
of inspections and maintenance<br />
activities over their integrated water<br />
and sewerage networks. Among our<br />
Rheticus® active users, there are some<br />
of the largest European utility companies,<br />
as Hera Group, MM SpA, Acea.<br />
Other industry-focused Smart<br />
M.Apps are: Rheticus® Bridge Alert,<br />
Rheticus® Road Alert, Rheticus® Railways Alert and Rheticus®<br />
Infrastructure Alert, all designed around Rheticus® Displacement<br />
fueled by radar data. These vertical services transform data into<br />
actionable knowledge thanks to our business intelligence tools,<br />
overcoming the concept of static maps.<br />
By visiting https://www.rheticus.eu, it is possible to read further<br />
information and case histories, or to start using a Free Trial<br />
DEMO.<br />
28 <strong>GEOmedia</strong> n°3-<strong>2018</strong>
2-4 APRIL 2019<br />
AMSTERDAM<br />
Theme<br />
MERCATO<br />
3<br />
Days<br />
1<br />
Agenda<br />
Unlimited<br />
Content<br />
Save<br />
€500<br />
TELL YOUR STORY<br />
Register before<br />
30 October <strong>2018</strong><br />
COMMERCIALIZATION<br />
AND DEMOCRATIZATION OF<br />
EARTH OBSERVATION<br />
DATA SCIENCE SUMMIT<br />
INTERNET OF THINGS<br />
GEOINTELLIGENCE<br />
GEO4ENVIRONMENT<br />
CLOUD<br />
ARTIFICIAL<br />
INTELLIGENCE<br />
DATA SCIENCE SUMMIT<br />
LOCATION ANALYTICS &<br />
BUSINESS INTELLIGENCE<br />
BLOCKCHAIN<br />
Geo4SDGs<br />
SMART CITIES<br />
BIG DATA<br />
BLOCKCHAIN<br />
CLOUD<br />
GEO4ENVIRONMENT<br />
START-UP BOOT CAMP<br />
Co-Host<br />
Produced By<br />
www.geospatialworldforum.org<br />
<strong>GEOmedia</strong> n°3-<strong>2018</strong> 29
MERCATO<br />
calibration help you refine raw data for further analysis: you<br />
can correct images for atmospheric effects and obtain the real<br />
ground radiance or reflectance values.<br />
NEW EOS PLATFORM LETS YOU RUN IMAGE<br />
PROCESSING TASKS IN BROWSER<br />
Most of your image analysis tasks that required ENVI or Erdas<br />
Imagine software are now available online thanks to EOS<br />
Platform. This new game-changing cloud service launched by<br />
EOS Data Analytics provides GIS professionals with a one-stop<br />
solution for search, analysis, storing, and visualization of large<br />
amounts of geospatial data.<br />
With EOS Platform you get access to an ecosystem of four<br />
mutually integrated EOS products, which together provide a<br />
powerful toolset for geospatial analysts. Image data is stored in<br />
cloud-based EOS Storage and is available for image processing<br />
or remote sensing analysis at any time; this can be a raw user file,<br />
an imagery obtained from LandViewer or an output file from<br />
EOS Processing.<br />
There are at least two reasons why image processing is the platform’s<br />
major asset: the processing of large data amounts runs<br />
online and offers as many as 16 workflows with even more coming<br />
soon. On top of that, users can get the best cartographic<br />
features of EOS Vision for vector data visualization and, as announced<br />
for the future, its analysis.<br />
Data agnostic platform<br />
When it comes to raster data, you can work with a variety of<br />
satellite and airborne datasets in LandViewer, EOS Processing,<br />
and EOS Storage. Users can also upload their own GeoTiff,<br />
JPEG, JPEG 2000 files and apply GIS data processing algorithms<br />
via API or from the web interface. EOS Vision is your tool<br />
for vector data operations with multiple formats support (ESRI<br />
Shapefile, GeoJSON, KML, KMZ).<br />
The whole package for image processing<br />
EOS Processing offers a great experience with its sixteen processing<br />
workflows, including the popular raster tools (merge,<br />
reprojection, pansharpening), remote sensing analytics, photogrammetry,<br />
and proprietary feature extraction algorithms<br />
that can’t be found anywhere else. Get your data ready for the<br />
upcoming LiDAR analysis and 3D modeling as they’ll become<br />
available soon.<br />
Such pre-processing tasks as cloud detection or radiometric<br />
Object detection, change detection, and classification<br />
The convolutional neural networks, pre-trained by EOS Data<br />
Analytics to extract features from imagery, let you apply stateof-art<br />
methods to detect objects and track changes from space.<br />
4Having only a set of multi-temporal images and change detection<br />
workflow, you can track how illegal deforestation progresses<br />
over time.<br />
4Edge detection can show the exact boundaries of your agricultural<br />
lands down to the last pixel.<br />
4It is possible to estimate the parking lot traffic of largest shopping<br />
centers with car detection algorithm.<br />
The best of spectral analysis<br />
Products within EOS Platform support almost all remote sensor<br />
types and the user can choose from a long list of spectral indices<br />
to calculate on the fly. Aside from the complete set of vegetation<br />
indices (NDVI, ReCI, ARVI, SAVI, AVI, etc.), there are<br />
also indices to outline landscape features (water, snow and ice<br />
– NDWI, NDSI) and burned areas (NBR). The greatest thing<br />
is that here you get the freedom of experimenting with spectral<br />
bands and can create custom band combinations that best fit<br />
your purposes.<br />
Customize and analyze<br />
The user-friendly interface of EOS Processing makes it easy to<br />
manage processing workflows depending on the user’s business<br />
needs. You can set the parameters for processing and repeatedly<br />
use such customized workflow to automate high-frequency<br />
analytical tasks. The coming updates will add an ability to create<br />
custom algorithms from the available data processing operations.<br />
Agriculture, forestry, oil and gas, and more industries<br />
A tandem of EOS products offers a much-needed solution for<br />
individuals, businesses, and organizations across numerous industries.<br />
With vegetation indices and crop classification feature, agronomists<br />
can continuously monitor crop conditions to detect plant<br />
diseases, pests, droughts. Forestry specialists can assess fire damages,<br />
monitor forest health, track and enforce logging restrictions.<br />
EOS Platform is a great choice for regional and urban planning,<br />
helping users identify land cover classes to generate a vegetation<br />
map. It can also make a complete list of urban features like buildings,<br />
roads, and other major features in the region.<br />
The platform can tackle disaster management by measuring flood<br />
extent and finding fire boundaries. When it comes to oil<br />
and gas, it is capable of identifying oil rigs and assessing the<br />
environmental impact.<br />
EOS Data Analytics uses cloud-based services to address different<br />
verticals with a single platform, scientifically proven<br />
analytics, scale-ups and it builds products that could add value<br />
to remote sensed data to deliver expert-level results for your business.<br />
Unlock the full potential of Earth observation data with EOS<br />
Platform, directly in your browser: https://eos.com/platform<br />
30 <strong>GEOmedia</strong> n°3-<strong>2018</strong>
www.esriitalia.it<br />
Soluzioni e Tecnologie<br />
Geografiche per<br />
la Trasformazione<br />
Digitale
REPORT<br />
Copernicus Sentinels missions and<br />
crowdsourcing as game changers for<br />
geospatial information in agriculture<br />
by Flavio Lupia, Vyron Antoniou<br />
Fig. 1 - Yearly occurrences of papers indexed by Google Scholars containing the<br />
keywords: "Sentinel-1" AND "agriculture"; "Sentinel-2" AND "agriculture"; "Sentinel-3"<br />
AND "agriculture".<br />
Today, new advances in science and technology and,<br />
above all, the open flow of rich datasets play a pivotal<br />
role when it comes to better manage territory and its<br />
resources. Agriculture is one of the relevant domains<br />
where data from Earth Observation and their integration<br />
with data from different sources (i.e. proximal and<br />
ground sensors and even in-situ data from human<br />
sensors) will provide many benefits. Such data-driven<br />
opportunities are the backdrop of the transition toward<br />
an innovative agriculture (see the concepts of smart<br />
farming, farming 2.0, precision farming/agriculture,<br />
digital agriculture, etc.). The following paragraphs<br />
describes briefly two new opportunities for the<br />
generation of data usable for agricultural application:<br />
remotely sensed data from the Copernicus programme<br />
and user generated data through crowdsourcing.<br />
New options for mapping and<br />
monitoring agriculture remotely<br />
Agricultural sector is getting ever<br />
more attention due to its role in<br />
feeding a growing world population<br />
by maximizing productivity<br />
and optimizing natural resources<br />
usage. At European level, agriculture<br />
has great economic<br />
relevance. According to 2013<br />
Eurostat figures, 42.5 % of the<br />
area of EU-28 was occupied by<br />
agriculture and globally the EU-<br />
28’s share was above the world<br />
average (37.9 %).<br />
More accessible data and information<br />
can benefit the agricultural<br />
sector and the effective implementation<br />
of policies such as<br />
the Common Agricultural Policy<br />
(CAP). Though the current CAP<br />
(2014-2020) has contributed<br />
to agricultural sustainability,<br />
the future CAP (beyond 2020)<br />
will strive further to facilitate<br />
smart and resilient farming and<br />
actions to meet environmental<br />
EU targets and to improve the<br />
socio-economic tissue of rural<br />
areas. Achieving these goals requires<br />
a step up in research and<br />
innovation.<br />
Copernicus, the programme for<br />
the establishment of a European<br />
capacity for Earth Observation<br />
(EO), is the chief example with<br />
its geospatial big data delivered<br />
with open data policy enacting a<br />
big leap in agricultural mapping<br />
and monitoring.<br />
Copernicus is satellite-borne<br />
EO, in-situ data and services<br />
32 <strong>GEOmedia</strong> n°3-<strong>2018</strong>
REPORT<br />
such as the Copernicus Land<br />
Monitoring Service (https://<br />
land.copernicus.eu/) providing<br />
information on land cover/land<br />
use and variables for vegetation<br />
and water cycle monitoring for<br />
applications in several domains<br />
such as agriculture.<br />
The Programme with its global<br />
coverage, powerful sensors, continuity<br />
of acquisition and open<br />
data policy is opening up new<br />
options to manage and control<br />
actions needed by CAP objectives<br />
for European agriculture.<br />
Agricultural analysis can benefit<br />
from products delivered by the<br />
first three Copernicus Sentinels<br />
missions operating with twin<br />
satellites (A and B).<br />
Sentinel-1 (S1), launched on 3<br />
April 2014 (1A) and 25 April<br />
2016 (1B), provides all-weather<br />
and day/night microwave acquisition<br />
(C-band Synthetic<br />
Aperture Radar) in four exclusive<br />
imaging modes with spatial resolutions<br />
down to 5 m and a swath<br />
width from 20 to 400 km.<br />
Sentinel-2 (S2), launched on<br />
23 June 2015 (2A) and on 7<br />
March 2017 (2B), has a spatial<br />
resolution (10, 20 and 60 m) suitable<br />
for average size of parcels<br />
in Europe, a low revisit time (5<br />
days at Equator), a multispectral<br />
sensor (visible, near-infrared<br />
and red-edge channels) and 290<br />
km swath width. These features<br />
enable applications related to<br />
seasonal and within-season crop<br />
status analysis, yield prediction<br />
and determination of nutrient<br />
and irrigation needs. The integration<br />
of S1 and S2 allows to<br />
create very dense time series for<br />
agricultural studies. Moreover,<br />
S1 complements the multispectral<br />
information of S2 by<br />
acquiring under the clouds and<br />
trough vegetation canopy.<br />
Sentinel-3 (S3), launched on<br />
16 February 2016 (3A) and 25<br />
April <strong>2018</strong> (3B), has near-daily<br />
acquisition at low resolution<br />
(300 m), two swath widths of<br />
1270 and 1420 km, a sensor<br />
with high spectral quality with<br />
three high accuracy thermal<br />
bands usable for vegetation stress<br />
monitoring. Co-location of bands<br />
between S2 and S3 and the<br />
existence of bands devoted to atmospheric<br />
corrections ensure the<br />
full integration of the products<br />
generated.<br />
As a whole, Sentinels will generate<br />
long term time series<br />
boosting several applications,<br />
including change detection of<br />
agricultural land, yield forecast<br />
and definition and calibration of<br />
agricultural models. Analytical<br />
possibilities will be much more<br />
powerful if integration with<br />
others EO open data is considered<br />
(e.g. Landsat missions).<br />
The interests about Sentinels<br />
missions and their potential application<br />
in agriculture started<br />
well in advance their operational<br />
deployment, this is well depicted<br />
by the growing trend of the<br />
occurrences of the two terms<br />
“Sentinel-x” and “agriculture”<br />
within papers indexed by Google<br />
Scholar (Figure 1).<br />
Among the relevant projects<br />
exploiting Sentinels data for<br />
agriculture, Sen4CAP (http://<br />
esa-sen4cap.org/) and Sen2-Agri<br />
(http://www.esa-sen2agri.org/)<br />
are two examples worth mentioning.<br />
Aimed at developing<br />
EO products and services with<br />
open source code, Sen4CAP is<br />
developed to increase efficiency,<br />
traceability and to reduce costs<br />
of the system managing the<br />
payments for farmers under the<br />
CAP. Sen2-Agri is designed to<br />
demonstrate, through a useroriented<br />
approach, the usability<br />
of S2 time series for agricultural<br />
monitoring for a wide range of<br />
crops and farming practices. The<br />
main output is a free and open<br />
source processing system which<br />
delivers several near real time<br />
products (e.g. vegetation status<br />
map, monthly cropland masks,<br />
crop type maps).<br />
Big geospatial data that is being<br />
generated by Sentinel’s missions<br />
call for a shift in data management<br />
and analysis in order to<br />
effectively extract powerful information<br />
to support agricultural<br />
management. New technological<br />
solutions such as cloud-based<br />
platforms and multi-core processing<br />
systems are needed to effectively<br />
manage these huge datasets.<br />
The Thematic Exploitation<br />
Platform (https://tep.eo.esa.<br />
int/) and the Copernicus Data<br />
and Information Access Services<br />
(http://copernicus.eu/news/<br />
upcoming-copernicus-data-andinformation-access-services-dias)<br />
are two interesting solutions.<br />
Crowdsourcing: the option for<br />
bottom up data generation<br />
In parallel with the authoritative<br />
initiatives for systematic EO and<br />
the collection of big geospatial<br />
data for further analysis, there<br />
are equally interesting developments<br />
at the other end of<br />
the spectrum: the citizens. The<br />
evolution of crowdsourcing,<br />
i.e. tapping the power of the<br />
crowd to achieve specific goals,<br />
usually through open and inclusive<br />
processes, has evolved<br />
into Volunteered Geographic<br />
Information (VGI) for the<br />
Geomatics domain. VGI, defined<br />
as the harnessing of tools to<br />
create, assemble, and disseminate<br />
geographic data provided voluntarily<br />
by individuals (Goodchild,<br />
2007), has transformed the way<br />
that geographic information can<br />
be collected and maintained and<br />
today intertwines with Citizen<br />
Science (CS) which promotes<br />
the volunteer from the position<br />
of simple data provider to designer<br />
and practitioner of scientific<br />
work. These developments and<br />
efforts have not been left without<br />
support by the authorities.<br />
In EU, a number of projects has<br />
<strong>GEOmedia</strong> n°3-<strong>2018</strong> 33
REPORT<br />
been funded that aim to promote<br />
the engagement of citizens<br />
to scientific endeavours (see for<br />
example Horizon 2020 DITOS<br />
project - http://www.togetherscience.eu/<br />
- or the funding of<br />
multiple projects through the<br />
COST Action Scheme).<br />
In this context, and given the<br />
individual advantages of the<br />
authoritative data acquisition on<br />
the one hand and the bottomup<br />
process of data collection on<br />
the other, a new challenge has<br />
appeared: how to combine the<br />
best of the two worlds in a way<br />
that will add value to the final<br />
products and services that reach<br />
the users. For example, effective<br />
exploitation of EO for terrestrial<br />
monitoring, and specifically<br />
for agriculture, cannot avoid<br />
the use of in-situ data necessary<br />
for calibration/validation of<br />
any derived product. Beyond<br />
the classical tools for collecting<br />
ground data, nowadays new<br />
opportunities derive from CS<br />
and VGI, where laypersons<br />
or interested stakeholders can<br />
actively or passively generate<br />
georeferenced information that<br />
can be merged with EO data.<br />
For example, both volunteers<br />
and farmers can provide relevant<br />
in-situ data on bio-geophysical<br />
properties of soils and crops. A<br />
recent study (Dehnen-Schmutz<br />
et. al., 2016) carried out in UK<br />
and France showed that farmers<br />
are confident in the use of apps<br />
and expressed interest to participate<br />
in CS projects especially<br />
for data collection and real-time<br />
monitoring. All these data can<br />
be collected and analysed with<br />
dedicated platforms so to deploy<br />
advisory services for farmers that<br />
will help them to improve crop<br />
management and production.<br />
Other examples can be found<br />
at the Spece4Agri (http://space4agri.irea.cnr.it/it),<br />
and the<br />
FOODIE (http://www.foodieproject.eu/index.php)<br />
projects<br />
which use VGI for agriculture<br />
or the LandSense (https://landsense.eu/)<br />
project that uses<br />
VGI for collecting Land Use<br />
and Land Cover (LULC) data.<br />
Space4Agri, developed a system<br />
for integrating remotely sensed,<br />
multi-source and heterogeneous<br />
data, authoritative datasets<br />
and in-situ data on crop development<br />
and agro-practices created<br />
by volunteer (agronomists,<br />
farmers and citizens) to support<br />
sustainable and precision agriculture<br />
(Bordogna et al. 2016).<br />
FOODIE is building a platform<br />
hub on the cloud where spatial<br />
and non-spatial data related to<br />
agricultural sector are available<br />
for agri-food stakeholders and<br />
can be integrated for supporting<br />
decision making process.<br />
Data are collected from different<br />
sources and made openly<br />
available (e.g. OpenStreetMap,<br />
voluntary collected data about<br />
market situation, crops yield,<br />
etc.). Finally, LandSense Citizen<br />
Observatory aggregates innovative<br />
EO technologies, mobile<br />
devices, community-based environmental<br />
monitoring, data<br />
collection, interpretation and<br />
information delivery systems in<br />
order to empower communities<br />
to monitor and report on their<br />
environment.<br />
While there are enormous potentials<br />
from the synergy of<br />
authoritative and crowdsourced<br />
EO efforts, there are equally<br />
some important caveats that<br />
need to be addressed. Perhaps,<br />
the most important one is data<br />
quality. Quality issues can be<br />
analysed from different perspective<br />
and can affect heavily<br />
the results when are used for<br />
validating remotely sensed data<br />
or used for modelling applications<br />
in agriculture. Therefore,<br />
knowing these issues is relevant<br />
as quality can affect decisions<br />
making process from the farming<br />
level (i.e. precise management<br />
of the agricultural production<br />
process) to the policy<br />
level (good implementation and<br />
monitoring of economic and environmental<br />
measures). Quality<br />
evaluation of crowdsourced data<br />
owes to cover multiple facets<br />
of data at hand, facets that are<br />
usually not considered when<br />
dealing with authoritative data.<br />
Thus, apart from the welldefined<br />
spatial quality elements<br />
(ISO 2013) of completeness,<br />
logical consistency, positional<br />
accuracy, temporal accuracy, thematic<br />
accuracy and usability that<br />
need to be thoroughly evaluated,<br />
crowdsourced geographic information<br />
should be also examined<br />
against inherent biases. It is not<br />
uncommon for volunteered<br />
datasets to suffer from temporal<br />
biases, as volunteers might be<br />
able to contribute data only on<br />
weekends or after-work hours;<br />
positional biases, as it is easier<br />
for volunteers to reach and<br />
collect data from areas in their<br />
vicinity or wherever the access is<br />
not obstructed; or participation<br />
biases, as there are social imbalances<br />
regarding the people that<br />
volunteer (i.e. it usually requires<br />
for people to have enough free<br />
time and the means to acquire<br />
the needed equipment for data<br />
collection). All these factors<br />
need to be carefully considered<br />
and evaluated (e.g. by defining<br />
protocols for data collection<br />
(Minghini et al., 2017) before<br />
using crowdsourced geographic<br />
information with authoritative<br />
EO data.<br />
34 <strong>GEOmedia</strong> n°3-<strong>2018</strong>
REPORT<br />
REFERENCES<br />
Bordogna, G.; Kliment, K.; Frigerio, L.; Stroppiana, D.; Brivio, P.A.; Crema, A.; Boschetti, M.; Sterlacchini, S. Spatial Data<br />
Infrastructure integrating multisource heterogeneous geospatial data and time series: A study case in agriculture. ISPRS Int.<br />
J. Geo-Inf. 2016, 5, 73.<br />
Dehnen-Schmutz, K., Foster, G.L., Owen, L. et al. Agron. Sustain. Dev. (2016) 36: 25. https://doi.org/10.1007/s13593-<br />
016-0359-9<br />
Goodchild, M.F. (2007). "Citizens as sensors: the world of volunteered geography".<br />
GeoJournal. 69 (4): 211–221. doi:10.1007/s10708-007-9111-y.<br />
International Organisation for Standardisation, 2013. ISO19157:2013 Geographic information - Data quality, Geneva:<br />
ISO.<br />
Joint Research Centre, (2016). Concept Note - Towards Future Copernicus Service Components in support to Agriculture?<br />
Available at: https://ec.europa.eu/jrc/sites/jrcsh/files/Copernicus_concept_note_agriculture.pdf<br />
Minghini, M, Antoniou, V, Fonte, C C, Estima, J, Olteanu-Raimond, A-M, See, L, Laakso, M, Skopeliti, A, Mooney, P,<br />
Arsanjani, J J, Lupia, F. 2017. The Relevance of Protocols for VGI Collection. In: Foody, G, See, L, Fritz, S, Mooney, P,<br />
Olteanu-Raimond, A-M, Fonte, C C and Antoniou, V. (eds.) Mapping and the Citizen Sensor. Pp. 223–247. London:<br />
Ubiquity Press. DOI: https://doi.org/10.5334/bbf.j.<br />
KEYWORDS<br />
Crowdsourcing; geospatial; remote sensing; monitoring; mapping; agriculture; Copernicus sentinels<br />
ABSTRACT<br />
A big leap in the agricultural sector is expected thanks to the operational deployment of Copernicus data and services, the new Earth Observation<br />
program of the European Commission. The huge quantity of data delivered freely along with the good level of resolution (spatial, temporal and<br />
spectral) will open up new opportunities for achieving the well-known sustainability of agriculture. At the same time, the new trends of crowdsourcing<br />
and citizen science are delivering a great deal of geographical data collected by ordinary users with a bottom-up process. The two type of data<br />
and their integration will be the base for the future application in the agricultural sector, albeit management of big geospatial dataset and quality of<br />
user generated data are issues to be addressed.<br />
AUTHOR<br />
Flavio Lupia<br />
flavio.lupia@crea.gov.it<br />
Council for Agricultural Research and Economics (CREA)<br />
Via Po, 14 00198 Roma, Italy<br />
Vyron Antoniou<br />
Multinational Geospatial Support Group<br />
Frauenberger Str. 250, 53879, Euskirchen, Germany<br />
v.antoniou@ucl.ac.uk<br />
L’eccellenza dei dati geografici<br />
Toponomastica e numerazione civica<br />
A beneficio degli ambiti di utilizzo più maturi ed esigenti, per la gestione e per la pianificazione geografica e quotidiana<br />
delle reti e delle utenze, della grande e media distribuzione, della raccolta RSU, dei sistemi navigazionali e del car-sharing,<br />
per l’attività politica e per quella amministrativa. www.studiosit.it • info@studiosit.it<br />
<strong>GEOmedia</strong> n°3-<strong>2018</strong> 35
REPORT<br />
Rheticus: Satellite-based<br />
Information Services for Utilities<br />
by Vincenzo Massimi<br />
Ground movements are<br />
common phenomena across<br />
Europe and worldwide. It<br />
is known that sometimes<br />
they can be quite severe,<br />
causing displacement of<br />
up to one meter over few<br />
years. Actually, movements<br />
of only few centimetres<br />
can cause damage<br />
around buried pipes and<br />
Fig. 1 - Satellite monitoring to prevent risks over water and sewer networks<br />
infrastructures.<br />
Traditional campaigns for<br />
the regular monitoring<br />
of large and remote<br />
areas, however, employ considerable<br />
financial resources and<br />
time, and are often complex to<br />
implement. This is the case of<br />
utility companies, which need<br />
to manage large and distributed<br />
networks buried under the<br />
ground.<br />
Even if pipes and underground<br />
networks are made with longlasting<br />
materials, they are stressed<br />
and damaged by ground<br />
movements. This leads utility<br />
companies to face continually<br />
the complex and expensive task<br />
of the maintenance of underground<br />
pipelines, in order to<br />
avoid possible heavy stress conditions<br />
and, eventually, leaks in<br />
the pipes.<br />
These leaks can then accelerate<br />
the erosion around the problem<br />
area, disrupting services<br />
and possibly creating larger<br />
problems, damage to surface facilities,<br />
properties and/or infrastructures,<br />
or exposing people<br />
to risks.<br />
Utilities spend a lot of money<br />
maintaining their networks<br />
and fighting against leakages<br />
and structural problems. Right<br />
now, companies' maintenance<br />
policies are strictly oriented to<br />
recovery their assets in case of<br />
disrupting service due to major<br />
problems. A great number of<br />
utility companies put in place<br />
activities for pipe replacement<br />
only in areas where severe subsidence<br />
phenomena reveals leaks<br />
in the pipes. Identifying ground<br />
movements before they become<br />
critical is a challenge.<br />
The use of satellite data allows<br />
overcoming these limitations<br />
and obtaining frequent, accurate<br />
and accessible information<br />
thanks to the wide availability<br />
of spatial information,<br />
even in open data mode (e.g.<br />
Copernicus Sentinels data,<br />
INSPIRE data, etc.).<br />
Satellite radar technology can<br />
give a good predictive indicator<br />
for where this may be occurring<br />
by measuring where the<br />
ground is subsiding around the<br />
pipelines. Radar data, when<br />
pushed through Interferometric<br />
Synthetic Aperture Radar<br />
(InSAR) analysis, can provide<br />
changes in the ground level<br />
with millimetre accuracy. The<br />
European Space Agency’s<br />
Copernicus programme includes<br />
SAR data from the<br />
Sentinel-1 constellation. Thus,<br />
Sentinel-1 data can be exploited<br />
to identify with high precision<br />
where the ground starts subsiding,<br />
allowing maintenance<br />
36 <strong>GEOmedia</strong> n°3-<strong>2018</strong>
REPORT<br />
Fig. 2 - List of applications by industry of the satellite-based Rheticus services.<br />
strategies focused on those areas<br />
under high risk, and before<br />
structural problems occur.<br />
Copernicus Sentinels + Cloud<br />
infrastructures: the shift to<br />
Information as-a-Service<br />
The Sentinel open data together<br />
with the power of cloud infrastructures<br />
provide players in the<br />
EO sector with the unprecedented<br />
opportunity to design operational<br />
Earth monitoring services.<br />
Shifting from the provision<br />
of data to the provision of<br />
continuous monitoring services<br />
(i.e., continuous access to information)<br />
is the key point upon<br />
which addressing real users’<br />
needs in the new Era of Big<br />
Data. Moreover, shifting from<br />
monitoring services on request<br />
to long time information services<br />
available under subscription<br />
is the real disruptive innovation<br />
in the field of EO: end-users<br />
pay for the information not for<br />
the processing.<br />
At the forefront of this new<br />
innovative model there is<br />
Rheticus, a cloud-based hub<br />
that processes satellite imagery<br />
and geospatial data automatically,<br />
and delivers geo-information<br />
services ready-to-use by endusers.<br />
Designed and developed<br />
by Planetek Italia, Rheticus<br />
moves beyond mapping visualisation,<br />
thanks to a broad range<br />
of advanced geo-analytics. It<br />
allows end-users to gain insight<br />
into patterns not easily<br />
identified through traditional<br />
approaches to better understand<br />
the whole story that lives within<br />
data related to their assets (e.g.<br />
roads, railways, buildings,<br />
dams, mines, water supply networks<br />
and utilities), combining<br />
historical and daily/weekly<br />
satellite imagery acquisitions.<br />
Actionable information are<br />
provided by means of thematic<br />
maps, geo-analytics, pre-set reports,<br />
and alerts. Contents are<br />
dynamically displayed through<br />
an intuitive and user-friendly<br />
web dashboard, available 24/7<br />
on any device or in Machineto-Machine<br />
(M2M) mode directly<br />
within users’ systems.<br />
By integrating contents generated<br />
by Rheticus Platform with<br />
Hexagon Geospatial’s Smart<br />
M.App technology, Planetek<br />
Italia succeeded in creating several<br />
monitoring services that<br />
provide timely solutions to<br />
address users’ needs in various<br />
industries and vertical markets.<br />
Planetek released four Smart<br />
M.Apps: Rheticus Network<br />
Alert, Rheticus Bridge Alert,<br />
Rheticus Railways Alert and<br />
Rheticus Infrastructure Alert,<br />
all designed around Rheticus<br />
Displacement fuelled by radar<br />
data. These vertical services<br />
transform data into actionable<br />
knowledge thanks to our business<br />
intelligence tools, overcoming<br />
the concept of static<br />
maps.<br />
Rheticus Network Alert: using<br />
satellite Radar data to identify<br />
ground instabilities.<br />
Rheticus Network Alert is a<br />
turnkey web service that helps<br />
utility companies in the management<br />
of inspections and<br />
Fig. 3 - Screenshot of the Rheticus platform showing displacement monitoring over the city of Milan, Italy.<br />
<strong>GEOmedia</strong> n°3-<strong>2018</strong> 37
REPORT<br />
maintenance activities over their<br />
integrated water and sewerage<br />
networks. By using satellite<br />
radar data to identify ground<br />
instabilities, Rheticus Network<br />
Alert provides operators with an<br />
always updated log of hot spots<br />
within their network that can<br />
reveal leaking pipes.<br />
Thus, network's operators can<br />
act on the information they<br />
have. The service provides all the<br />
information by means of geoanalytics,<br />
maps and reports, released<br />
on a monthly basis. Instead<br />
of replacing pipes and connectors<br />
after major leakage evidence,<br />
Rheticus Network Alert allows<br />
an 'a priori' approach, replacing<br />
those pipes classified as possibly<br />
at risk and before larger problems<br />
occur. As a matter of fact,<br />
companies better manage their<br />
financial resources and reduce<br />
service disruptions and/or threats<br />
for people.<br />
Among our Rheticus active<br />
users, there are some of the largest<br />
European utility companies,<br />
which generally face costs per repair<br />
ranging between 2.500,00-<br />
5.000,00 €/km. Benefits of<br />
subscribing our Rheticus services<br />
ensure a high return on investment<br />
thanks to the chance of<br />
prevent severe damages, perform<br />
focused maintenances, and avoid<br />
costs for major repairs. Those<br />
impacts on companies’ financial<br />
statements were remarked<br />
also by EARSC in “Copernicus<br />
Sentinels’ Products Economic<br />
Value: A Case Study”. Benefits<br />
are even larger in areas exposed<br />
to landslides, subsidence<br />
and earthquakes.<br />
Hera Group: exploiting satellite<br />
data to enable the preventive<br />
maintenance of pipelines<br />
Hera, the second largest operator<br />
in Italy by volumes of water supplied<br />
(300 million cubic meters<br />
per year), has always looked with<br />
enthusiasm towards innovation,<br />
the development of new technologies<br />
and their testing. For<br />
this reason, in 2016 it was the<br />
first company in Italy to adopt<br />
a system to search of water via<br />
satellite to address the problem<br />
of hidden leaks from water networks.<br />
Subsequently, HERA decided<br />
to start a test using Rheticus system,<br />
with the aim of providing<br />
an automatic system to exploit<br />
satellite data in order to perform<br />
complex analyses, and simplify<br />
inspection planning.<br />
In 2017, HERA first subscribed<br />
to our Rheticus Displacement<br />
service, activated over the<br />
Province of Modena. In <strong>2018</strong>,<br />
HERA has adopted Rheticus<br />
Network Alert and extended the<br />
area of interest, now including<br />
also the Province of Bologna,<br />
reaching more than 6,200 km of<br />
pipelines monitored from Space<br />
over an area of about 3,500<br />
square kilometres.<br />
Furthermore, HERA Group<br />
incorporates sophisticated<br />
equipment (e.g., smart meters,<br />
traffic-monitoring systems) together<br />
with information from<br />
citizens (e.g., distribution of<br />
relevant emergency calls) into<br />
its management processes, collecting<br />
a great amount of data<br />
related to its assets. It is not<br />
feasible to exploit all those data<br />
through traditional approaches.<br />
Artificial Intelligence is the only<br />
reasonable way to exploit them.<br />
Machine learning algorithms<br />
integrated in Rheticus Network<br />
Alert will enable to better exploit<br />
historical and real-time data,<br />
thus supporting decision-making<br />
about all relevant aspects of<br />
HERA assets, from demand forecasting<br />
to workforce capacity<br />
management, emergency planning,<br />
predictive maintenance,<br />
optimized scheduling, more<br />
accurate travel times, seasonal<br />
service patterns, and so forth.<br />
Since HERA is in charge of a<br />
wide network covering a broad<br />
area that requires great management<br />
effort, following a proposal<br />
from HERA, Rheticus Network<br />
Alert will be increased with a<br />
specific add-on functionality: the<br />
ingestion of various information<br />
layers to achieve a predictive<br />
operational level alongside the<br />
current support on daily inspection<br />
planning and mid-term<br />
network management.<br />
In 2017, Planetek won the<br />
“EARSC European Earth<br />
Observation Company of the<br />
Year Award”, and recently received<br />
the “<strong>2018</strong> Best Go-to<br />
Market Strategy <strong>2018</strong> Award”<br />
from Hexagon Geospatial,<br />
announced at the HxGN Live<br />
<strong>2018</strong> Conference in Las Vegas –<br />
Nevada.<br />
Rheticus will be showcased<br />
at INTERGEO <strong>2018</strong> (stand:<br />
D.051 Hall: 12.1) in cooperation<br />
with the global network of<br />
Hexagon’s partners. By visiting<br />
https://www.rheticus.eu, it is<br />
possible to read further information<br />
and case histories, or to start<br />
using a Free Trial DEMO.<br />
KEYWORDS<br />
Rheticus; network alert; satellite data; radar;<br />
copernicus sentinels; cloud infrastructures;<br />
ground instabilities<br />
ABSTRACT<br />
Ground movements can cause damage around buried<br />
pipes and infrastructures. Satellite radar technology<br />
can give a good predictive indicator for where<br />
this may be occurring, helping utility companies face<br />
the complex and expensive task of the maintenance<br />
of underground pipelines. Rheticus Network Alert is<br />
a turnkey cloud-based service that processes satellite<br />
imagery and geospatial data automatically to deliver<br />
geo-information services, helping utility companies<br />
in the management of inspections and maintenance<br />
activities over their integrated water and sewerage<br />
networks. Hera Group decided to start using Rheticus<br />
system over the Provinces of Modena and Bologna,<br />
Italy, with the aim of providing an automatic<br />
system to exploit satellite data in order to perform<br />
complex analyses, and simplify inspection planning.<br />
AUTHOR<br />
Vincenzo Massimi<br />
massimi@planetek.it<br />
Pre-Sales Technical Assistant Rheticus<br />
Planetek Italia – https://www.planetek.it<br />
38 <strong>GEOmedia</strong> n°3-<strong>2018</strong>
AEROFOTOTECA<br />
L'AEROFOTOTECA<br />
NAZIONALE RACCONTA…<br />
[Italy’s National Archive of<br />
Aerial Photography]<br />
by Elizabeth J. Shepherd<br />
Fig. 1 – © AFN archives. August 10, 1943. Sicily, Siracusa. German Luftwaffe photo over the Great<br />
Harbour, taken one month after the Allied landing, with analysis of the enemy’s naval forces.<br />
Italian archives of aerial photographs have<br />
rich and varied holdings, which are a valuable<br />
source for the study of the landscape<br />
and of cultural heritage, especially in the<br />
vast parts of the country that have been<br />
affected by significant transformation in<br />
the second half of the 20th century.<br />
These archives are mostly military<br />
(Istituto Geografico Militare www.igmi.<br />
org and the Air Force historical archives<br />
http://www.aeronautica.difesa.it/storia/ufficiostorico/)<br />
with a single exception:<br />
the Aerofototeca Nazionale (AFN)<br />
http://www.iccd.beniculturali.it/index.<br />
php?it/98/aerofototeca-nazionale, the<br />
Italian national archive of aerial photography,<br />
today part of the Ministero<br />
dei Beni e delle Attività Culturali e del<br />
Turismo (Ministry of Cultural Heritage<br />
and Tourism http://www.beniculturali.it).<br />
AFN holds 20th century photographs<br />
over the whole of Italy. It was established<br />
in 1958 as a branch of the Gabinetto<br />
Fotografico Nazionale (National<br />
Photographic Lab & Archive) and, since<br />
1975, has been part of the Istituto Centrale<br />
per il Catalogo e la Documentazione<br />
(ICCD– Central Institute for Catalogue<br />
and Documentation), based in Rome.<br />
AFN houses many collections produced<br />
by public and private organizations. Some<br />
of these have been purchased or donated,<br />
while others are on loan to AFN from<br />
military or civil institutions which retain<br />
ownership. Aerial photographs were<br />
produced by military bodies (Italian Air<br />
Force, Istituto Geografico Militare, Allied<br />
Forces during World War II), public organizations<br />
(research institutes, regional<br />
authorities) and private companies, most<br />
of which are no longer in existence. A few<br />
companies which are still operating have<br />
deposited their historical collections with<br />
the AFN, together with copies of recent<br />
flights, of which they hold the copyright.<br />
AFN also holds unique imagery from<br />
World War II, that are not duplicated<br />
elsewhere, despite the large numbers of<br />
photographs of Italy in UK and USA<br />
archives. These include ‘post-strike’ photographs<br />
taken to help assess the success<br />
of bombing raids. They highlight the potential<br />
importance of this imagery in helping<br />
to write history, recording as they do<br />
events, alongside ongoing processes and<br />
landscapes now<br />
changed in many<br />
ways.<br />
AFN also houses<br />
a large number of<br />
maps drawn from<br />
aerial photographs,<br />
most of them accessed<br />
through the<br />
purchase of the<br />
EIRA collection<br />
(= Ente Italiano<br />
Riprese Aeree)<br />
http://www.iccd.<br />
beniculturali.it/<br />
index.php?it/553/<br />
fondi-cartografici<br />
and also https://<br />
www.flickr.com/<br />
people/aerofototecanazionale-iccd/<br />
. There are also<br />
a number of aerial<br />
cameras, acquired with the Fotocielo<br />
collection, and an exceptional array of<br />
aerial photography-based map-making<br />
equipment, part of the Aerofoto Consult<br />
collection. They all illustrate the history<br />
of aerial-photogrammetry in Italy since<br />
World War II.<br />
The large collection of aerial photographs<br />
of Italy taken for military reconnaissance<br />
purposes by the Allies during<br />
the Italian campaign of 1943–1945 are<br />
of course of extraordinary historical interest.<br />
They were produced by strategic<br />
photo-reconnaissance units of the Royal<br />
Air Force (RAF) and the United States<br />
Army Air Forces (USAAF), part of the<br />
Mediterranean Allied Photographic<br />
Reconnaissance Wing (MAPRW). The<br />
sheer quantity of these photographs (roughly<br />
1 million) and their historical significance<br />
make this the most important collection<br />
of aerial photographs in Italy. This<br />
material includes unique imagery that is<br />
not duplicated in the large holdings of<br />
photographs of Italy held by NARA and<br />
TARA.<br />
Just as large is the historical collection<br />
of the Aeronautica Militare Italiana<br />
(Italian Air Force) deposited in AFN since<br />
its foundation. The initiative of Gen.<br />
Domenico Ludovico was crucial in this<br />
regard, since he arranged for the transfer<br />
to the archive of a large number of military<br />
photographs which included areas<br />
of archaeological interest; the collection<br />
was subsequently enlarged with other<br />
photographs, taken up to the 1970s. As<br />
well as Gen. Ludovico, an important contribution<br />
to the birth of AFN was made<br />
by archaeologist Dinu Adamesteanu, who<br />
was its first director, and Gen. Giulio<br />
Schmiedt of the Istituto Geografico<br />
Militare in Florence.<br />
A photographic analyst of international<br />
Fig. 2 – © AFN archives. Villafranca di Verona, Base Camp of the 3rd<br />
Storm AM, May 1967. Activities of the photographers of an RF84F.<br />
Courtesy Aeronautica Militare, Historical Photo Library.
standing, Gen. Schmiedt spent the whole<br />
of 1960 organizing the AFN photographic<br />
collections into an accessible archive. In<br />
establishing a system that functions to<br />
this day (www.iccd.beniculturali.it/aerofototeca/),<br />
Schmiedt sought to put into<br />
practice the aims of the founders, which<br />
were, in the words of Adamesteanu, to<br />
“gather, coordinate and make available to<br />
the archaeological authorities all the aerial<br />
photographs in our possession that may be<br />
useful in streamlining surveys of the terrain”.<br />
In the sixty years since its creation, the<br />
fundamental task of AFN has been to gather<br />
aerial photographs from all available<br />
sources, provide for their conservation,<br />
cataloguing and study, thus making them<br />
available for a wide range of research and<br />
survey purposes. Over time this has become<br />
an irreplaceable resource for both historical<br />
research in various disciplines and<br />
regional planning, providing fundamental<br />
documentation for many of the activities<br />
of regional organizations in Italy.<br />
WWII aerial photos in AFN<br />
During World War II reconnaissance<br />
flights by RAF and USAAF proved decisive<br />
to the advance and victory of the Allied<br />
Forces; however in southern Italy, immediately<br />
after the Allied landing in Sicily in<br />
July 1943, there were flights by the Regia<br />
Aeronautica (Italian Royal Air Force) and<br />
the German Luftwaffe. These flights are<br />
today a powerful historical record of the<br />
appearance of the country before the great<br />
infrastructural works and urbanization<br />
that, from the early 1950s, have often deeply<br />
altered the Italian agrarian landscape.<br />
Regia Aeronautica<br />
(Italian Royal Air Force)<br />
Since 1923 every Italian army corps had<br />
a group for aerial observation, assigned<br />
aircraft already in use during WW I. In<br />
1943 Guidonia (a military airport near<br />
Rome) was chosen as the base for the<br />
310th Photographic Recognition squadron,<br />
equipped with panoramic cameras<br />
mounted on the Macchi MC 205 aircraft.<br />
German Luftwaffe (LW)<br />
Some of the German photographic reconnaissance<br />
flights were carried out before<br />
the beginning of World War II, and<br />
LW supplied Italy with various kinds of<br />
aircraft, so that after four years the Italian<br />
Air Force stood at 700 aircraft. War time<br />
reconnaissance was carried out over Italy<br />
by both German and Italian crews. AFN<br />
holds in its archives about 100 images in<br />
a 30 × 30cm format, generally taken after<br />
the landing in Sicily and covering various<br />
strategic areas in Southern Italy, such as<br />
Fig. 3 - © AFN archives. May 4, 1944. Pontedera, near Pisa: the Allied bombing of the Piaggio<br />
factory. MAPRW-RAF 683 Photographic Reconnaissance Squadron aerial photo.<br />
harbours and airports. Aerial coverage in<br />
the same format carried out by the Regia<br />
Aeronautica with the same equipment has<br />
also been acquired by AFN.<br />
British Royal Air Force (RAF)<br />
Photographic reconnaissance by the<br />
RAF over Italian territory began as early<br />
as September 1940, covering southern<br />
Italy and Sicily from Malta and went on<br />
until the end of hostilities. This included<br />
the aerial reconnaissance by Adrian<br />
Warburton on 10th November 1940 in<br />
advance of the large-scale attack on the<br />
Italian Fleet the following day – the Night<br />
of Taranto.<br />
The MAPRW-RAF collection was transported<br />
from Puglia to Rome at the end<br />
of World War II and deposited nearly entirely<br />
in the British School at Rome, from<br />
where it was loaned to AFN in 1974.<br />
MAPRW-RAF aerial photographs in the<br />
AFN holdings cover the years 1943–44.<br />
These missions generally maintained<br />
high altitudes (c.27,000 feet) in order to<br />
avoid flak and used a 24-inch focal length<br />
camera (c.1:10,000) and a 6-inch focal<br />
length camera (c.1:50,000), generally<br />
carried by Spitfires and Mosquitoes. The<br />
MAPRW-RAF photographs are identifiable<br />
by the squadron numbers (e.g. 680,<br />
683 and 684) and are mostly of a 7 × 8<br />
inch format. The makeshift airports of<br />
the Tavoliere delle Puglie were used in order<br />
to photograph the effects of the earlier<br />
attacks, and these images focus on those<br />
areas where the British military missions<br />
were directed. They are a unique and irreplaceable<br />
document for the study of a<br />
historical situation of the Italian territory<br />
in a particular moment of its evolution,<br />
before the great urban and agrarian transformations.<br />
The majority of the images taken of southern<br />
Italy and the larger islands from<br />
North Africa appear to have been taken<br />
to Britain after the war, though some of<br />
the 1943 imagery in the AFN will have<br />
been taken by Allied units based in North<br />
Africa.<br />
United States Army Air Force (USAAF)<br />
USAAF started its strategic reconnaissance<br />
in Italy during the spring of 1943<br />
when the Allies began preparing for the<br />
invasion of Sicily, following the Trident<br />
Conference in Washington. This imagery<br />
mostly covers north-east Italy, complementing<br />
MAPRW-RAF coverage which<br />
is concentrated in the south. The USAAF<br />
produced square prints at 9 × 9 inches<br />
with prefi xes in the style of 23PS, 32S,<br />
15SG, 5PRS and 12PRS indicating squadrons.<br />
MAPRW-USAAF photos were donated<br />
by the American Academy in Rome to<br />
the AFN in March 1964, and are arguably<br />
the most important part of the collection<br />
as they fill large gaps in the holdings<br />
of NARA and TARA of photographs taken<br />
after air raids. However, they are not<br />
as accessible as might be desired, as they<br />
are stored in their original boxes making<br />
consultation difficult and conservation an<br />
absolute priority (please note that AFN is<br />
asking for financial contributions in this<br />
regard: http://artbonus.gov.it/1070-fondo-aerofotografico-storico-united-statesarmy-air-force-(usaaf,-1945)-dell’aerofototeca-nazionale-iccd.html).<br />
More on the subject in http://www.<br />
iccd.beniculturali.it/index.php?it/98/<br />
aerofototeca-nazionale and (also in<br />
English) https://beniculturali.academia.<br />
edu/ElizabethJaneShepherd/Aerial-<br />
Photography<br />
KEYWORDS<br />
AFN; Italian archives; aerial photographs; historical<br />
collections; cultural heritage;<br />
AUTORE<br />
Elizabeth J. Shepherd,<br />
elizabethjane.shepherd@beniculturali.it<br />
AFN director<br />
<strong>GEOmedia</strong> n°3-<strong>2018</strong> 41
REPORT<br />
RUNNING UP THAT HILL<br />
Italian civic addresses and<br />
the quest for accuracy<br />
By Valerio Zunino<br />
The quality of toponymy data<br />
has come increasingly under the<br />
microscope in recent years in direct<br />
correlation to the surge in the number<br />
and functional versatility of new<br />
products available to the geographical<br />
information market.<br />
These augmentations infiltrating the<br />
sector require extremely precise<br />
and comprehensive databases, most<br />
crucially in respect of, for example:<br />
the automatic driving project, 118<br />
emergency services, applications<br />
inherent in civil protection, and other<br />
civil service sectors responsible for<br />
urban and environmental intervention.<br />
STUDIO SIT Srl was<br />
conceived of in 1991, the<br />
dim and distant past for<br />
many, when the few precious<br />
and elusive resources available<br />
were employed to ask the most<br />
talented hackers to find us the<br />
formidable MapInfo, the former,<br />
and in all likelihood best<br />
desktop GIS software ever. At<br />
the time a version had just been<br />
released for MS Windows.<br />
Ever since then the company<br />
has co-operated with pertinent<br />
networks and participated in<br />
the development of flagship<br />
products released by the different<br />
market players; initially<br />
concentrating on the world of<br />
Autodesk and then expanding<br />
its focus to include the production<br />
of applications for the<br />
benefit of local authorities and<br />
others dedicated to the territorial<br />
survey activities on civic<br />
addresses (from 1998).<br />
In 2007/8 two aircraft were<br />
acquired in the service of aerial<br />
mapping, both endowed with<br />
autonymous equipment and restitution<br />
software. In 2010 one<br />
of the first small-to-mediumsized<br />
drones available to civilians<br />
was purchased and subsequently<br />
developed - this having<br />
been produced in Germany and<br />
adapted to the photogrammetric<br />
instrumentation already<br />
available.<br />
The same year saw the resumption<br />
of the surveying and<br />
mapping of civic numbers, so as<br />
not to be aban-doned. At that<br />
time the company’s software development<br />
activity concentrated<br />
first on the Environment Map<br />
Server, then QGIS, and finally<br />
the world of ESRI - a culmination<br />
of nearly thirty years of<br />
development and experience.<br />
For suppliers such as HERE<br />
Global Content B.V. and<br />
42 <strong>GEOmedia</strong> n°3-<strong>2018</strong>
REPORT<br />
TOMTOM Global content<br />
B.V. involved with the surveying<br />
and mapping of Italian<br />
civic numbering, the Ligurian<br />
company has been able meet<br />
current requirements for very<br />
high-level accuracy, for the positioning<br />
of points and for the<br />
entirety of national built territory.<br />
These needs derive fundamentally<br />
from two causal factors,<br />
manifested gradually over<br />
the last two decades – the catalyst<br />
being predominantly the<br />
evolution of the toponymy data<br />
market and mobile communications<br />
sector, which has seen<br />
its scope of application expand<br />
from the initial world of car<br />
navigation, fleet management<br />
and market research, into the<br />
Multiutilities (the planning and<br />
management of utilities) i.e.<br />
emergency services, politics and<br />
the electorate. These latter areas<br />
of interest demand the availability<br />
of a complete and precise<br />
geo-referenced civic numbering<br />
database, as well as an enhanced<br />
sense of responsibility towards<br />
its users, who have over the past<br />
few years become much more<br />
sophisticated, finally reaching a<br />
necessary qualitative standard,<br />
inexistent until a few years ago<br />
and therefore not applied to either<br />
supply or demand.<br />
It’s fair to say that the causal<br />
factors that have mobilized the<br />
market in question initially<br />
were the evolution of a product<br />
which is today able to reach<br />
more and more people comprising<br />
a wide range of end-users,<br />
along with the ensuing awareness<br />
of the need to finally have<br />
geographic data that is much<br />
more reliable and complete<br />
than in the past.<br />
In order to maintain a high<br />
level of satisfaction among its<br />
customers, STUDIO SIT has<br />
remained true to the initial<br />
specialities of its own surveying<br />
activities – fieldwork that covers<br />
the entirety of our national<br />
territory - through a network of<br />
professionals that now numbers<br />
almost 50, assembled through<br />
programs of education and<br />
experience pertaining to rigid<br />
selection criteria. A network<br />
consistently looking to cooperate<br />
on integrative interventions<br />
with reference to the dynamic<br />
regulatory framework, in-depth<br />
cartographic data and software<br />
applications used in the context<br />
of digitalizing, editing and autovalidating<br />
operations and data<br />
pretesting.<br />
The resulting qualitative system<br />
exceeds a 95% degree of accuracy,<br />
completeness and high-level<br />
updating, a unique case in our<br />
country.<br />
These three elements already<br />
mentioned combine to apply<br />
the same values to the sphere<br />
of geographical toponymy. The<br />
issue of quality, until a few decades<br />
ago passively suffered by<br />
the end-users that characterized<br />
the demand, cannot be disregarded<br />
and has today assumed<br />
crucial importance, even for the<br />
very survival of some areas of<br />
operation.<br />
Stemming from the three qualitative<br />
factors above, a comprehensive<br />
survey of the whole<br />
municipal territory, accuracy in<br />
the positioning of the numbers<br />
and the degree of updating,<br />
where located and verified,<br />
generates a greater interest on<br />
the part of a wide nucleus of<br />
users, who in the past did not<br />
deem certain geographical information<br />
sufficiently detailed<br />
for their own purposes. Among<br />
those looking to exploit the<br />
mapping of addresses are the<br />
management of multiutilities<br />
(in the context of the maintenance<br />
operations of networks<br />
and utilities, as well as those<br />
involved in administrative management),<br />
professional services<br />
firms, car sharing companies,<br />
large commercial distribution<br />
activities and, furthermore,<br />
some departments responsible<br />
to the Ministries of the<br />
Republic.<br />
Also relevant is the fact that in<br />
Italy there is an increasingly<br />
sharp contrast between the<br />
perceived quality of geographical<br />
toponymy data at central<br />
government level, compared to<br />
that experienced by most sectors<br />
of industry, including multinationals<br />
and the SME world.<br />
This first example, central government,<br />
does not anticipate<br />
a need for geographical data<br />
pertaining to addresses that is<br />
comprehensive and geometrically<br />
precise. While the second<br />
category, industrial players<br />
(including their end-users) of<br />
car navigators and other mobile<br />
mapping application, up to the<br />
most cutting-edge apps employed<br />
by those in creative fields,<br />
insist on yet higher quality in<br />
the form of accuracy, completeness<br />
and maximum updating of<br />
information.<br />
<strong>GEOmedia</strong> n°3-<strong>2018</strong> 43
REPORT<br />
At the forefront are the major<br />
players involved in car navigation<br />
who, along with Google,<br />
currently have a stranglehold<br />
on the market due to a competitive<br />
advantage accumulated in<br />
now well over two decades of<br />
data collecting and acquisition;<br />
these majors being involved<br />
in perpetual competition to<br />
adapt the quality of their data,<br />
augmenting its reliability and<br />
completeness, often to the<br />
point of rebuilding their geographic<br />
databases from scratch.<br />
All this is driven by the demand<br />
from the multiutilities, which<br />
have identified the need to<br />
maintain management services<br />
using GIS, which are based on<br />
the civic addresses in their territories<br />
of interest. At the same<br />
time, some smaller companies<br />
have specialized in the field of<br />
geographical toponymy data,<br />
making their services widely<br />
available through distribution<br />
to a clientele that ranges from<br />
transport and logistics, modern<br />
geomarketing, civil protection<br />
and emergency services. In all<br />
these areas of demand, there<br />
is now a need to have all civic<br />
numbers geo-referenced in the<br />
correct position, given that this<br />
information plays a fundamental<br />
and decisive role, for example,<br />
even the saving of human<br />
lives.<br />
The market's drive towards improving<br />
the quality of the data<br />
is fuelled by two imperatives:<br />
one coming from a product<br />
where each frequent new version<br />
renders the previous version<br />
obsolete, and one from the<br />
demand by increasingly more<br />
discerning users - an awareness<br />
that requires a higher and higher<br />
quality level, composed of<br />
accurate, up-to-date and comprehensive<br />
data to ensure the<br />
development and maintenance<br />
of modern, toponymy-based,<br />
mobility applications.<br />
As regards the availability of<br />
open data, some Italian regions<br />
and large cities offer a good<br />
quality open data service, which<br />
also includes civic numbering.<br />
However, these are rare<br />
exceptions since the process of<br />
surveying and mapping civic<br />
numbering is hampered by the<br />
fact that it has often been based<br />
within some regional procure-<br />
44 <strong>GEOmedia</strong> n°3-<strong>2018</strong>
REPORT<br />
ment procedures awarding these<br />
contracts to construct topographic<br />
databases, which were<br />
containing a preponderance of<br />
cartographic details and a paucity<br />
of requirements for qualitative<br />
mapping components, such<br />
as civic addresses.<br />
These same contracting companies<br />
are traditionally tied to<br />
pure aerial photogrammetry,<br />
with no other corresponding<br />
competencies and therefore<br />
consider/have considered the<br />
logical level of civic numbering<br />
as an accessory, an appendix of<br />
the photogrammetric activity<br />
of restitution and cartographic<br />
dressing.<br />
This situation allows companies<br />
to interpret this meagre<br />
specification to their advantage,<br />
detailing just the position of the<br />
existing:<br />
- without the insertion of the<br />
corresponding toponym;<br />
- without the inclusion of buildings<br />
which were displaying no<br />
number.<br />
Unfortunately it is also necessary<br />
to take into account the fact<br />
that often the contracting companies<br />
produce georeferenced<br />
house numbers according to<br />
mere mathematical algorithms<br />
(or Google Street View...), in<br />
which numbers are distributed<br />
in an unreal, uniform way,<br />
adhering to the vagaries of the<br />
road network which is in itself<br />
already inaccurate in terms of<br />
length and route.<br />
All this inevitably leads to an<br />
average quality reduction of<br />
around 65% of the value of the<br />
geographical civic toponymy<br />
data. As a consequence, italian<br />
toponymy open data, is largely<br />
unusable on many of today's<br />
most widespread applications,<br />
whose procedures require data<br />
capable of withstanding a level<br />
of use almost unimaginable until<br />
a few years ago.<br />
As of today (30/06/<strong>2018</strong>), considering<br />
a total of 19.5 million<br />
civic numbers, STUDIO SIT<br />
srl has comprehensively mapped<br />
territory equal to 12 million of<br />
them (whose place names are<br />
taken from official municipal<br />
routes). This coverage comprises<br />
5000 municipalities with<br />
their approximately 42 million<br />
inhabitants. The average update<br />
of data refers to the year 2016.<br />
Among provincial capitals the<br />
coverage is 98%, that of the<br />
130 most populous cities is close<br />
to 96%, and that of municipalities<br />
with more than 40,000<br />
inhabitants is now 89%. By<br />
2020 we predict that we will<br />
reach 16 million civic numbers<br />
contained within 6900 municipalities.<br />
We're still running up<br />
that hill !<br />
KEYWORDS<br />
GIS; map; localization; civic address; italian<br />
toponymy data; georeferenced; multiutilities<br />
ABSTRACT<br />
The quality of toponymy data has come increasingly<br />
under the microscope in recent years. These<br />
augmentations infiltrating the sector now require<br />
extremely accurate, up-to-date and comprehensive<br />
data, most crucially in respect of, for example,<br />
the automatic driving project, emergency services,<br />
and applications inherent in civil protection.<br />
STUDIO SIT Srl was conceived of in 1991, the<br />
dim and distant past for many. For suppliers such<br />
as HERE and TOMTOM involved with the surveying<br />
and mapping of Italian civic numbering,<br />
the Ligurian company has been able to exceed a<br />
95% degree of accuracy, completeness and updating,<br />
unique in this country, which traditionally<br />
lacks the availability of good quality toponymy<br />
opendata.<br />
AUTHOR<br />
Valerio Zunino<br />
Valerio.zunino@studiosit.it<br />
STUDIOSIT srl<br />
Droni Idrografici polivalenti<br />
• Rilievi batimetrici automatizzati<br />
• Acquisizione dati e immagini<br />
• Mappatura parametri ambientali<br />
• Ispezione fondali<br />
Dighe, laghi, cave in falda, bacini, fiumi e<br />
canali fino a 15 4 m/s. Km/h. Insensibili ai bassi ai bassi<br />
fondali e alla presenza di alghe e detriti<br />
Vendita - Noleggio - Servizi chiavi in mano,<br />
anche con strumentazione cliente<br />
<strong>GEOmedia</strong> n°3-<strong>2018</strong> 45
AGENDA<br />
3-5 ottobre <strong>2018</strong><br />
TechnologyforAll <strong>2018</strong><br />
Roma (Italy)<br />
www.geoforall.it/ku3y8<br />
15-18 ottobre <strong>2018</strong><br />
Year in Infrastructure <strong>2018</strong><br />
London (UK)<br />
www.geoforall.it/ku3yu<br />
16 - 18 ottobre <strong>2018</strong><br />
INTERGEO <strong>2018</strong><br />
Frankfurt (Germany)<br />
www.geoforall.it/kwux9<br />
8 - 9 novembre <strong>2018</strong><br />
Conferenze di Geotecnica di<br />
Torino <strong>2018</strong><br />
Torino (Italy)<br />
www.geoforall.it/kuhk4<br />
27-29 novembre <strong>2018</strong><br />
XXII Conferenza Nazionale<br />
ASITA<br />
Bolzano (Italy)<br />
www.geoforall.it/ku69r<br />
16 - 19 gennaio 2019<br />
TUSE The Unmanned System<br />
Expo<br />
Rotterdam (The Netherlands)<br />
https://tusexpo.com<br />
20 - 22 Febbraio<br />
FOSS4G-IT 2019<br />
Padova (Italy)<br />
www.geoforall.it/kur83<br />
2 - 4 aprile 2019<br />
Amsterdam (The Netherlands)<br />
Geospatial World Forum<br />
www.geoforall.it/kuqk8<br />
Teorema has been working<br />
alongside professionists proving<br />
the most innovative topographic<br />
technology, the best technical<br />
training and accurate after-sales<br />
assistance since 1986,<br />
in order to make your work more<br />
reliable and productive.<br />
leica BlK360°<br />
The imaging laser scanner simplifies<br />
the way spaces are measured, designed<br />
and documented .<br />
New dimension in measurements technology<br />
❚❚Leica BLK360° captures the world around you with full-colour panoramic images overlaid on a<br />
high-accuracy point cloud.<br />
❚❚Simple to use with just the single push of one button, the BLK360 is the smallest and lightest of its kind.<br />
❚❚Anyone who can operate an iPad can now capture the world around them with high resolution 3D<br />
panoramic images.<br />
❚❚Using the ReCap Pro mobile app, the BLK360° streams image and point cloud data to iPad. The app<br />
filters and registers scan data in real time.<br />
❚❚After capture, ReCap Pro enables point cloud data transfer to a number of CAD, BIM, VR and AR<br />
applications.<br />
❚❚Teorema Milano can offer you a solution “all-inclusive” that includes: BLK360° with software ReCap<br />
Pro, Ipad Pro 12,9”, training courses with specialist.<br />
Contact us, you will discover much more.<br />
www.geomatica.it • www.disto.it • www.termocamere.com<br />
Via A. Romilli, 20/8 20139 Milano Italy • Tel. +39 02 5398739 • teorema@geomatica.it
GLOBAL HUB OF THE<br />
GEOSPATIAL COMMUNITY<br />
FRANKFURT <strong>2018</strong><br />
16 – 18 OCTOBER<br />
DIGITALIZATION<br />
BIM<br />
INTERAERIAL<br />
SOLUTIONS<br />
SMART CITIES<br />
REGISTER<br />
NOW!<br />
Host: DVW e.V.<br />
Conference organiser: DVW GmbH<br />
Trade fair organiser: HINTE GmbH<br />
SPONSORS:<br />
WWW.INTERGEO.DE
The Intersection of<br />
Infrastructure<br />
and Technology<br />
Quantum leaps in communication and measuring technologies are transforming the way<br />
infrastructure is built. By creating solutions that embrace these advancements, we work to help you<br />
stay ahead of the developments today and tomorrow.<br />
Our integration of high-accuracy positioning, high-speed imaging, cloud-based information<br />
management and down-to-earth simplicity creates higher productivity, enhanced quality and<br />
improved sustainability.<br />
Drive your business with technology, go to: topconpositioning.com/INFRASTRUCTURE<br />
The Intersection of<br />
Infrastructure and Technology