GEOmedia_3_2023
EUMAP During the recent pandemic period, the world's attention has shifted towards the healthcare sector, with world leaders striving to avoid the collapse of their national healthcare systems; the economy has entered an artificial coma, while utility systems, including energy, water, telecommunications and waste management systems, have been asked to act immediately in response to these unprecedented conditions, placing extreme pressure on public utility systems.
EUMAP
During the recent pandemic period, the world's attention has shifted towards the healthcare sector, with world leaders striving to avoid the collapse of their national healthcare systems; the economy has entered an artificial coma, while utility systems, including energy, water, telecommunications and waste management systems, have been asked to act immediately in response to these unprecedented conditions, placing extreme pressure on public utility systems.

Create successful ePaper yourself
Turn your PDF publications into a flip-book with our unique Google optimized e-Paper software.
Rivista bimestrale - anno XXVII - Numero - 3/<strong>2023</strong> - Sped. in abb. postale 70% - Filiale di Roma<br />
LAND CARTOGRAPHY<br />
GIS<br />
CADASTRE<br />
GEOGRAPHIC INFORMATION<br />
PHOTOGRAMMETRY<br />
3D<br />
SURVEY TOPOGRAPHY<br />
CAD<br />
BIM<br />
EARTH OBSERVATION SPACE<br />
WEBGIS<br />
UAV<br />
URBAN PLANNING<br />
CONSTRUCTION<br />
LBS<br />
SMART CITY<br />
GNSS<br />
ENVIRONMENT<br />
NETWORKS<br />
LiDAR<br />
CULTURAL HERITAGE<br />
May/June <strong>2023</strong> year XXVII N°3<br />
Development of a<br />
Utilities Management<br />
Platform for the case<br />
of Quarantine and<br />
Lockdown – eUMaP<br />
GEOMATIC TECHNIQUES FOR<br />
UTILITIES CONSUMPTION<br />
JAMMING AGAINST<br />
GNSS RECEIVERS<br />
DRONES POWERED BY<br />
GALILEO OSNMA SERVICE
DWG
Geomatics and pandemic<br />
During the recent pandemic period, the world's attention has shifted towards the healthcare sector,<br />
with world leaders striving to avoid the collapse of their national healthcare systems; the economy<br />
has entered an artificial coma, while utility systems, including energy, water, telecommunications and<br />
waste management systems, have been asked to act immediately in response to these unprecedented<br />
conditions, placing extreme pressure on public utility systems.<br />
During crisis situations, it was also observed that in a very short period of time, most of the activity<br />
of the European economy shifted from industry and offices to homes via teleworking. In this<br />
context, the residential construction of a city that can be considered smart in the management and<br />
provision of public services, involves the creation of a stable and reliable network of sensors and<br />
actuators in homes.<br />
This highlights the significant role that smart buildings can play in cases of force majeure, where<br />
quarantine and lockdown conditions are required. Building Information Modeling (BIM) technology<br />
and digital twins are pioneering the way smart buildings are operated and will significantly<br />
contribute to the work of smart building applications. BIM provides an interactive environment<br />
where synergies between different skills, information and data can be combined, with real-time<br />
online management based on Digital Twin using BIM with enormous resource saving potential for<br />
the built environment.<br />
Although the capabilities of geomatic techniques together with BIM offer many opportunities for the<br />
efficient management of energy, water, waste and telecommunications networks, there are challenges<br />
to be addressed before these opportunities could be actually realised.<br />
The editorial contributions in this issue of <strong>GEOmedia</strong> fall in this context. Some were developed<br />
during the implementation of a project dedicated to the development of a utilities management<br />
platform for the case of quarantine and lockdown, eUMaP, within the EU MSCA RISE H2020<br />
framework, the exchange program of research and innovation personnel of the European<br />
Community. eUMaP is actually studying an open platform through which local authorities<br />
will be able to plan and manage the demand and supply of services in buildings in the event of<br />
quarantine or health emergency or lock down, including energy, water and waste networks and<br />
telecommunications. Through a partnership between universities, research institutes and companies<br />
involved in these fields of investigation, some appropriate analysis tools have been further studied<br />
and developed.<br />
Geomatic techniques are the basis of the findings produced by some of these studies, highlighting the<br />
important relationships that should be established in the analysis of any territorial situation.<br />
Enjoy your reading,<br />
Renzo Carlucci
In this<br />
issue...<br />
FOCUS<br />
REPORT<br />
COLUMNS<br />
42 MERCATO<br />
36 SPACE<br />
46 AGENDA<br />
FOCUS<br />
Quantifying how<br />
a zone is residential<br />
A Multi-Criteria<br />
Decision Making<br />
approach<br />
by Simone Guarino, Camilla<br />
Fioravanti, Gabriele Oliva,<br />
Roberto Setola, Giovanni De<br />
Angelis, Marcello Coradini<br />
6<br />
12<br />
Spatial, functional<br />
and temporal analysis<br />
of Wi-Fi hotspots during<br />
covid-19 curfew<br />
In selected EU cities<br />
Rome, Thessaloniki,<br />
Nicosia, Kaunas<br />
by Marius Ivaškevičius<br />
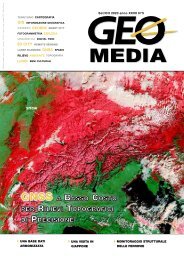
On the cover a map derived from<br />
Copernicus EMS Rapid Mapping<br />
Center that shows the situation<br />
in the area of Rome Center at the<br />
date of 20/07/2020 during the<br />
emergency for Covid-19. The<br />
thematic layer has been derived<br />
from post-event satellite image<br />
by means of visual interpretation.<br />
Map produced by e-GEOS<br />
released by e-GEOS (ODO). ©<br />
European Union<br />
For full Copyright notice visit<br />
https://emergency.copernicus.eu/<br />
mapping/ems/cite-copernicusems-mapping-portal<br />
16<br />
Geomatic techniques<br />
for utilities<br />
consumption analysis<br />
in urban areas during<br />
emergency periods<br />
by Sara Zollini, Maria<br />
Alicandro, Donatella<br />
Dominici<br />
4 <strong>GEOmedia</strong> n°3-<strong>2023</strong><br />
<strong>GEOmedia</strong>, published bi-monthly, is the Italian magazine for<br />
geomatics. Since more than 20 years publishing to open a<br />
worldwide window to the Italian market and vice versa.<br />
Themes are on latest news, developments and applications in<br />
the complex field of earth surface sciences.<br />
<strong>GEOmedia</strong> faces with all activities relating to the acquisition,<br />
processing, querying, analysis, presentation, dissemination,<br />
management and use of geo-data and geo-information. The<br />
magazine covers subjects such as surveying, environment,<br />
mapping, GNSS systems, GIS, Earth Observation, Geospatial<br />
Data, BIM, UAV and 3D technologies.
ADV<br />
22<br />
PASSport: a sample<br />
of heterogeneous<br />
fleet of drones<br />
powered by Galileo<br />
OSNMA service<br />
by M. Nisi, M. Lopez<br />
Codevintec 48<br />
Epsilon 45<br />
Esri 20<br />
GISTAM 43<br />
Gter 34<br />
Planetek 21<br />
SmartGEOExpo 35<br />
Stonex 47<br />
Strumenti Topografici 2<br />
TechnologyForAll 11<br />
Teorema 46<br />
Windows opening in<br />
naturally ventilated<br />
classrooms:<br />
management<br />
strategies to balance<br />
energy use and<br />
reduction of risk<br />
infection transmission<br />
By Giulia Lamberti,<br />
Giacomo Salvadori<br />
26<br />
On background image, Copernicus<br />
Sentinel-2 image<br />
highlights the colours of<br />
autumn over the southern<br />
part of New York state in<br />
the US.<br />
Credit: European Union,<br />
Copernicus Sentinel-2<br />
imagery<br />
30<br />
Building Energy<br />
resilience: the role<br />
of energy management<br />
systems, smart devices<br />
and optimal energy<br />
control techniques<br />
By G.Chantzis,<br />
A.M.Papadopoulos<br />
published by<br />
Science & Technology Communication<br />
Chief Editor<br />
RENZO CARLUCCI, direttore@rivistageomedia.it<br />
Science & Technology Communication<br />
Editorial Board<br />
Vyron Antoniou, Fabrizio Bernardini, Caterina Balletti,<br />
Roberto Capua, Mattia Crespi, Fabio Crosilla, Donatella<br />
Dominici, Michele Fasolo, Marco Lisi, Flavio<br />
Lupia, Luigi Mundula, Beniamino Murgante, Aldo Riggio,<br />
Monica Sebillo, Attilio Selvini, Donato Tufillaro<br />
Managing Director<br />
FULVIO BERNARDINI, fbernardini@rivistageomedia.it<br />
Editorial Staff<br />
Gabriele Bagnulo, Valerio Carlucci, Massimo Morigi<br />
Gianluca Pititto, Maria Chiara Spiezia<br />
redazione@rivistageomedia.it<br />
Marketing Assistant<br />
TATIANA IASILLO, t.iasillo@mediageo.it<br />
Design<br />
DANIELE CARLUCCI, dcarlucci@rivistageomedia.it<br />
Editor<br />
MediaGEO soc. coop.<br />
Via Palestro, 95 00185 Roma<br />
Tel. 06.64871209 - Fax. 06.62209510<br />
info@rivistageomedia.it<br />
Printed by Bona Digital Print Srl<br />
Paid subscriptions<br />
<strong>GEOmedia</strong> is available bi-monthly on a subscription basis.<br />
The annual subscription rate is € 45. It is possible to subscribe at any time via<br />
https://geo4all.it/abbonamento. The cost of one issue is € 9 €, for the previous<br />
issue the cost is € 12 €. Prices and conditions may be subject to change.<br />
Issue closed on: 08/09/<strong>2023</strong>
FOCUS<br />
Quantifying how a zone is residential<br />
A Multi-Criteria Decision Making approach<br />
by Simone Guarino, Camilla Fioravanti, Gabriele Oliva, Roberto Setola, Giovanni De Angelis, Marcello Coradini<br />
The COVID-19 pandemic<br />
has greatly impacted<br />
education, work dynamics,<br />
and social interactions.<br />
Allocating building<br />
utilities effectively during<br />
lockdowns is a challenge.<br />
Strategic resource<br />
allocation prioritizes<br />
residential areas over<br />
commercial ones based<br />
on population density.<br />
Accurately delineating<br />
residential zones is<br />
difficult due to complex<br />
urban landscapes.<br />
Fig. 1 - Example of a pictorial questionnaire filled by an expert.<br />
This paper discusses<br />
an indicator that uses<br />
open-source intelligence<br />
and a decision-making<br />
framework to assess the<br />
likelihood of an area being<br />
residential. The indicator<br />
optimizes resource<br />
allocation for power, gas,<br />
and water distribution.<br />
A case study in Nicosia,<br />
Cyprus, demonstrates its<br />
effectiveness.<br />
Assessing the residential<br />
nature of an area in<br />
complex urban landscapes,<br />
especially in major cities,<br />
is challenging. However,<br />
quantifying residential likelihood<br />
would be valuable during<br />
crises or resource scarcity<br />
(Carlucci et al., 2021). For instance,<br />
in strict pandemic lockdowns<br />
or energy disruption<br />
scenarios, identifying residential<br />
areas becomes crucial for<br />
effective resource distribution<br />
and rationing policies.<br />
This article reviews the work<br />
undertaken by NITEL and S3<br />
within the EUMAP project<br />
(Oliva et al., 2021). In particular,<br />
the undertaken activities<br />
were aimed to develop a<br />
comprehensive indicator using<br />
open-source intelligence to assess<br />
residential likelihood.<br />
Notably, if satellite information<br />
is directly used and integrated<br />
for this purpose, managing<br />
and optimizing the connection<br />
and data transfer aspects is<br />
highly beneficial (Belli et al.,<br />
2009, Abdelsalam et al., 2017,<br />
Abdelsalam et al., 2019).<br />
In this paper we consider a<br />
complementary approach and,<br />
specifically, we rely on Open-<br />
StreetMap data (OpenStreet-<br />
Map) obtained through Over-<br />
Pass APIs (Olbricht,2015) to<br />
identify indirect indicators like<br />
road network density, pres-<br />
6 <strong>GEOmedia</strong> n°3-<strong>2023</strong>
FOCUS<br />
ence of shops, entertainment<br />
venues, places of worship, and<br />
financial facilities. Human<br />
decision-makers contributed<br />
their expertise to determine the<br />
indicators’ relative importance,<br />
which we distill using the Incomplete<br />
Analytic Hierarchy<br />
Process technique (Bozóki et<br />
al. 2010, Oliva et al., 2017,<br />
Bozóki and Tsyganok, 2019,<br />
Oliva et al., 2019). These absolute<br />
utility values form the<br />
basis of a weighted sum, creating<br />
a holistic index for each<br />
zone.<br />
Multi-Criteria Decision<br />
Model for Residential Area<br />
ùAssessment<br />
In this section, we discuss the<br />
proposed Multi-Criteria Decision<br />
Model, including the<br />
metrics considered along with<br />
their weights derived from<br />
interactions with decisionmakers.<br />
The metrics serve<br />
as indirect measures of residential<br />
likelihood and are obtained<br />
from public information<br />
sourced from OpenStreetMap<br />
via the Overpass APIs.<br />
Let us consider a specific location<br />
j, defined by latitude latj<br />
and longitude lonj. We also<br />
define an “area of interest”<br />
surrounding the location, represented<br />
by the set of points h<br />
where lath ∈ [latj − ∆lat, latj +<br />
∆lat] and lonh ∈ [lonj −∆lon,<br />
lonj + ∆lon]. For this study,<br />
we consider ∆lat and ∆lon<br />
values corresponding to a one<br />
square kilometer bounding box<br />
centered on the location. The<br />
residential nature of an area<br />
in complex urban landscapes,<br />
especially in major cities, is<br />
challenging. However, quantifying<br />
residential likelihood<br />
would be valuable during<br />
crises or resource scarcity<br />
(Carlucci et al., 2021). For instance,<br />
in strict pandemic lockdowns<br />
or energy disruption<br />
scenarios, identifying residential<br />
areas becomes crucial for<br />
effective resource distribution<br />
and rationing policies. In the<br />
following, we list the indicators<br />
we considered as indirect<br />
measures of residential likelihood:<br />
1.Road Ramification: Number<br />
of nodes in the area of<br />
interest, representing the<br />
road network’s density (e.g.,<br />
highways have fewer nodes,<br />
while densely populated<br />
neighbourhoods have multiple<br />
nodes).<br />
2. Road Intersections: Number<br />
of nodes in the area of interest<br />
that correspond to road<br />
intersections (nodes with a<br />
degree greater than two).<br />
3. Road Coverage: Total road<br />
length in the area of interest<br />
(highways generally have<br />
a single main road, while<br />
densely populated areas<br />
have multiple intersections).<br />
4. Food: Total count of foodrelated<br />
shops (e.g., supermarkets,<br />
groceries, restaurants)<br />
in the area of interest.<br />
5. Financial: Total count of<br />
finance-related facilities<br />
(e.g., ATMs, banks, currency<br />
exchange) in the area of interest.<br />
6. Education: Total count of<br />
education-related facilities<br />
(e.g., colleges, driving<br />
schools, kindergartens) in<br />
the area of interest.<br />
7. Healthcare: Total count of<br />
healthcare-related facilities<br />
(e.g., hospitals, clinics, dentists)<br />
in the area of interest.<br />
8. Entertainment: Total count<br />
of entertainment-related facilities<br />
(e.g., art centres, cinemas,<br />
theatres) in the area of<br />
interest.<br />
9. Public Service: Total count<br />
of public service facilities<br />
(e.g., courthouses, fire stations,<br />
post offices) in the<br />
area of interest.<br />
10.Worship: Total count of<br />
worship facilities (e.g.,<br />
churches, mosques, synagogues)<br />
in the area of interest.<br />
11.Transportation: Total count<br />
of transportation-related facilities<br />
(e.g., bus stops, parking<br />
lots, taxis) in the area of<br />
interest.<br />
12.Shops (excluding Food):<br />
Total count of shops, excluding<br />
food-related establishments<br />
(e.g., clothing stores,<br />
hardware stores, stationery<br />
shops) in the area of interest.<br />
Calculating the weights<br />
We now discuss the computation<br />
of the metrics weights wi,<br />
which are essential for the holistic<br />
indicator used to assess<br />
the residential likelihood of a<br />
zone. Six decision-makers, including<br />
industry and academia<br />
experts with critical infrastructure<br />
analysis and management<br />
experience, were interviewed.<br />
To collect their opinions, a<br />
pictorial questionnaire was<br />
presented (see Figure 1),<br />
where experts indicated their<br />
preferences by drawing arrows<br />
and associating symbols from<br />
Saaty’s scale (Saaty, 1990).<br />
The symbols were translated<br />
into numerical values according<br />
to Saaty’s scale (Table 1).<br />
The experts compared pairs<br />
of alternatives based on their<br />
comfort level, resulting in a<br />
disconnected graph in some<br />
cases. However, by combining<br />
the opinions of multiple<br />
decision-makers, a connected<br />
graph and proper ranking<br />
were obtained. Table 2 shows<br />
the weights wi associated<br />
with each metric which were<br />
computed using the Logarithmic<br />
Least Squares approach<br />
to solve the Incomplete<br />
Analytic Hierarchy Process<br />
problem, e.g., see (Oliva et<br />
<strong>GEOmedia</strong> n°3-<strong>2023</strong> 7
FOCUS<br />
Referring to wi > 0 as the<br />
weight associated with the i-th<br />
criterion and cij as the value<br />
assumed by the j-th residential<br />
zone according to the i-th<br />
criterion (possibly normalized<br />
between zero and one), the<br />
holistic score for the j-th residential<br />
zone is given by:<br />
Fig. 2 - Code snippet of the proposed MATLABTM implementation.<br />
al., 2019). The total number<br />
of transportation-related facilities<br />
is considered the most<br />
important factor, contributing<br />
approximately 14.19% to the<br />
holistic metric. Conversely,<br />
the number of worship places<br />
is deemed the least important,<br />
contributing approximately<br />
1.78% to the holistic metric.<br />
Fig. 3 - Graphical user interface.<br />
Assessing the likelihood that<br />
a zone is residential<br />
Consider a set of k alternatives,<br />
such as zones to be<br />
ranked based on their likelihood<br />
of being residential.<br />
Each zone is associated with<br />
n metrics or indicators that<br />
describe its importance according<br />
to a specific criterion.<br />
Note that the scores cij are<br />
normalized in the interval<br />
[0,1] since the different metrics<br />
may have varying scales.<br />
Specifically, for each criterion<br />
h, we normalize the raw values<br />
craw using the min-max<br />
normalization technique (Patro<br />
and Sahu, 2015), a popular<br />
approach for normalizing features<br />
in machine learning applications.<br />
Implementation<br />
OpenStreetMap (OSM) is<br />
an open-source editable map<br />
database that provides geospatial<br />
information. The data<br />
is organized in features represented<br />
by tags, allowing users<br />
to access various physical<br />
elements such as buildings,<br />
forests, and more. The data<br />
can be retrieved through the<br />
OpenStreetMap Overpass API,<br />
which serves custom-selected<br />
parts of the map data. In this<br />
paper, MATLAB is used to<br />
implement a function that requests<br />
geo-referenced data for<br />
a specified geographical area<br />
using a bounding box.<br />
The provided MATLAB<br />
language code snippet (Figure<br />
2) demonstrates how the function<br />
retrieves the requested<br />
data and parses it into a Struct<br />
data type. The features are<br />
obtained based on predefined<br />
tags, such as clinics, theaters,<br />
8 <strong>GEOmedia</strong> n°3-<strong>2023</strong>
FOCUS<br />
and restaurants, and the function<br />
returns the count of occurrences<br />
for each feature. Additionally,<br />
the code mentions<br />
that by selecting specific types<br />
like nodes and ways, it is possible<br />
to reconstruct the road<br />
network topology. Attributes<br />
like length can be obtained for<br />
each way, and the graph representation<br />
allows the identification<br />
of actual traffic intersections<br />
by selecting nodes with a<br />
degree greater than two.<br />
Figure 3 shows the graphical<br />
user interface developed in<br />
order to support the user in the<br />
selection of the locations to be<br />
evaluated and compared. Specifically,<br />
the interface is developed<br />
in MATLAB, using<br />
the App Designer interactive<br />
development environment.<br />
Case Study<br />
The effectiveness of the proposed<br />
framework is demonstrated<br />
through a case study<br />
in Nicosia, Cyprus. Five<br />
locations are considered, visually<br />
represented as stars on a<br />
satellite image (Figure 4). The<br />
latitude, longitude, and raw<br />
scores craw for the 12 metrics<br />
are provided in Table 3.<br />
The normalization results are<br />
shown in Table 4. The holistic<br />
indicator, obtained from the<br />
multi-criteria decision model,<br />
is presented in Table 5 for the<br />
five locations.<br />
Based on the proposed holistic<br />
index, Location #4 is identified<br />
as the most important,<br />
while Location #3 is deemed<br />
the least important. These<br />
findings align with expectations,<br />
as Location #4 corresponds<br />
to the city center, while<br />
Location #3 is situated near a<br />
highway in the Strovolos area.<br />
Notably, Location #1, despite<br />
its proximity to the city center,<br />
receives lower scores compared<br />
to Location #2 (also in<br />
a central zone) in categories<br />
such as Food, Healthcare,<br />
Transportation, and Shops due<br />
to its adjacency to the Alsos<br />
Forest. Furthermore, Location<br />
#5, situated in an area with<br />
ministries and offices, exhibits<br />
a relatively low holistic indicator<br />
value.<br />
Overall, the case study indicates<br />
that the proposed holistic<br />
index is effective in distinguishing<br />
between densely and<br />
sparsely populated zones.<br />
Conclusions<br />
This article discusses a holistic<br />
indicator for quantifying<br />
Tab. 2 - Table summarizing the weights<br />
wi associated with the 12 different metrics.<br />
the residential likelihood of<br />
a zone, utilizing open-source<br />
intelligence and multi-criteria<br />
decision-making. The effectiveness<br />
of this approach is<br />
demonstrated through a case<br />
study conducted in Nicosia,<br />
Cyprus. The proposed index<br />
serves as a foundation for optimizing<br />
resource distribution,<br />
such as power, gas, or water.<br />
Tab. 3 Table summarizing the latitude, longitude and raw scores craw of the five<br />
considered locations. (source (Oliva et al., 2022)).<br />
Tab. 1 - Saaty’s ratio scale (Saaty, 1990).<br />
Fig. 4 - Satellite map of the city of Nicosia, Cyprus, showing the five considered<br />
locations as magenta stars (source (Oliva et al., 2022).<br />
<strong>GEOmedia</strong> n°3-<strong>2023</strong> 9
FOCUS<br />
Future work aims to enhance<br />
the model by incorporating additional<br />
features, such as road<br />
types (one-way or two-way),<br />
and exploring other types of<br />
infrastructures, including telecommunications<br />
base stations<br />
and electrical power cabins<br />
within a zone. Additionally,<br />
the possibility of assessing<br />
the residential likelihood for<br />
zones of varying sizes will be<br />
explored, along with investigating<br />
automatic parameter<br />
tuning based on specific city<br />
characteristics.<br />
Tab. 4 - Table summarizing the normalized scores cij of the five considered locations<br />
according to the 12 different considered metrics (source (Oliva et al., 2022)).<br />
Tab. 5 - Holistic index obtained for the five considered locations as a result of the<br />
proposed Multi-Criteria Decision Model (source (Oliva et al., 2022)).<br />
REFERENCES<br />
A. Abdelsalam, M. Luglio, C. Roseti and F.<br />
Zampognaro (2017) TCP connection management<br />
through combined use of terrestrial<br />
and satellite IP-based links, 40th International<br />
Conference on Telecommunications and<br />
Signal Processing (TSP), Barcelona, Spain,<br />
July 5-7,<br />
A. Abdelsalam, M. Luglio, C. Roseti, F.<br />
Zampognaro (2019) Analysis of bandwidth<br />
aggregation techniques for combined use of<br />
satellite and xDSL broadband links, International<br />
Journal of Satellite Communications<br />
& Networking, Volume 37, Issue 2, 1 March<br />
2019.<br />
F. Belli, M. Luglio, C. Roseti and F. Zampognaro<br />
(2019) An Emulation Platform for<br />
IP-based Satellite Networks, in proceedings<br />
of 27th AIAA International Communications<br />
Satellite Systems Conference ICSSC<br />
2009, June 1-4 2009.<br />
Bozóki, S., Fülöp, J. and Rónyai, L. (2010)<br />
On optimal completion of incomplete pairwise<br />
comparison matrices. Mathematical and<br />
Computer Modelling 52(1-2), 318–333<br />
Bozóki, S., Tsyganok, V. (2019) The (logarithmic)<br />
least squares optimality of the<br />
arith- metic (geometric) mean of weight<br />
vectors calculated from all spanning trees for<br />
incomplete additive (multiplicative) pairwise<br />
comparison matrices. International Journal<br />
of General Systems 48(4), 362–381<br />
Carlucci, R., Di Iorio, A., Fokaides, P., Ioannou,<br />
A., Luglio, M., Quadrini, M., Roseti,<br />
C., Zampognaro, F. (2021) Architecture<br />
definition for a multi-utility management<br />
platform. In: 2021 International Symposium<br />
on Networks, Computers and Communications<br />
(ISNCC). pp. 1–6. IEEE<br />
Olbricht, R.M. (2015) Data retrieval for<br />
small spatial regions in OpenStreetMap. In:<br />
OpenStreetMap in GIScience, pp. 101–122.<br />
Springer<br />
Oliva, G., Setola, R., Scala, A. (2017) Sparse<br />
and distributed analytic hierarchy process.<br />
Automatica 85, 211–220<br />
Oliva, G., Scala, A., Setola, R., Dell’Olmo, P.<br />
(2019) Opinion-based optimal group formation.<br />
Omega 89, 164–176<br />
Oliva, G and Guarino, S and Setola, R and<br />
De Angelis, G and Coradini, M (2022)<br />
“Identifying Residential Areas Based on<br />
Open Source Data: A Multi-Criteria Holistic<br />
Indicator to Optimize Resource Allocation<br />
During a Pandemic”, International Conference<br />
on Critical Information Infrastructures<br />
Security, pp. 180–194<br />
OpenStreetMap https://www.openstreetmap.org<br />
Patro, S., Sahu, K.K. (2015) Normalization:<br />
A preprocessing stage. arXiv preprint<br />
arXiv:1503.06462<br />
Saaty, T.L.: How to make a decision: the analytic<br />
hierarchy process. European journal of<br />
operational research 48(1).<br />
KEYWORDS<br />
COVID-19; Resource Allocation; Residential<br />
Area Identification; Multi-<br />
Criteria Decision-Making; · Incomplete<br />
Analytic Hierarchy Process<br />
ABSTRACT<br />
The COVID-19 pandemic has had an<br />
unprecedented impact on various aspects<br />
of our lives, including education, work<br />
dynamics, and social interactions. Dealing<br />
with the provision of building utilities<br />
in such circumstances has become a formidable<br />
challenge. During lockdowns, it<br />
becomes crucial to allocate resources strategically,<br />
giving priority to residential areas<br />
over commercial and financial districts<br />
based on population density. Identifying<br />
residential areas is of utmost importance<br />
not only for effective emergency response<br />
during natural disasters but also for ensuring<br />
fair distribution of electricity and<br />
gas when resources are scarce. However,<br />
accurately delineating residential zones is<br />
challenging due to the intricate nature of<br />
urban landscapes.<br />
This paper aims to discuss a comprehensive<br />
indicator that utilizes open-source intelligence<br />
and incorporates a multi-criteria<br />
decision-making framework to assess the<br />
likelihood of an area being residential.<br />
This indicator will greatly assist in optimizing<br />
resource allocation for power, gas,<br />
and water distribution. To demonstrate<br />
the effectiveness of the proposed approach,<br />
a case study conducted in Nicosia, Cyprus,<br />
is presented.<br />
AUTHOR<br />
Simone Guarino<br />
s.guarino@unicampus.it<br />
Università Campus<br />
Bio-Medico di Roma<br />
Camilla Fioravanti<br />
c.fioravanti@unicampus.it<br />
Università Campus<br />
Bio-Medico di Roma<br />
Gabriele Oliva<br />
g.oliva@unicampus.it<br />
Università Campus<br />
Bio-Medico di Roma<br />
Roberto Setola<br />
r.setola@unicampus.it<br />
Università Campus<br />
Bio-Medico di Roma<br />
Giovanni De Angelis<br />
gianni.deangelis@spacesystems.solutions<br />
Space Systems Solutions<br />
Marcello Coradini<br />
marcello.coradini@spacesystems.solutions<br />
Space Systems Solutions<br />
10 <strong>GEOmedia</strong> n°3-<strong>2023</strong>
FOCUS<br />
Il Forum dell'Innovazione<br />
Tecnologie per il Territorio, Beni Culturali e Smart Cities<br />
Roma<br />
14 - 16 NOV <strong>2023</strong><br />
www.technologyforall.it<br />
<strong>GEOmedia</strong> n°3-<strong>2023</strong> 11
REPORT<br />
Spatial, functional and<br />
temporal Analysis of Wi-Fi<br />
hotspots during covid-19 curfew<br />
In selected EU cities Rome, Thessaloniki,<br />
Nicosia, Kaunas.<br />
by Marius Ivaškevičius<br />
Behavior of people in<br />
extreme condition is one<br />
of the main target of the<br />
eUMaP project, funded<br />
under European Union’s<br />
Horizon 2020 project Marie<br />
Slodowska-Curie Actions.<br />
Problem and Relevance<br />
In order to model behavior of<br />
people in extreme conditions<br />
we need recorded data that represents<br />
this behavior.<br />
How to measure behavior of<br />
people?<br />
Exact data representing behavior<br />
is very sensitive and can<br />
be used in illegal ways even by<br />
accident, therefore we want approximate<br />
data.<br />
Hypothetical scenario and<br />
Data availability<br />
In modern world Internet became<br />
almost free and highly<br />
popular means of worldwide<br />
communication.<br />
Wi-Fi became one of most popular<br />
means to deliver internet<br />
to end user.<br />
Gatherings of people create<br />
temporary or more permanent<br />
Wi-Fi hotspots to share internet.<br />
Wi-Fi hotshots broadcast basic<br />
information on open channels.<br />
It becomes public information.<br />
Volunteers of WiGLE community<br />
(http://wigle.net) gather<br />
this data and publish it on<br />
their site. It is also possible to<br />
gain access directly to database.<br />
WiGLE.net<br />
WiGLE.net is a submissionbased<br />
catalog of wireless networks.<br />
Submissions are not<br />
paired with actual people; rather<br />
name/password identities<br />
which people use to associate<br />
their data. It's basically a "gee<br />
isn't this neat" engine for learning<br />
about the spread of wireless<br />
computer usage.<br />
WiGLE concerns itself with<br />
802.11a/b/g/n and cellular networks<br />
right now, which can be<br />
collected via the WiGLE WiFi<br />
Wardriving tool on android.<br />
We also have a bluetooth stumbling<br />
client for Android, but<br />
do not maintain a catalog of<br />
bluetooth networks.<br />
WiGLE consolidate location<br />
and information of wireless<br />
networks world-wide to a<br />
central database, and has a<br />
user-friendly desktop and web<br />
12 <strong>GEOmedia</strong> n°3-<strong>2023</strong>
REPORT<br />
LAND COVER FROM COPERNICUS AND WIFI NETWORK USE FROM WIGLE IN 4 EU CITIES<br />
Kaunas City – Copernicus Land Cover Kaunas City Features count 246,482<br />
Nicosia – Copernicus Land Cover Nicosia – Features count 116,033<br />
Rome – Copernicus Land Cover Rome - Feature count 407,632<br />
Thessaloniki – Copernicus Land Cover Thessaloniki - Feature count 465.497<br />
Fig. 1 – Land Cover from Copernicus and WIFI network use from WIGLE in 4 EU Cities<br />
<strong>GEOmedia</strong> n°3-<strong>2023</strong> 13
REPORT<br />
Fig. 2 - Time slice analysis in Kaunas City.<br />
Fig. 3 - Grid Count Scan in Kaunas City.<br />
applications that can map,<br />
query and update the database<br />
via the web.<br />
Everyone can contribute<br />
to this mapping sending<br />
wireless network traces<br />
(in any of listed formats,<br />
usually pairings of wireless<br />
sample, names and network<br />
hardware addresses<br />
- for uniqueness -, data/<br />
SNR triples and GPS<br />
coordinates) or enter networks<br />
manually.<br />
For more information:<br />
https://wigle.net/wiki/<br />
index.cgi<br />
Data download<br />
WiGLE limits requests per<br />
day.<br />
Automated using crontab.<br />
Hosts a web page to monitor<br />
progress.<br />
Conclusions<br />
Counting Wi-Fi hotspot<br />
by land use categories in<br />
multiple time slices can<br />
pinpoint human behavior<br />
during the lockdown.<br />
Wi-Fi hotspot change centered<br />
in the event of curfew<br />
start allows to inspect<br />
territories by positive or<br />
negative trend.<br />
Proposed parameter, Wi-Fi<br />
index, can be used to describe<br />
the communications<br />
state of the city. It reveals<br />
temporal trends that could<br />
not be detected without<br />
it. It represents speed of<br />
Wi-Fi hotspot creation<br />
normalized by area of explored<br />
territory.<br />
Although there are no<br />
common trends between<br />
cities, differences could<br />
potentially be related to<br />
macro parameters. This<br />
could be validated statistically<br />
by including more<br />
cities in the research.<br />
Fig. 4 - Time step scan in Kaunas City.<br />
14 <strong>GEOmedia</strong> n°3-<strong>2023</strong>
REPORT<br />
WIFI CHANGE IN 4 EU CITIES DURING COVID 19<br />
Kaunas City WiFi change<br />
Nicosia WiFi change<br />
Rome WiFi change<br />
Thessaloniki WiFi Change<br />
Fig. 5 – WIFI change in 4 EU cities during COVID 19.<br />
KEYWORDS<br />
Covid19; eUMaP; WiFi<br />
ABSTRACT<br />
Behavior of people in extreme condition is one<br />
of the main target of the eUMaP project, funded<br />
under European Union’s Horizon 2020 project<br />
Marie Slodowska-Curie Actions.<br />
AUTHOR<br />
Marius Ivaškevičius<br />
Kaunas University of Technology<br />
Faculty of Civil Engineering and Architecture<br />
Department of Architecture and Urbanism<br />
Studentų st. 48-303 Kaunas, LT-51367,<br />
Lithuania<br />
marius.ivaskevicius@ktu.lt<br />
Fig. 6 - Possible Dependencies, WIFI index in 4 EU cities.<br />
<strong>GEOmedia</strong> n°3-<strong>2023</strong> 15
REPORT<br />
Geomatic techniques for utilities<br />
consumption analysis in urban<br />
areas during emergency periods<br />
by Sara Zollini, Maria Alicandro, Donatella Dominici<br />
Understanding the effects of<br />
Covid-19 by studying indirect<br />
factors with the synergy of geomatic<br />
techniques, namely images from<br />
optical sensors mounted on aircraft,<br />
UAV and satellites. Proposal of a<br />
new methodology to highlight the<br />
changes between the periods pre-,<br />
during, and post-lockdown.<br />
Fig. 1 – Case study in the Ano Poli of Thessaloniki (Greece).<br />
To understand<br />
the influence<br />
of Covid-19 to<br />
utilities consumption in<br />
residential zones, a proposal<br />
of methodology to extract<br />
parking spots in the urban area<br />
of Thessaloniki is presented.<br />
Taking advantage of the<br />
synergy between different<br />
geomatic techniques, change<br />
detection analysis can lead to<br />
a better management of the<br />
territory.<br />
Introduction<br />
At the beginning of 2020,<br />
Europe went through an<br />
arduous period because<br />
of the contagious disease<br />
of Covid-19. The disease<br />
spread all over the world<br />
at incredible rate, so each<br />
state, with the aim of<br />
reducing and stopping the<br />
transmission of coronavirus,<br />
adopted extreme restrictions<br />
(lockdown) and measures<br />
that inevitably affected not<br />
only the economic but also<br />
the social and psychological<br />
life of the citizens. During<br />
this period, one of the<br />
problems that occurred was<br />
the management of building<br />
utilities. More specifically,<br />
more people started working<br />
remotely from their homes<br />
instead of the working place,<br />
creating numerous problems<br />
related to the integrity of<br />
everyday utilities, such as<br />
power outages, water shortage<br />
and insufficient internet<br />
connection. The management<br />
of this kind of public utilities<br />
mainly describes an issue of<br />
high complexity because they<br />
are not always freely available,<br />
or they refer to build-up areas<br />
and not to specific buildings.<br />
So, it could be of great<br />
advantage to study indirect<br />
factors, such as the occupation<br />
of parking spots in residential<br />
areas. The synergy between<br />
different geomatic techniques<br />
can accomplish this task.<br />
In this work, a proposal of<br />
methodology to extract cars<br />
occupation is presented. UAV<br />
photogrammetry, satellite and<br />
aerial remote sensed images are<br />
specifically used to achieve this<br />
purpose.<br />
Study area<br />
The case study is located in the<br />
Municipality of Thessaloniki,<br />
in the Ano Poli region, around<br />
the old Byzantine church Saint<br />
Nicolas Orfanos, in Greece<br />
(Figure 1). This is one of the<br />
six districts in which the city<br />
is divided. This urban block<br />
16 <strong>GEOmedia</strong> n°3-<strong>2023</strong>
REPORT<br />
covers an area of 5000 m 2 and<br />
all residential buildings within<br />
the urban block have same<br />
typology but different age<br />
of construction. During the<br />
Great Fire in 1917, two thirds<br />
of the city of Thessaloniki was<br />
destroyed, except for the area<br />
of Ano Poli, which remained<br />
unscathed. The government<br />
commissioned the French<br />
architect Ernest Hébrard to<br />
design a new urban plan for<br />
the burned areas and for the<br />
future expansion of the city.<br />
Its architecture contrasts<br />
with the Byzantine style of<br />
Ano Poli, which was even<br />
declared UNESCO heritage.<br />
The Upper Town preserves<br />
Thessaloniki’s Ottoman-era<br />
attributes, including small<br />
stone-paved streets, old city<br />
squares, and houses densely<br />
built in traditional Greek and<br />
Ottoman fashion (Boston,<br />
2014).<br />
Data acquisition<br />
The main and final idea of the<br />
work is to analyse the changes<br />
happened in the periods<br />
before, during and after the<br />
lockdown. The available<br />
data are aerial orthoimages<br />
(LSO) provided by the<br />
Greek National Cadastre and<br />
acquired in 2015 with 50<br />
cm spatial resolution (prelockdown),<br />
satellite VHR<br />
(Very High Resolution)<br />
GaoJing/Superview-1 images<br />
acquired in 2020 with 50 cm<br />
and 2 m spatial resolution<br />
for the panchromatic<br />
and multispectral images<br />
respectively (during<br />
lockdown), and UAV images<br />
acquired in 2021 (postlockdown)<br />
with a GSD<br />
(Ground Sample Distance)<br />
equal to 1.26 cm/pixel.<br />
GaoJing/SuperView-1<br />
constellation is composed<br />
of 4 identical VHR EO<br />
Tab. 1: Superview-1 specs.<br />
satellites running along the<br />
same orbit and phrased 90°<br />
from each other. The first<br />
two satellites were launched<br />
in December 2016 and the<br />
second two were launched in<br />
January 2018. They are highresolution<br />
commercial satellites<br />
designed, developed, and<br />
operated by China. GaoJing/<br />
SuperView-1 constellation<br />
is China's first commercial<br />
satellite constellation with<br />
high agility and multi-mode<br />
imaging capability. When<br />
4 GaoJing/SuperView-1<br />
satellites work concurrently,<br />
they can collect over 2 million<br />
square kilometres every day<br />
and revisiting any target on<br />
the Global within 1 day. The<br />
optical payload contains a<br />
pushbroom type camera with<br />
0.5 m GSD for a panchromatic<br />
imagery and 2 m GSD in four<br />
MS (Multispectral) bands (red,<br />
green, blue and NIR). The<br />
swath width of the generated<br />
image is 12 km (European<br />
Space Agency, 2016). The<br />
technical specs are reported in<br />
Table 1. This constellation has<br />
been used in wide applications<br />
and environments, like forest<br />
(Chen et al., <strong>2023</strong>), mapping<br />
(Li et al., 2021), urban areas<br />
(Khryaschev and Ivanovsky,<br />
2019), soil (Prokopyeva,<br />
2022), landslide (Xia et al.,<br />
2021) and so on.<br />
After the lockdown, on<br />
September 9th, 2021, 244<br />
UAV georeferenced images<br />
were acquired with a GSD<br />
of 1.26 cm/pixel, established<br />
by setting a flight altitude<br />
of 100 m above the take-off<br />
point. The used UAV was<br />
the DJI Matrice 300 RTK,<br />
with dual receivers that<br />
connect to permanent GNSS<br />
stations network via 4G<br />
(SmartNET Europe by Leica<br />
Geosystems). The used sensor<br />
is a full frame Zenmuse P1 of<br />
45Mpixels. The longitudinal<br />
and transverse overlap was<br />
70%. The UAV and sensor<br />
Fig. 2 – UAV and sensor specifications and flight planning for data acquisition.<br />
<strong>GEOmedia</strong> n°3-<strong>2023</strong> 17
REPORT<br />
Fig. 3 – GaoJing/Superview-1 panchromatic and multispectral images and the proposed<br />
pre-processing.<br />
specifications, as well as the<br />
flight plan used to acquire the<br />
data are illustrated in Figure 2.<br />
Proposed methodology<br />
The aim of this work is to<br />
analyse any changes happened<br />
in the period around the<br />
lockdown to understand the<br />
utilities consumption. So, the<br />
proposed methodology consists<br />
in applying an object-based<br />
image analysis (OBIA) on the<br />
images pre-, during and postcovid<br />
for a change detection.<br />
The research started from the<br />
GaoJing/Superview-1 preprocessing.<br />
The processing<br />
level used for this work is the<br />
1B, the basic product, that<br />
is corrected for radiometric<br />
and sensor distortion but not<br />
geometrically corrected or<br />
projected to a plane using a<br />
Fig. 4 – Flowchart of the proposed methodology.<br />
map projection or datum. So,<br />
they need to be projected and<br />
resampled. For this reason,<br />
the first step to be performed<br />
is the pansharpening, a fusion<br />
technique used to obtain a<br />
new image with the spatial<br />
resolution of the panchromatic<br />
(50 cm) and the spectral<br />
resolution of the multispectral<br />
one. The NNDiffuse<br />
algorithm should be used<br />
because it works best when<br />
the spectral response function<br />
of each multispectral band<br />
has minimal overlap with one<br />
another, and the combination<br />
of all multispectral bands<br />
covers the spectral range of<br />
the panchromatic raster (Sun<br />
et al., 2014). Then, in order<br />
to correct the geometry and<br />
the spatial position of the<br />
image, the orthorectification<br />
and georeferencing have to<br />
be performed. At the end, a<br />
stack of all the layers can be<br />
applied and the area of interest<br />
is extracted by making a subset<br />
on the image. In Figure 3<br />
the original images and the<br />
proposed pre-processing is<br />
showed.<br />
The research continued<br />
with the UAV images,<br />
which are treated within the<br />
photogrammetric process. The<br />
well-known workflow starts<br />
from the acquisition phase<br />
and then goes through the<br />
photogrammetric elaboration.<br />
The first step is divided<br />
into two main phases, the<br />
survey planning, and the data<br />
acquisition. The second step<br />
include the Structure from<br />
Motion, the dense matching<br />
and the mesh and texture<br />
generation. The final products<br />
are the 3D model, the point<br />
cloud, the Digital Elevation<br />
Model (DEM), and the<br />
orthomosaic. The last is used<br />
to perform the OBIA. The<br />
OBIA consists of two steps,<br />
segmentation and classification<br />
(Teodoro and Araujo, 2016).<br />
In segmentation, pixels with<br />
similar features, like brightness,<br />
colour, texture are grouped<br />
to form vector objects called<br />
segments. In the classification,<br />
each object is assigned to<br />
the class that better define it<br />
according to its characteristics.<br />
The classification is generally<br />
supervised, so a user chooses<br />
how much and what classes<br />
should be created to train<br />
the decision model. This<br />
technique is one of the most<br />
advantageous for many<br />
reasons. Segmentation divides<br />
an image into objects as the<br />
human eyes do. By creating<br />
objects, the computational<br />
burden is less than other<br />
techniques, like, for example,<br />
the pixel-based ones. The<br />
18 <strong>GEOmedia</strong> n°3-<strong>2023</strong>
REPORT<br />
segments, composed by many<br />
pixels, have additional spectral<br />
information compared to the<br />
individual pixels (like average,<br />
minimum and maximum<br />
values, variance and so on).<br />
They also contain spatial<br />
information, like mutual<br />
distances between objects,<br />
number of pixels which<br />
compose the object, topology,<br />
and so forth (Blaschke, 2010).<br />
In addition, image objects<br />
take into account many<br />
features (like shape, texture,<br />
relationship with other objects)<br />
which are not present in single<br />
pixels. At last, segmentation<br />
reduces the spectral variability<br />
between the classes (Alicandro<br />
et al., <strong>2023</strong>; Zollini et<br />
al., 2020). The proposed<br />
methodology is illustrated in<br />
Figure 4.<br />
First results<br />
The first results come from<br />
the photogrammetric process.<br />
The obtained orthomosaic<br />
has a final RMS of 0.05 m<br />
and a DEM with 5.6 cm/pixel<br />
resolution (Figure 5).<br />
On the orthomosaic, the<br />
OBIA was applied, but it still<br />
requires further investigation,<br />
as the classifier presented<br />
difficulty in distinguishing<br />
cars from the road and the<br />
cemetery. What can be done,<br />
is to isolate the roads from<br />
the rest of the image and<br />
apply the OBIA only in that<br />
part of the image. As far as<br />
the orthomaps acquired in<br />
2015 is concerned, as well as<br />
the Superview images, 50 cm<br />
resolution could not be enough<br />
for car detection. According<br />
to the literature, there are two<br />
deep learning-based models<br />
for vehicle counting from<br />
optical satellite images coming<br />
from the Pleiades sensor at<br />
50-cm spatial resolution. Both<br />
segmentation (Tiramisu) and<br />
detection (YOLO, You Only<br />
Look Once) architectures were<br />
investigated in Froidevaux et<br />
al., 2020, but a deeper study<br />
of the state of art will be<br />
performed. Once the roads<br />
are isolated, a subset of the<br />
image can be performed, and<br />
the surrounding noises can<br />
be removed. The DEM was,<br />
instead, used to orthorectify<br />
and georeferencing the satellite<br />
images with the image-toimage<br />
technique. 30 GCP<br />
were used and a final RMS of<br />
0.768 was achieved. The next<br />
step would be applying the<br />
OBIA also to the pre-processed<br />
Superview-1 and compare<br />
eventual changes. Finally, the<br />
same procedure will be applied<br />
to the aerial images provided<br />
by the Greek National<br />
Cadastre acquired in 2015 and<br />
the final change detection will<br />
be performed.<br />
Conclusions and future<br />
developments<br />
To conclude, this paper aimed<br />
to propose a methodology to<br />
indirectly study the effects<br />
of Covid-19 on the increase<br />
of utilities consumption.<br />
The input data refer to the<br />
periods pre-, during and<br />
post-lockdown and make<br />
use of different geomatic<br />
techniques, such as satellite<br />
remote sensing and UAV<br />
Fig. 5 - Orthomosaic and DEM of Thessaloniki Ano Poli.<br />
photogrammetry. A change<br />
detection can be performed by<br />
analysing the input images at<br />
first with the OBIA, but then,<br />
other algorithms within the<br />
machine learning world will<br />
be also tested and compared.<br />
The road extraction leads to<br />
understand the occupation<br />
of parking spots and, so, the<br />
probable presence inside the<br />
houses during the working<br />
hours. Consequently, the real<br />
consumptions can be used to<br />
validate the results. Moreover,<br />
they can be integrated inside<br />
BIM and GIS and could be<br />
very helpful for those in charge<br />
of the territory management.<br />
This can lead to a less<br />
expensive and time-consuming<br />
analysis for future cities<br />
development.<br />
Acknowledgment<br />
The authors would like to<br />
thank professors Konstantinos<br />
Tokmakidis and Panagiotis<br />
Tokmakidis of Aristotle<br />
University of Thessaloniki for<br />
their precious contribution on<br />
UAV data collection. Many<br />
thanks also to Vasiliki (Betty)<br />
Charalampopoulou and the<br />
staff of GSH of Athens, who<br />
hosted the authors during the<br />
secondments and provided the<br />
satellite imagery within the<br />
eUMaP project.<br />
<strong>GEOmedia</strong> n°3-<strong>2023</strong> 19
REPORT<br />
BIBLIOGRAPHY<br />
Alicandro, M., Dominici, D., Pascucci, N., Quaresima, R., & Zollini,<br />
S. (<strong>2023</strong>). Enhanced Algorithms to Extract Decay Forms of Concrete<br />
Infrastructures from Uav Photogrammetric Data. The International Archives<br />
of the Photogrammetry, Remote Sensing and Spatial Information Sciences,<br />
48, 9-15.<br />
Blaschke, T. (2010). Object based image analysis for remote sensing.<br />
ISPRS J. Photogramm. Remote Sens. 65, 2-16. https://doi.org/10.1016/j.<br />
isprsjprs.2009.06.004<br />
Boston, G. (2014). Upper Town or Ano Poli: Historical Thessaloniki https://<br />
www.greekboston.com/travel/ano-poli-thessaloniki/ (Accessed 9-11-23).<br />
Chen, X., Shen, X., Cao, L. (<strong>2023</strong>). Tree Species Classification in Subtropical<br />
Natural Forests Using High-Resolution UAV RGB and SuperView-1<br />
Multispectral Imageries Based on Deep Learning Network Approaches: A Case<br />
Study within the Baima Snow Mountain National Nature Reserve, China.<br />
Remote Sens. 15, 2697. https://doi.org/10.3390/rs15102697<br />
European Space Agency. (2016). GaoJing / SuperView Earth Observation<br />
Constellation - eoPortal https://www.eoportal.org/satellite-missions/<br />
gaojing#Gaojing-Superview.html.1 (Accessed 9-11-23).<br />
Froidevaux, A., Julier, A., Lifschitz, A., Pham, M. T., Dambreville, R., Lefèvre,<br />
S., ... & Huynh, T. L. (2020, September). Vehicle detection and counting<br />
from VHR satellite images: Efforts and open issues. In IGARSS 2020-2020<br />
IEEE International Geoscience and Remote Sensing Symposium (pp. 256-<br />
259). IEEE.<br />
Khryaschev, V., Ivanovsky, L. (2019). Urban areas analysis using satellite image<br />
segmentation and deep neural network. E3S Web Conf. 135, 01064. https://<br />
doi.org/10.1051/e3sconf/201913501064<br />
Li, D., Wang, M., Jiang, J. (2021). China’s high-resolution optical remote<br />
sensing satellites and their mapping applications. Geo-Spat. Inf. Sci. 24, 85-94.<br />
https://doi.org/10.1080/10095020.2020.1838957<br />
Prokopyeva, K.O. (2022). The Use of Multi-Temporal High-Resolution<br />
Satellite Images to Soil Salinity Assessment of the Solonetzic Complex<br />
(Republic of Kalmykia). Arid Ecosyst. 12, 394-406. https://doi.org/10.1134/<br />
S2079096122040163<br />
Sun, W., Chen, B., Messinger, D. (2014). Nearest-neighbor diffusion-based<br />
pan-sharpening algorithm for spectral images. Opt. Eng. 53, 013107. https://<br />
doi.org/10.1117/1.OE.53.1.013107<br />
Teodoro, A.C., Araujo, R. (2016). Comparison of performance of objectbased<br />
image analysis techniques available in open source software (Spring and<br />
Orfeo Toolbox/Monteverdi) considering very high spatial resolution data. J.<br />
Appl. Remote Sens. 10, 016011. https://doi.org/10.1117/1.JRS.10.016011<br />
Xia, W., Chen, J., Liu, J., Ma, C., Liu, W. (2021). Landslide Extraction<br />
from High-Resolution Remote Sensing Imagery Using Fully Convolutional<br />
Spectral–Topographic Fusion Network. Remote Sens. 13, 5116. https://doi.<br />
org/10.3390/rs13245116<br />
Zollini, S., Alicandro, M., Dominici, D., Quaresima, R., Giallonardo,<br />
M. (2020). UAV Photogrammetry for Concrete Bridge Inspection Using<br />
Object-Based Image Analysis (OBIA). Remote Sens. 12, 3180. https://doi.<br />
org/10.3390/rs12193180<br />
KEYWORDS<br />
UAV photogrammetry; remote sensing; Superview-1; change<br />
detection; Covid-19<br />
ABSTRACT<br />
This paper has the main purpose of proposing a methodology to<br />
understand the occupation of parking spots by using the synergy<br />
of different geomatic techniques. Aerial, satellites, and UAV data<br />
are studied through the OBIA to analyse, by change detection, the<br />
main differences pre-, during and post-lockdown due to Covid-19.<br />
The first results are really promising and pave the ground for a future<br />
automation of the proposed procedure. The results can be also<br />
integrated in BIM and GIS to help the management of utilities<br />
consumption in emergency periods, and they create a dataset to<br />
enhance and increase consumption efficiency in residential areas.<br />
AUTHOR<br />
PhD Eng. Sara Zollini<br />
sara.zollini@univaq.it<br />
PhD Eng. Maria Alicandro<br />
maria.alicandro@univaq.it<br />
Prof. Donatella Dominici<br />
donatella.dominici@univaq.it<br />
DICEAA, Department of Civil, Construction-Architectural<br />
and Environmental Engineering, University of L’Aquila,<br />
Via G. Gronchi 18, 67100, L’Aquila, Italy<br />
20 <strong>GEOmedia</strong> n°3-<strong>2023</strong>
REPORT<br />
<strong>GEOmedia</strong> n°3-<strong>2023</strong> 21
REPORT<br />
PASSport: a sample of<br />
heterogeneous fleet of drones<br />
powered by Galileo OSNMA service<br />
by A. R. Martín, I. Armengol, M. López, H. Llorca, M. Nisi, M. Lopez<br />
Ports and National Authorities<br />
around the world assuming its role<br />
as critical infrastructure have the<br />
commitment to establish, update<br />
and maintain a security plan. The<br />
issue of security in maritime ports is<br />
a well-known complex problem due<br />
to the particular characteristics of<br />
these facilities. They consist of large<br />
wide areas with many entry points,<br />
usually very transited and operating<br />
24 hours per day, every day.<br />
These features lead to<br />
certain vulnerabilities<br />
and threats whose<br />
risks may be mitigated by<br />
implementing innovative<br />
surveillance actions. Besides<br />
these widely known dangers,<br />
over the past two decades,<br />
new risks have emerged with<br />
the development of new<br />
technologies, such as jamming<br />
and spoofing of GNSS signals<br />
that in practice represents the<br />
Denial-of-Service (DDoS).<br />
These might lead to failures<br />
or disruptions in the daily<br />
operations of the port,<br />
degrading its services and/or<br />
infrastructures. In particular,<br />
signal jamming consists of<br />
interfering GNSS receivers<br />
with higher-power signals<br />
on the GNSS frequency<br />
bands at user level, or with<br />
unintentional interferences<br />
due to space weather or other<br />
nearby radiating equipment.<br />
Jamming techniques can be<br />
followed by spoofing attacks,<br />
whose goal is to deceive<br />
receivers with GNSS-like<br />
signals that contain wrong<br />
observable data.<br />
These problems have been<br />
identified by the European<br />
Commission and the need<br />
of improving security and<br />
safety in port areas has been<br />
portrayed in the directive<br />
2005/65/CE. As part of the<br />
important search of solutions,<br />
PASSport (Operational<br />
Platform managing a fleet<br />
of semi-autonomous drones<br />
exploiting GNSS High<br />
Accuracy and Authentication<br />
to improve Security & Safety<br />
in port areas) is an EUSPA<br />
funded project that responds<br />
to the needs expressed by port<br />
authorities, harbour master and<br />
border control authorities by<br />
extending situational awareness<br />
to improve safety and security<br />
in port areas.<br />
The surveiilance solution<br />
The proposed surveillance<br />
solution of the project<br />
combines both aerial and<br />
underwater drones with a<br />
network of RFI monitoring<br />
stations. The use of this<br />
fleet of drones is intended<br />
to provide innovation and<br />
operational support to the<br />
recognition, management and<br />
analysis of safety and security<br />
aspects of daily operations,<br />
with particular attention to<br />
pollution monitoring, support<br />
to e-navigation, protection<br />
22 <strong>GEOmedia</strong> n°3-<strong>2023</strong>
REPORT<br />
of critical infrastructures<br />
and against non-cooperative<br />
small craft approaching port<br />
areas, and underwater threats<br />
monitoring. Particularly, the<br />
drones combine state of the<br />
art technologies to collect on<br />
field data in real time, which<br />
allows surveillance with an<br />
extended situational awareness<br />
by covering larger areas. So<br />
far, operational surveillance<br />
activities to guarantee security<br />
and safety are dealing with<br />
static sensors, and the data<br />
collected cannot automatically<br />
trigger dedicated operational<br />
procedures. With PASSport<br />
vision, this limitation is<br />
overcome by proposing a<br />
holistic surveillance solution.<br />
The solution will be connected<br />
with already deployed<br />
operational platforms and<br />
exploit the innovation brought<br />
by drones assisted with<br />
E-GNSS technology.<br />
Drone fleet and GNSS<br />
hybridisation<br />
The above-mentioned drone<br />
fleet integrates, among other<br />
sensors, the use of GNSS<br />
receivers for a secure, safe and<br />
accurate guidance, navigation,<br />
and control (GNC). GNSS<br />
technologies are widely used<br />
for many purposes in drone<br />
navigation systems, as they<br />
are integrated in most, if not<br />
all, conventional autopilots.<br />
However, accuracy and<br />
security of this technology can<br />
be compromised in certain<br />
demanding areas, such as<br />
port infrastructures due to<br />
multipath, or if subjected<br />
to certain interferences,<br />
either intentional or not,<br />
and this is the reason why<br />
hybridisation with other<br />
sensors is usually contemplated<br />
in a risk assessment. In any<br />
case, even with hybridised<br />
configurations, a diminished<br />
GNSS performance may lead<br />
to a potential degradation of<br />
the drone navigation system.<br />
Open Service – Navigation<br />
Message Authentication<br />
(OSNMA)<br />
Taking this into consideration,<br />
the integration and<br />
exploitation of new GNSS<br />
services oriented to improving<br />
accuracy and security is<br />
not only justified but also<br />
necessary.<br />
In terms of accuracy, a PPP<br />
algorithm in post-processing<br />
is considered, as it is a widely<br />
mature positioning technique.<br />
This positioning method<br />
uses single or dual-frequency<br />
code and carrier phase<br />
measurements for centimetric<br />
accuracy applications. On<br />
the other hand, in terms of<br />
security, navigation with<br />
Galileo’s newcomer Open<br />
Service – Navigation Message<br />
Authentication (OSNMA)<br />
is used. OSNMA is a data<br />
authentication function<br />
for Galileo that provides<br />
receivers with the assurance<br />
that the received Galileo<br />
navigation message is coming<br />
from the system itself and<br />
has not been modified. The<br />
use of this service in the<br />
PASSport solution helps in<br />
the avoidance of some of<br />
the aforementioned threats<br />
in port context. In terms of<br />
safety an integrity (as IBPL)<br />
approach is considered to<br />
provide protection levels (PLs).<br />
The described capabilities in<br />
terms of accuracy, integrity,<br />
and security will be introduced<br />
in an evolution of GMV’s<br />
GNSS receiver MAGIC<br />
User Terminal, which will be<br />
embarked onboard the aerial<br />
drones. For the monitoring<br />
backbone, GMV’s srx-10i<br />
(also known as DINTEL) will<br />
provide a cost-effective, dualband,<br />
simultaneous monitoring<br />
of GNSS bands. Monitoring<br />
stations will augment onground<br />
the decision-making<br />
process of port area operators<br />
by providing alert mechanisms<br />
and automated report<br />
functionalities on the presence<br />
of RFI threads.<br />
The purpose of this paper,<br />
in this context, is to assess<br />
the functionalities of PPP,<br />
OSNMA and RFI monitoring<br />
in terms of robustness against<br />
spoofing attacks and accuracy<br />
of positioning obtained with<br />
authenticated navigation<br />
messages compared to nonauthenticated<br />
navigation<br />
results. These functionalities<br />
are validated with results<br />
obtained from different flight<br />
campaigns using real Signal-in-<br />
Space (SiS). These campaigns<br />
are performed in different<br />
European ports such as<br />
Kolobrzeg, Valencia, Le Havre,<br />
Hamburg and Ravenna.<br />
KEYWORDS<br />
Ports; OSNMA; GNSS; Galileo;<br />
Drone fleet<br />
ABSTRACT<br />
PASSport is an Operational Platform managing a<br />
fleet of semi-autonomous drones exploiting GNSS<br />
High Accuracy and Authentication to improve Security<br />
& Safety in port areas. EUSPA funded the<br />
project that responds to the needs expressed by<br />
port authorities, harbour master and border control<br />
authorities by extending situational awareness<br />
to improve safety and security in port areas.<br />
AUTHOR<br />
A. R. Martín,<br />
I. Armengol,<br />
M. López, H.<br />
Llorca, GMV;<br />
M. Nisi,<br />
marco.nisi@grupposistematica.it<br />
SISTEMATICA S.p.A;<br />
M. Lopez, EUSPA<br />
NOTE<br />
More information available on paper presented<br />
at ION GNSS+ <strong>2023</strong><br />
Session B2: Marine Applications, and Search and<br />
Rescue<br />
https://www.ion.org/gnss/sessions.cfm?sessionID=1566<br />
<strong>GEOmedia</strong> n°3-<strong>2023</strong> 23
REPORT<br />
Windows opening in naturally ventilated<br />
classrooms: management strategies to<br />
balance energy use and reduction of risk<br />
infection transmission<br />
By Giulia Lamberti, Giacomo Salvadori<br />
Ensuring proper ventilation to reduce infection risks<br />
indoors has become increasingly important, especially<br />
during the COVID-19 pandemic. For naturally ventilated<br />
buildings, generic guidelines, such as "open windows as<br />
much as possible," pose challenges in effectively managing<br />
ventilation rates. This work addresses this complexity by<br />
focusing on classrooms at diverse educational stages to<br />
quantify the management of naturally ventilated spaces.<br />
The study presents a method to determine window opening<br />
time and frequency, considering window characteristics,<br />
indoor and outdoor conditions, and room occupancy.<br />
Results reveal that opening time correlates with room<br />
surface and occupancy but diminishes with larger window<br />
areas and favourable discharge coefficients based on<br />
window types. Additionally, in windless conditions, opening<br />
time decreases as the indoor-outdoor temperature<br />
difference increases.<br />
This research emphasizes the urgent need for more<br />
efficient guidelines for naturally ventilated environments,<br />
ensuring healthy indoor conditions not only during the<br />
pandemic but also in the post-pandemic era. Implementing<br />
these findings will promote safer and healthier indoor<br />
spaces for educational settings and beyond.<br />
Since people are spending<br />
an increasing amount<br />
of time indoors, Indoor<br />
Environmental Quality (IEQ)<br />
has become a very important<br />
issue to improve the health<br />
and well-being of occupants<br />
(Bluyssen, 2020). During the<br />
COVID-19 pandemic, the<br />
necessity to ensure healthy<br />
environments has become<br />
even more evident, since IEQ<br />
can have direct effects on<br />
occupants’ safety (Awada et<br />
al., 2021) and environmental<br />
quality has a direct effect on<br />
infection control (Azuma et<br />
al., 2020).<br />
The airborne transmission of<br />
COVID-19 has been widely<br />
recognised by researchers as<br />
one of the three modalities,<br />
together with large respiratory<br />
droplets (falling in a range<br />
of 1-2 m) and direct contact<br />
with contaminated surfaces<br />
(Morawska et al., 2020;<br />
Noorimotlagh et al., 2021).<br />
This evidence has been<br />
confirmed by several cases<br />
of COVID-19 spread due<br />
to environmental factors,<br />
such as the restaurant in<br />
Guangzhou, China (Lu et al.,<br />
2020) where the direction<br />
of the airflow from the air<br />
conditioners was consistent<br />
with the disease transmission.<br />
Li et al. (Li et al., 2020)<br />
also brought evidence that<br />
the aerosol transmission of<br />
COVID-19 was related to<br />
poor ventilation of buildings.<br />
24 <strong>GEOmedia</strong> n°3-<strong>2023</strong>
REPORT<br />
Further cases confirming this<br />
infection pathway are the call<br />
centre in Seoul, South Korea<br />
(Park et al., 2020), which<br />
showed that the exposure time<br />
is a determinant in increasing<br />
the risk, or the case of the<br />
choir in the Skagit Valley, USA<br />
(Hamner et al., 2020), which<br />
highlighted the influence of<br />
activity on COVID-19 spread.<br />
In particular, increasing the<br />
ventilation can reduce the<br />
infection risk indoors (Dai and<br />
Zhao, 2020; Lipinski et al.,<br />
2020; Morawska et al., 2020)<br />
and environmental parameters<br />
should be also used to prevent<br />
the pandemic (Yao et al., 2020).<br />
For this reason, several<br />
guidelines have been provided<br />
to manage buildings during<br />
this period. Generally, the<br />
indications for buildings<br />
provided by HVAC systems are<br />
much more detailed than the<br />
ones for naturally ventilated<br />
environments. In general, it was<br />
required to maintain ventilation<br />
systems as usual, keeping<br />
them on two hours before<br />
and after the room occupancy<br />
(ECDC, 2020). If possible, it<br />
was also required to avoid air<br />
recirculation and to increase<br />
the airflow in the space. Except<br />
for Norway, which suggests<br />
ACH=7l/s pers, for everyday<br />
environments (e.g. offices,<br />
schools, etc) the national and<br />
institutional guidelines do not<br />
provide an exact value of air<br />
changes required during the<br />
pandemic period, but they<br />
recommend at least maintaining<br />
usual the required airflow for a<br />
longer period.<br />
For naturally ventilated<br />
buildings, the situation is<br />
even more complex as it is not<br />
possible to monitor directly the<br />
airflow passing through doors<br />
and windows. Indications are<br />
usually generic and specify that<br />
windows should be opened<br />
Tab. 1 - Classrooms’ characteristics in Italy according to different educational stages (DM<br />
18-12-1975, 1975).<br />
“regularly” and in some cases,<br />
they are in contrast with each<br />
other (e.g. Italy recommends<br />
keeping doors closed, while the<br />
Netherlands maintains windows<br />
and doors open). Moreover,<br />
guidelines provide approximate<br />
opening times such as 10 to 15<br />
minutes once or more times<br />
per day, which is a very generic<br />
indication that does not take<br />
into account parameters such<br />
as the room characteristics or<br />
occupancy. Only Germany,<br />
Norway, and REHVA suggest<br />
the use of CO2 sensors as<br />
an indicator of potential<br />
SARS-CoV-2 presence, which<br />
has been demonstrated as a<br />
useful tool to assess infection<br />
probability (Peng and Jimenez,<br />
2020; Fantozzi et al., 2022).<br />
This paper, therefore, aims to<br />
evaluate window openings to<br />
ensure healthy conditions and<br />
reduce the risk of infection,<br />
taking school buildings as a<br />
reference.<br />
Methodology<br />
Characteristics of the classrooms<br />
Classrooms’ characteristics may<br />
vary according to the school<br />
stage considered. Standards<br />
report the typical features that<br />
classrooms at various school<br />
stages present, as reported in<br />
Table 1.<br />
For calculation purposes, the<br />
dimensions of the classrooms<br />
were assumed equal to 45 m 2<br />
for kindergartens, primary and<br />
middle schools, and 60 m2 for<br />
high schools.<br />
Required ventilation rate for<br />
reducing the infection risk<br />
Since in the guidelines, the<br />
required ventilation rates were<br />
very variable between countries,<br />
room management generally<br />
Tab. 2 - Characteristics and ventilation rates for different educational stages according to<br />
the Italian standard (UNI 10339, 1995).<br />
<strong>GEOmedia</strong> n°3-<strong>2023</strong> 25
REPORT<br />
referred to existing standards.<br />
As this paper considers Italian<br />
classrooms, the required<br />
ventilation rates (Ǭreq, m 3 /s)<br />
provided by UNI 10339 (UNI<br />
10339, 1995) were assumed<br />
as reference values. Values<br />
reported for different types of<br />
classrooms are reported in Table<br />
2.<br />
Determination of the natural<br />
ventilation rate<br />
Natural ventilation is a<br />
function of different factors,<br />
such as the position and flow<br />
characteristics of the opening,<br />
the surface mean pressure<br />
coefficient distribution for the<br />
wind direction considered, and<br />
the internal and external air<br />
temperature (BS 5925, 1991).<br />
In the case of educational<br />
buildings, which are in most<br />
cases naturally ventilated,<br />
classrooms present openings<br />
on one side only. Since the<br />
aim of this work is to provide<br />
a simplified methodology<br />
that can be used by buildings<br />
managers to reduce the<br />
infection probability in<br />
classrooms, the effect of air<br />
infiltration and wind were<br />
neglected as a precaution.<br />
The first is because the air<br />
infiltration is a function of the<br />
buildings’ characteristics and<br />
cannot be generalized to every<br />
educational building, while the<br />
second is because the wind is<br />
variable and depends on the<br />
localization of the building<br />
and on weather conditions,<br />
which cannot be controlled in<br />
advance.<br />
Moreover, for precautionary<br />
reasons, the aim is to evaluate<br />
the most critical conditions<br />
that are represented by the<br />
absence of wind. The natural<br />
ventilation rate from window<br />
(ǬW, m3/s) was calculated<br />
for spaces with one opening<br />
on one wall only and due to<br />
temperature difference (BS<br />
5925, 1991):<br />
(1)<br />
where:<br />
C d<br />
is the discharge coefficient for<br />
the opening (n.d.),<br />
A is the equivalent area of the<br />
opening (m 2 ),<br />
ΔT is the indoor-outdoor<br />
temperature difference (K),<br />
g is the gravity acceleration (m/s 2 ),<br />
H is the vertical difference between<br />
the top and bottom edges of a<br />
rectangular opening (H),<br />
TM is the average of inside and<br />
outside temperatures (K).<br />
The discharge coefficient Cd<br />
depends on the pressure drop<br />
encountered by the air flow as<br />
it crosses the opening and it<br />
can quantify, other parameters<br />
being equal, the airflow<br />
efficiency of an opening. Table<br />
3 shows some typical discharge<br />
coefficients for windows under<br />
buoyancy-driven ventilation,<br />
which were obtained from a<br />
single width-to-height opening<br />
ratio (Brandan and Espinosa,<br />
2018).<br />
Calculation of the minimum<br />
time of window opening<br />
Knowing the Ǭreq value for<br />
ensuring adequate ventilation<br />
(from Table 2), and the ǬW<br />
value (from Equation 1, which<br />
requires knowledge of the<br />
environmental conditions, and<br />
the geometrical characteristics<br />
of the windows), it is possible<br />
to calculate the ratio<br />
R = Ǭreq / ǬW<br />
(2)<br />
If R >1, the ventilation<br />
flow rate Q is not sufficient<br />
to guarantee the required<br />
conditions and more indepth<br />
analyses should be<br />
conducted (e.g. evaluation<br />
of the contribution of the<br />
wind action). If R ≤1, fixing<br />
a reference time interval ∆τ<br />
(s), R can be used to suggest<br />
the minimum duration of<br />
the windows opening (τmin),<br />
according to the following<br />
equation<br />
τmin = R∙∆τ<br />
(3)<br />
In particular, ∆τ=3600 s (one<br />
hour) can be usually assumed<br />
as a reference time interval for<br />
educational buildings, as it is<br />
the minimum duration of a<br />
single lecture.<br />
Equation 3 gives the minimum<br />
window opening duration but<br />
Tab. 3 - Typical discharge coefficients for windows under buoyancy-driven ventilation (Brandan and Espinosa, 2018).<br />
26 <strong>GEOmedia</strong> n°3-<strong>2023</strong>
REPORT<br />
not its frequency. The windows<br />
opening could be continuous,<br />
for a time τmin, or it could be<br />
repeated (series of openings and<br />
subsequent closures, so that the<br />
sum of the times in which the<br />
windows are open is equal to<br />
τmin).<br />
A useful criterion for deciding<br />
the frequency of windows<br />
openings is to create cycles of<br />
opening and subsequent closing<br />
based on the complete exchange<br />
of the air volume. That is,<br />
the windows are opened and,<br />
once the volume of air in the<br />
classroom has been completely<br />
replaced, they are closed. It is<br />
then possible to calculate the<br />
number of times (n) that the<br />
window should be kept open<br />
in the reference time interval,<br />
and the duration of each single<br />
opening (τop), according to the<br />
following equations:<br />
τop = V/ǬW ; n = τmin/τop<br />
(4)<br />
where V is the room volume<br />
(m3). Obviously, the strategy<br />
described by equations 4 can be<br />
applied only if n>1.<br />
Results and discussion<br />
Effect of occupancy<br />
The number of people in a<br />
room affects the infection<br />
probability (Fantozzi et al.,<br />
2022). To study its impact on<br />
window opening time, typical<br />
characteristics of naturally<br />
ventilated classrooms were<br />
considered. Four windows,<br />
each 2.0 m x 2.2 m, with a<br />
total area of 10.6 m2 and<br />
a discharge coefficient of<br />
0.13 were assumed, to meet<br />
hygienic standards. The indoor<br />
temperature was set at 20°C<br />
for comfort, while the outdoor<br />
temperature was 10°C for<br />
comparison.<br />
Figure 1 shows the increase<br />
in window opening time<br />
Fig. 1 - Windows’ opening time to ensure the required ventilation rate as a function<br />
of the number of people. Legend: opening time for kindergartens (red line), elementary<br />
schools (blue line), middle schools (green line), and high schools (yellow line).<br />
based on the number of people<br />
and the educational stage.<br />
Ventilation rates, determined<br />
by standards (UNI 10339,<br />
1995), vary for different stages.<br />
Kindergarten requires 11-18<br />
minutes of opening per hour,<br />
elementary school 14-21<br />
minutes, middle school 16-27<br />
minutes, and high school 19-32<br />
minutes.<br />
The opening time significantly<br />
rises with the number of<br />
occupants, and for high<br />
schools, it can reach half of<br />
the class hour. This increase<br />
has implications for energy<br />
consumption and thermal<br />
discomfort, particularly for<br />
students close to windows<br />
experiencing cold air currents.<br />
Effect of window area and type<br />
Figure 2 demonstrates how<br />
window area and type directly<br />
influence the natural ventilation<br />
rate (ǬW) and subsequently<br />
the required opening time.<br />
To evaluate this effect across<br />
different educational stages,<br />
25 students in a room with an<br />
indoor temperature of 20°C<br />
and an outdoor temperature of<br />
10°C were considered. Standard<br />
windows, 1.2 m in length and<br />
2.2 m in height were used.<br />
For the window area (Figure 2,<br />
left), having only one window is<br />
insufficient to meet ventilation<br />
requirements, resulting in<br />
opening times exceeding 60<br />
minutes. Increasing the window<br />
area reduces the required<br />
opening time, reaching a<br />
minimum of 6 minutes for<br />
kindergartens. However,<br />
very large window areas are<br />
impractical for classrooms.<br />
For different window types<br />
Fig. 2 - Windows’ opening time to ensure the required ventilation rate as a function of the window<br />
area (left) and discharge coefficient (right). Legend: opening time for kindergartens (red line), elementary<br />
schools (blue line), middle schools (green line), and high schools (yellow line)<br />
<strong>GEOmedia</strong> n°3-<strong>2023</strong> 27
REPORT<br />
Fig. 3 - Windows’ opening time to ensure the required ventilation rate as a function of ΔT.<br />
Legend: opening time for kindergartens (red line), elementary schools (blue line), middle schools<br />
(green line), and high schools (yellow line).<br />
(Figure 2, right), increasing<br />
the discharge coefficient<br />
(Cd) significantly reduces the<br />
opening time, highlighting its<br />
importance on the ventilation<br />
rate. Although precise values of<br />
Cd can be obtained for specific<br />
cases, using recommended<br />
values in this study provides<br />
valuable information for<br />
building practitioners.<br />
Effect of temperature difference<br />
Figure 3 illustrates the<br />
investigation of temperature<br />
difference's impact on opening<br />
time. The ventilation rate<br />
was calculated for spaces with<br />
one opening on one wall, and<br />
the temperature difference<br />
plays a crucial role, especially<br />
in the absence of wind. The<br />
study assumed 25 people in<br />
the room, the same window<br />
characteristics as in the previous<br />
case (four windows 1.2 x 2.2<br />
m, Cd=0.13), and varied the<br />
outdoor temperature from 0°C<br />
to 19°C.<br />
The relationship between<br />
window opening time and<br />
temperature difference (ΔT) is<br />
shown as a curve in Figure 3: as<br />
ΔT increases, the opening time<br />
decreases. However, for low<br />
ΔT, the opening time exceeds<br />
one hour for middle and<br />
high schools, indicating that<br />
even keeping windows open<br />
throughout the lecture won't<br />
meet the required ventilation<br />
rate.<br />
The difference between indoor<br />
and outdoor temperatures is<br />
influenced by the climate zone,<br />
season, and indoor comfort<br />
requirements. Setting outdoor<br />
temperatures is not possible,<br />
and indoor conditions must<br />
remain within an acceptable<br />
range for comfort. Studies<br />
on adapting to the thermal<br />
environment during the<br />
pandemic period are needed<br />
to understand occupants'<br />
needs. Higher ΔT reduces<br />
opening time but may lead<br />
to discomfort and increased<br />
energy consumption, especially<br />
with high indoor-outdoor<br />
temperature differences.<br />
Conclusions<br />
During the COVID-19<br />
pandemic, the need to maintain<br />
indoor health was crucial.<br />
However, guidelines for<br />
naturally ventilated buildings<br />
lack precision in controlling<br />
ventilation rates. This study<br />
offers a method to determine<br />
window opening time and<br />
frequency based on window<br />
characteristics, indoor and<br />
outdoor conditions, and room<br />
occupancy. Different ventilation<br />
rates, aligned with national<br />
and international standards for<br />
building types or educational<br />
stages, were considered to<br />
reduce infection probability.<br />
The results show that opening<br />
time increases with room<br />
surface and occupancy, while it<br />
decreases with larger window<br />
areas and favourable discharge<br />
coefficients based on window<br />
types. In the absence of wind,<br />
opening time decreases as the<br />
indoor-outdoor temperature<br />
difference increases.<br />
Balancing increased ventilation<br />
rates with energy consumption<br />
control and ensuring comfort<br />
remains a crucial area<br />
for further investigation.<br />
Nonetheless, this study provides<br />
a useful tool to enhance<br />
indoor environmental quality,<br />
promoting healthier buildings<br />
not only during but also postpandemic<br />
periods, guiding<br />
building practitioners towards<br />
improved awareness of indoor<br />
health.<br />
28 <strong>GEOmedia</strong> n°3-<strong>2023</strong>
REPORT<br />
REFERENCES<br />
Awada, M. et al. (2021) ‘Ten questions<br />
concerning occupant health in<br />
buildings during normal operations<br />
and extreme events including the<br />
COVID-19 pandemic’, Building<br />
and Environment, 188, p. 107480.<br />
Available at: https://doi.org/10.1016/j.<br />
buildenv.2020.107480.<br />
Azuma, K. et al. (2020) ‘Environmental<br />
factors involved in SARS-CoV-2<br />
transmission: effect and role of indoor<br />
environmental quality in the strategy<br />
for COVID-19 infection control’,<br />
Environmental Health and Preventive<br />
Medicine, 25(1), p. 66. Available at:<br />
https://doi.org/10.1186/s12199-020-<br />
00904-2.<br />
Bluyssen, P.M. (2020) ‘Towards an<br />
integrated analysis of the indoor<br />
environmental factors and its effects<br />
on occupants’, Intelligent Buildings<br />
International, 12(3), pp. 199–207.<br />
Available at: https://doi.org/10.1080/17<br />
508975.2019.1599318.<br />
Brandan, M.A.M. and Espinosa, F.A.D.<br />
(2018) ‘Modelling natural ventilation in<br />
early and late design stages: developing<br />
the right simulation workflow with<br />
the right inputs’, in. 2018 Building<br />
Performance Analysis Conference and<br />
SimBuild co-organized by ASHRAE and<br />
IBPSA-USA, Chicago, USA, pp. 242–<br />
249. Available at: https://www.ashrae.<br />
org/File%20Library/Conferences/<br />
Specialty%20Conferences/2018%20<br />
Building%20Performance%20<br />
Analysis%20Conference%20and%20<br />
SimBuild/Papers/C034.pdf.<br />
BS 5925 (1991) Code of practice for<br />
ventilation principles and designing for<br />
natural ventilation.<br />
Dai, H. and Zhao, B. (2020)<br />
‘Association of the infection probability<br />
of COVID-19 with ventilation rates in<br />
confined spaces’, Building Simulation,<br />
13(6), pp. 1321–1327. Available at:<br />
https://doi.org/10.1007/s12273-020-<br />
0703-5.<br />
DM 18-12-1975 (1975) ‘Norme<br />
tecniche aggiornate relative all’edilizia<br />
scolastica, ivi compresi gli indici<br />
di funzionalità didattica, edilizia<br />
ed urbanistica, da osservarsi nella<br />
esecuzione di opere di edilizia<br />
scolastica’.<br />
ECDC (2020) ‘Heating, ventilation<br />
and air-conditioning systems in the<br />
context of COVID-19: first update’.<br />
Available at: https://www.ecdc.europa.<br />
eu/sites/default/files/documents/<br />
Heating-ventilation-air-conditioning-<br />
systems-in-the-context-of-COVID-19-<br />
first-update.pdf.<br />
Fantozzi, F. et al. (2022) ‘Monitoring<br />
CO2 concentration to control the<br />
infection probability due to airborne<br />
transmission in naturally ventilated<br />
university classrooms’, Architectural<br />
Science Review, pp. 1–13. Available at:<br />
https://doi.org/10.1080/00038628.202<br />
2.2080637.<br />
Hamner, L. et al. (2020) ‘High<br />
SARS-CoV-2 Attack Rate Following<br />
Exposure at a Choir Practice — Skagit<br />
County, Washington, March 2020’,<br />
Morbidity and Mortality Weekly Report,<br />
69(19), pp. 606–610. Available at:<br />
http://dx.doi.org/10.15585/mmwr.<br />
mm6919e6external icon.<br />
Li, Y. et al. (2020) ‘Evidence for<br />
probable aerosol transmission<br />
of SARS-CoV-2 in a poorly<br />
ventilated restaurant’, medRxiv, p.<br />
2020.04.16.20067728. Available at:<br />
https://doi.org/10.1101/2020.04.16.2<br />
0067728.<br />
Lipinski, T. et al. (2020) ‘Review of<br />
ventilation strategies to reduce the<br />
risk of disease transmission in high<br />
occupancy buildings’, International<br />
Journal of Thermofluids, 7–8, p.<br />
100045. Available at: https://doi.<br />
org/10.1016/j.ijft.2020.100045.<br />
Lu, J. et al. (2020) ‘COVID-19<br />
Outbreak Associated with Air<br />
Conditioning in Restaurant,<br />
Guangzhou, China, 2020’, Emerging<br />
Infectious Disease journal, 26(7),<br />
p. 1628. Available at: https://doi.<br />
org/10.3201/eid2607.200764.<br />
Morawska, L. et al. (2020) ‘How can<br />
airborne transmission of COVID-19<br />
indoors be minimised?’, Environment<br />
International, 142, p. 105832.<br />
Available at: https://doi.org/10.1016/j.<br />
envint.2020.105832.<br />
Noorimotlagh, Z. et al. (2021) ‘A<br />
systematic review of possible airborne<br />
transmission of the COVID-19 virus<br />
(SARS-CoV-2) in the indoor air<br />
environment’, Environmental Research,<br />
193, p. 110612. Available at: https://<br />
doi.org/10.1016/j.envres.2020.110612.<br />
Park, S.Y. et al. (2020) ‘Coronavirus<br />
Disease Outbreak in Call Center,<br />
South Korea’, Emerging Infectious<br />
Disease journal, 26(8), p. 1666.<br />
Available at: https://doi.org/10.3201/<br />
eid2608.201274.<br />
Peng, Z. and Jimenez, J.L. (2020)<br />
‘Exhaled CO2 as COVID-19 infection<br />
risk proxy for different indoor<br />
environments and activities’, medRxiv,<br />
p. 2020.09.09.20191676. Available at:<br />
https://doi.org/10.1101/2020.09.09.2<br />
0191676.<br />
UNI 10339 (1995) Impianti aeraulici<br />
al fini di benessere. Generalità,<br />
classificazione e requisiti. Regole per la<br />
richiesta d’offerta, l’offerta, l’ordine e la<br />
fornitura.<br />
Yao, M. et al. (2020) ‘On airborne<br />
transmission and control of<br />
SARS-Cov-2’, Science of The Total<br />
Environment, 731, p. 139178.<br />
Available at: https://doi.org/10.1016/j.<br />
scitotenv.2020.139178.<br />
KEYWORDS<br />
Indoor Air Quality; Natural ventilation;<br />
School buildings; CO-<br />
VID-19<br />
ABSTRACT<br />
The study presents a method to<br />
determine window opening time<br />
and frequency, considering window<br />
characteristics, indoor and outdoor<br />
conditions, and room occupancy.<br />
Results reveal that opening time<br />
correlates with room surface and<br />
occupancy but diminishes with larger<br />
window areas and favourable discharge<br />
coefficients based on window types.<br />
Additionally, in windless conditions,<br />
opening time decreases as the indooroutdoor<br />
temperature difference<br />
increases.<br />
AUTHOR<br />
Giulia Lamberti<br />
giulia.lamberti@phd.unipi.it<br />
Giacomo Salvadori<br />
giacomo.salvadori@unipi.it<br />
University of Pisa, School of Engineering,<br />
Largo Lucio Lazzarino 1, 56122<br />
Pisa, Italy<br />
<strong>GEOmedia</strong> n°3-<strong>2023</strong> 29
REPORT<br />
Building Energy resilience: the role of<br />
energy management systems, smart devices<br />
and optimal energy control techniques<br />
By G.Chantzis, A.M.Papadopoulos<br />
Energy Management Systems<br />
The first step on the road to<br />
energy resilience is the selection<br />
of the appropriate energy<br />
management system. There<br />
are two main types of energy<br />
management systems the Centralized<br />
Energy Management<br />
systems and the Decentralized<br />
Energy Management systems.<br />
The Centralized Energy Management<br />
systems present advantages<br />
considering economic and<br />
political aspects. They are also<br />
found to have better response<br />
during lockdown in urban areas<br />
and in islanding modes. Still,<br />
they come with low levels of<br />
flexibility and usually require<br />
high levels of organization to<br />
operate. On the other hand, the<br />
Decentralized Energy Management<br />
systems are characterized<br />
by increased flexibility and enhanced<br />
environmental management<br />
capabilities. They are also<br />
considered to respond better in<br />
areas with frequent extreme weather<br />
events. When permissible<br />
constraints allow, a centralized<br />
energy system is chosen to better<br />
deal with crisis scenarios,<br />
such as pandemic conditions.<br />
[1]<br />
Fig. 1 - Features and technologies of flexible and resilient buildings [1].<br />
This contribution<br />
describes the creation<br />
of a support system for<br />
the operational activities<br />
of detailed perimeter of<br />
wooded areas attacked by<br />
insects/pathogens and/or<br />
forest fires, by means of<br />
a SAPR (Airborne System<br />
with Remote Piloting) with<br />
definition of the trajectory<br />
in automation via real-time<br />
recognition assisted by<br />
an airborne sensor and<br />
satellite system.<br />
Flexible and resilient built environment<br />
Resilient buildings characteristics<br />
Resilient buildings have some<br />
special characteristics. They<br />
have installed HVAC systems<br />
that adapt to the needs of users<br />
and indoor and ambient conditions.<br />
They are capable of<br />
exploiting the streams of data<br />
flowing through them in real<br />
time. They are efficient, smart<br />
and flexible.<br />
A two-way communication<br />
between the grid and building-<br />
HVAC systems-occupants is<br />
established. They are ready for<br />
disruptions to power and water<br />
services (energy efficiency, energy<br />
and water harvesting). They<br />
manage use of services with the<br />
target of energy consumption,<br />
cost and CO2 emissions reduction,<br />
while at the same time<br />
maintaining comfort conditions.<br />
On the road to smart, flexible<br />
and resilient buildings there is<br />
a need of implementing smart<br />
metering, IOT and building<br />
automation and control technologies.<br />
Metering technologies<br />
will help harvesting historical<br />
weather, energy consumption<br />
and RES production data. Then<br />
those data are fed to the core<br />
IT modules that undertake to<br />
30 <strong>GEOmedia</strong> n°3-<strong>2023</strong>
REPORT<br />
utilize the historical data and to<br />
produce demand, production<br />
and weather forecasts. At the<br />
same time by utilizing data of<br />
energy prices or carbon dioxide<br />
intensity they manage to produce<br />
the optimal control strategy<br />
which will be applied to the building<br />
energy systems through<br />
the Building Automation Control<br />
system.<br />
Smart metering<br />
As we mentioned above, a vital<br />
step on the road to smart and<br />
resilient buildings is the collection<br />
of historical data. The data<br />
is collected by smart meters that<br />
are installed in the buildings<br />
and their systems.<br />
Energy metering solutions<br />
To receive data about energy<br />
consumption we use energy meters.<br />
There are DIN Rail energy<br />
meters can be installed in the<br />
electrical panels of buildings<br />
and can measure various parameters<br />
such as voltage, current,<br />
power and energy. Some meters<br />
such as pulse meters require also<br />
the installation of a pulse reader<br />
which is responsible for translating<br />
and sending the measured<br />
data via Wi-Fi or other communication<br />
protocols. Some meters<br />
of this type have the ability to<br />
measure multiple loads and<br />
multiple parameters. The communication<br />
and data sending<br />
methods vary (WIFI, Ethernet,<br />
GSM/GPRS, etc.). In addition,<br />
there are plug energy meters<br />
which can only measure plug<br />
loads and are non-configurable.<br />
Finally, there are central smart<br />
meters which most utilities<br />
plan to install in new but also<br />
existing electrical installations.<br />
Those meters are capable of<br />
measuring multiple electrical<br />
properties, support most communication<br />
protocols and have<br />
configurable parameters.<br />
Fig. 2 - Energy efficiency – Resilience Nexus [2].<br />
Fig. 3 - The roadmap to smart, flexible and resilient buildings [3].<br />
Fig. 4 - Energy metering solutions.<br />
Indoor conditions & Weather<br />
metering<br />
There are mainly two types of<br />
sensors for indoor environment,<br />
temperature sensors with probe<br />
(a) and indoor air quality sensors<br />
(b) which are capable of measuring<br />
multiple parameters (temperature,<br />
humidity, CO2, etc.).<br />
To harvest ambient weather<br />
data, smart weather stations are<br />
used (c). Measured parameters<br />
include wind direction and<br />
speed, outdoor temperature and<br />
humidity, rainfall, solar and UV<br />
radiation.<br />
<strong>GEOmedia</strong> n°3-<strong>2023</strong> 31
REPORT<br />
Fig. 5 - Indoor conditions and weather metering solutions.<br />
The sensors support sending<br />
the collected data, at a configurable<br />
frequency, through<br />
LORA, Bluetooth, Wi-Fi, etc.<br />
Special attention should be given<br />
while selecting the number<br />
and position of smart sensors<br />
to ensure proper HVAC operation,<br />
and indoor comfort.<br />
Control techniques<br />
There are two main types of<br />
control Rule-Based Control<br />
and Model Predictive control.<br />
Rule-Based Control is a heuristic<br />
technique that monitors the<br />
status of a parameter, for example<br />
temperature, and sets value<br />
limitations for it. The controlled<br />
system responds changing<br />
its function according to a predefined<br />
strategy [4], [5].<br />
Model Predictive Control is<br />
a more complex method. It<br />
requires modelling a building<br />
and forecasting its energy behavior.<br />
The most efficient energy<br />
management strategy, results<br />
from solving an optimization<br />
problem [4], [5].<br />
The existence of controllers installed<br />
in the energy system that<br />
we wish to control is required.<br />
The output of the control strategy<br />
is used as input of the controller.<br />
The final control is done<br />
through temperature or power<br />
regulation or by changing the<br />
operating profile of the system.<br />
Resilient building example<br />
The conservatory in Thessaloniki<br />
dates to the 1980’s. It was<br />
refurbished for climate adaptation,<br />
to deal mainly with increasing<br />
cooling demands in the<br />
summer and heating demands<br />
in the winter. The installed PVs<br />
contribute to further reduction<br />
of electricity consumption and<br />
CO2 emissions.<br />
Energy efficiency measures include:<br />
• External thermal insulation<br />
for heating loads reduction.<br />
• Installation of ventilated facades<br />
to further reduced energy<br />
consumption for heating, but<br />
mainly to reduce cooling loads.<br />
• Phase change materials in<br />
ventilated façade to further<br />
reduce electricity consumption<br />
for cooling.<br />
The contribution of photovoltaics<br />
was significant, covering<br />
up to 10% of total electricity<br />
consumption of the building.<br />
Temperature and air quality<br />
sensors are installed to monitor<br />
thermal comfort conditions.<br />
Sensors in the façade cavity<br />
Fig. 6 - The conservatory in Thessaloniki.<br />
Tab. 1 - Control types, sensors and measured data implementation.<br />
32 <strong>GEOmedia</strong> n°3-<strong>2023</strong>
Fig. 7 - Installation of temperature sensor probes inside the ventilated façade cavity.<br />
enable monitoring the thermal<br />
behavior of the facades and<br />
automation and control of the<br />
installed mechanical ventilation<br />
in the cavity.<br />
Figure 7 depicts the installation<br />
of sensors inside the<br />
façade cavity. The measured<br />
temperatures in each layer of<br />
the ventilated façade are shown<br />
in figure 8. The effect of the<br />
ventilated façade is evident for<br />
both the gypsum board and the<br />
PCM section. In the gypsum<br />
board section it is observed that<br />
for an external temperature of<br />
32°C the temperature inside<br />
the cavity reaches 30°C and the<br />
indoor temperature is kept at<br />
27°C. We notice that a significant<br />
improvement is achieved<br />
in the indoor conditions on a<br />
typical summer day, especially<br />
if we compare to the previous<br />
situation, where for an outdoor<br />
temperature of 30.5°C, the indoor<br />
temperature reaches 29°C.<br />
The PCM seems to further improve<br />
the situation since for an<br />
ambient temperature of 33°C<br />
the indoor temperature is kept<br />
at 26°C. Another measure to<br />
further improve the function of<br />
the ventilated façades is the installation<br />
of mechanical ventilation<br />
in some air cavities. Thus,<br />
some zones of natural and some<br />
zones of mechanical ventilation<br />
Fig. 8 - Temperature distribution of ventilated façade sections.<br />
Fig. 9 - Mechanical ventilation automation and control system.<br />
are created. The mechanical<br />
ventilation is controlled by automation<br />
and control systems<br />
illustrated in figure 9. The automation<br />
utilizes the measured<br />
temperature at various points<br />
of the façade and differentially<br />
controls the operation of the<br />
installed crossflow fans.<br />
In the case of ventilated facades,<br />
the short-term comparison of<br />
the results between natural and<br />
mechanical ventilation from the<br />
recorded temperature difference<br />
is relatively small. However mechanical<br />
ventilation was found<br />
to provide better temperature<br />
stabilization.<br />
The resilient building example<br />
is part of the project Intelligent
REPORT<br />
Facades for Nearly Zero<br />
Energy Buildings, co-financed<br />
by the European Union<br />
and Greek national funds<br />
through the action Competitiveness,<br />
Entrepreneurship<br />
and Innovation, under the<br />
call RESEARCH–CREA-<br />
TE-INNOVATE (project<br />
code:Τ1EDK-02045) [6].<br />
Project team of PEDL-<br />
AUTh:<br />
• Prof. Agis M. Papadopoulos<br />
• Dr. Effrosyni Giama, Mechanical<br />
Engineer, M.Sc.<br />
• Dr. Panagiota Antoniadou,<br />
Civil Engineer, M.Sc.<br />
• Dr. Elli Kyriaki, Mechanical<br />
Engineer<br />
• Maria Symeonidou, Mechanical<br />
Engineer, M.Sc.<br />
• Georgios Chantzis, Mechanical<br />
Engineer<br />
REFERENCES<br />
[1] A. Zafeiriou, G. Chantzis, and A. Papadopoulos, “COVID-19 Challenges,<br />
Opportunities - A Valuable Lesson for the Future Sustainable Development of<br />
Energy Management,” Chem. Eng. Trans., vol. 94, pp. 1201–1206, 2022, doi:<br />
10.3303/CET2294200.<br />
[2] “U.S. Department of Energy.” https://www.energy.gov/ (accessed Aug. 31,<br />
<strong>2023</strong>).<br />
[3] “Smart Energy Management — Core.” https://www.core-innovation.com/<br />
smart-energy-management (accessed Sep. 01, <strong>2023</strong>).<br />
[4] T. Q. Péan, J. Salom, and R. Costa-Castelló, “Review of control strategies for<br />
improving the energy flexibility provided by heat pump systems in buildings,”<br />
J. Process Control, pp. 35–49, 2019, doi: 10.1016/j.jprocont.2018.03.006.<br />
[5] J. Clauß, C. Finck, P. Vogler-Finck, and P. Beagon, “Control strategies for<br />
building energy systems to unlock demand side flexibility-A review.”<br />
[6] “IF-ZEB – Intelligent Facades for Nearly Zero Energy Buildings.” https://<br />
ifzeb.gr/ (accessed Sep. 01, <strong>2023</strong>).<br />
KEYWORDS<br />
Energy resilience; management systems; smart device; optimal energy<br />
control techniques<br />
ABSTRACT<br />
This contribution describes the creation of a support system for the operational<br />
activities of detailed perimeter of wooded areas attacked by insects/pathogens<br />
and/or forest fires, by means of a SAPR (Airborne System with Remote Piloting)<br />
with definition of the trajectory in automation via real-time recognition<br />
assisted by an airborne sensor and satellite system.<br />
AUTHOR<br />
A.M.Papadopoulos<br />
G.Chantzis<br />
chantzis@meng.auth.gr<br />
Process Equipment Design Laboratory, Dept. of Mechanical Engineering,<br />
Aristotle University of Thessaloniki<br />
GR-54124 Thessaloniki<br />
34 <strong>GEOmedia</strong> n°3-<strong>2023</strong>
SPACE<br />
Jamming against GNSS receivers:<br />
attacks and mitigation techniques<br />
by Marco Lisi<br />
Jamming interference to GNSS<br />
receivers is a growing threat as<br />
more systems and devices rely on<br />
GNSS for Positioning, Navigation,<br />
and timing (PNT). The European<br />
GNSS Agency (GSA today EAASA)<br />
estimated there were 6.4 billion<br />
GNSS-enabled devices in use<br />
worldwide in 2019, and forecasts<br />
this will rise to 9.5 billion by 2029 —<br />
equivalent to 1.1 devices for every<br />
person in the world.<br />
Figure 1: jamming of GPS signals detected by Hawkeye 360 satellite in Ukraine<br />
Many of GNSS<br />
receivers are used in<br />
safety-critical and<br />
liability-critical systems. In<br />
the US, 13 of the 16 sectors of<br />
critical national infrastructure<br />
rely on GNSS, according to<br />
the Department of Homeland<br />
Security. The more the world<br />
relies on GNSS, the greater<br />
the threat presented by RF<br />
interference — whether<br />
intentional GNSS frequency<br />
jamming by malicious<br />
or mischievous actors or<br />
unintentional interference from<br />
radio transmissions in bands<br />
close to the GNSS frequencies.<br />
The impact of jamming is<br />
being felt worldwide. In the<br />
maritime sector, jamming<br />
traced to the Syrian conflict<br />
has been disrupting shipping<br />
in the Eastern Mediterranean<br />
since 2018. In aviation, the<br />
number of reports of suspected<br />
GPS signal jamming made<br />
to NASA’s Aviation Safety<br />
Reporting System (ASRS) has<br />
been steadily rising. In road<br />
transport and logistics, illegal<br />
jammers are widely used to<br />
disrupt employer telematics, as<br />
well as for criminal activities.<br />
The war in Ukraine has<br />
shown in all its evidence that<br />
security concerns must be<br />
extended to all space assets,<br />
since cyberattacks, often<br />
combined with physical<br />
ones, target all digital<br />
infrastructures, on ground and<br />
in space, well knowing their<br />
interdependencies.<br />
As far as satellite positioning<br />
systems are concerned,<br />
European aviation authorities<br />
reported a sudden increase<br />
of interferences against GPS<br />
signals in places as far away as<br />
Finland, the Mediterranean<br />
and Iraq since Russia invaded<br />
Ukraine, forcing aircraft to<br />
reroute or change destination<br />
(Fig. 1).<br />
Definition and impact<br />
of GNSS jamming<br />
GNSS (Global Navigation<br />
Satellite System) jamming refers<br />
to intentional interference<br />
with the signals of satellite<br />
navigation systems like GPS<br />
(Global Positioning System)<br />
or Galileo. These jamming<br />
techniques aim to disrupt or<br />
disable the operation of GNSS<br />
receivers, preventing accurate<br />
positioning, navigation, and<br />
timing information.<br />
GNSS jamming can have<br />
various effects depending<br />
on the severity and duration<br />
of the interference. Some<br />
common effects include<br />
36 <strong>GEOmedia</strong> n°3-<strong>2023</strong>
SPACE<br />
degraded accuracy in<br />
positioning, navigation, and<br />
timing information, loss of<br />
signal lock or signal dropouts,<br />
incorrect positioning or velocity<br />
estimates, and increased<br />
vulnerability to spoofing<br />
attacks. These effects can impact<br />
critical infrastructure, such as<br />
aviation, maritime navigation,<br />
transportation systems, and<br />
military operations.<br />
The effectiveness of jamming<br />
signals can vary depending on<br />
factors such as the power level<br />
of the jammer, the proximity<br />
to the targeted GNSS receivers,<br />
and the specific techniques<br />
employed.<br />
Figure 2, however, gives an<br />
immediate feeling of how<br />
destructive jamming can be.<br />
A very simple and inexpensive<br />
jammer transmitting a tiny 10<br />
mW signal can cause the loss of<br />
the GPS L1 signal in receivers<br />
in a radius of 1 km and prevent<br />
its acquisition in a radius of 10<br />
km.<br />
GNSS Jamming Techniques<br />
Before addressing the various<br />
GNSS jamming techniques<br />
most adopted, it is worth<br />
looking at the present allocation<br />
of the RF spectrum to the main<br />
GNSS systems (fig.3)<br />
As state-of-the-art receivers,<br />
even for commercial and<br />
consumer applications (e.g.,<br />
smartphones), operates in dual<br />
frequency mode (e.g.: L1 and<br />
L2 for GPS) and even in multifrequency,<br />
multi-constellation<br />
mode, it is evident that to<br />
be effective a GNSS jammer<br />
should operate over a quite large<br />
spectrum, generating multiple<br />
interfering signals or, otherwise,<br />
very broadband signals.<br />
Depending on the<br />
sophistication of the jammer<br />
and its target receiver, various<br />
jamming techniques are<br />
adopted:<br />
Figure 2: Susceptibility to Interference/Jamming<br />
• Continuous Wave (CW)<br />
Jamming: this technique<br />
involves transmitting a<br />
continuous, high-power radio<br />
signal on the frequency band<br />
used by GNSS satellites. The<br />
jammer emits a powerful<br />
and persistent signal that<br />
can overpower the relatively<br />
weak GNSS signals, making<br />
it difficult for receivers to<br />
accurately acquire and track<br />
satellite signals;<br />
• Narrowband Jamming: in this<br />
technique, jammers transmit<br />
signals that occupy a narrow<br />
frequency band within the<br />
GNSS frequency range. The<br />
jammer's signal may have<br />
similar characteristics to the<br />
GNSS signals, making it harder<br />
for receivers to distinguish<br />
between the genuine satellite<br />
Figure 3: GNSS signals spectrum allocation<br />
signals and the jamming signals;<br />
• Pulsed Jamming, involving<br />
the transmission of<br />
intermittent bursts of jamming<br />
signals. These bursts can be<br />
synchronized with the GNSS<br />
signal structure, mimicking the<br />
normal GNSS transmissions;<br />
• Broadband Jamming:<br />
broadband jammers transmit a<br />
wide range of frequencies that<br />
encompass the GNSS frequency<br />
bands. These jammers can<br />
interfere with multiple GNSS<br />
systems simultaneously, such as<br />
GPS, GLONASS, Galileo, and<br />
BeiDou, increasing the chances<br />
of disrupting GNSS-based<br />
positioning and navigation.<br />
GNSS Jamming Devices<br />
GNSS jammers come in<br />
various forms, ranging from<br />
<strong>GEOmedia</strong> n°3-<strong>2023</strong> 37
SPACE<br />
Figure 4: Commercial GNSS (GPS) Jammers<br />
small portable devices to more<br />
powerful and sophisticated<br />
equipment. Portable jammers<br />
can have a limited range and<br />
may be used for personal<br />
privacy reasons or illicit<br />
activities. Higher-power<br />
jammers can cover larger areas<br />
and have a more significant<br />
impact on GNSS signals.<br />
There is a huge selection of<br />
commercial jammers available<br />
on the Internet for less than<br />
$100 (fig.4).<br />
What used to be expensive<br />
military technology a few<br />
decades ago is nowadays easily<br />
available, rather cheap, offthe-shelf<br />
products. Studies of<br />
many of these jammers have<br />
been performed, and they were<br />
categorized into the following<br />
three categories:<br />
a. Jammers that are designed to<br />
plug into a 12 Volt car cigarette<br />
lighter socket power supply<br />
outlet. This category of jammers<br />
usually has rather low transmit<br />
power(below 100 mW) and<br />
the possibility to connect an<br />
external antenna. An example of<br />
a jammer from this category is<br />
shown in Figure 5.<br />
b. Jammers that have an<br />
internal battery and an external<br />
antenna connected via an<br />
SMA connector. Some of these<br />
jammers transmit at both the<br />
L1 and L2 frequency bands and<br />
additional frequency bands for<br />
other types of communication<br />
(e.g. WiFi and GSM). The<br />
transmit power is up to 1 W.<br />
An example of a jammer in this<br />
category is shown in Figure 6.<br />
c. Jammers disguised as<br />
harmless electronic devices,<br />
such as cell phones. The<br />
jammers in this group have<br />
internal batteries but no<br />
possibility of connecting an<br />
external antenna. All jammers<br />
in this group transmit power<br />
in L1, L2, and additional<br />
frequency bands, with up to<br />
100 mW power.<br />
Commercially available<br />
jammers often transmit chirplike<br />
signals (i.e. frequency<br />
modulated continuous waves<br />
(FMCWs)) and operate across<br />
the band 1565-1585 MHz.<br />
The jammer changes frequency<br />
rapidly over time and<br />
sweeps across the frequency,<br />
overpowering the GNSS signal.<br />
The use of frequency sweeping<br />
means that a narrowband<br />
jammer can be used to<br />
overpower a frequency range<br />
which would otherwise have<br />
required a broadband jammer.<br />
In conclusion, a recent and<br />
more sophisticated approach to<br />
jamming, named systematic or<br />
systemic jamming, is presented.<br />
A systematic GNSS jammer<br />
refers to a jamming device<br />
designed and deployed with<br />
Figure 5: car GNSS jammer (10 US$ on eBay)<br />
Figure 6: dual frequency, medium power jammer<br />
38 <strong>GEOmedia</strong> n°3-<strong>2023</strong>
SPACE<br />
a methodical or organized<br />
approach to disrupt Global<br />
Navigation Satellite System<br />
(GNSS) signals intentionally.<br />
The concept of systematic<br />
jamming is the following:<br />
a simple jammer might<br />
be equipped with some<br />
information of the GNSS<br />
signals and can use this to<br />
perform more sophisticated<br />
jamming. For example, it is<br />
suggested that the jammer may<br />
be equipped with a simple<br />
low-cost commercial GNSS<br />
receiver, such that it would then<br />
have access to accurate position<br />
and time, and to satellite<br />
ephemerides.<br />
With some very basic<br />
integration of this information,<br />
it might be possible to trigger<br />
short and sparse bursts of<br />
interference at specific times,<br />
such as to deny GNSS to a<br />
nearby receiver, and to do so<br />
with a very low average power.<br />
In this manner, a receiver might<br />
be unable to: reliably detect that<br />
a jamming attack was ongoing;<br />
to effectively mitigate the<br />
jamming attack or to identify or<br />
localize the jamming source.<br />
Figure 7 shows a possible block<br />
diagram of a systemic GNSS<br />
receiver.<br />
Just for completeness, Figure<br />
8 shows some very high-power<br />
military jammers, like those<br />
utilized in these days in the<br />
Ukrainian war.<br />
Depending on the type and<br />
sophistication of the jammer<br />
equipment used, the effects of<br />
jamming on the GNSS receiver<br />
can be of basically three types:<br />
Figure 7: Systematic GNSS jammer<br />
precision (DOP) value (often<br />
lower-elevation signals are<br />
affected first);<br />
• Complete loss of tracking of<br />
GNSS signals and saturation of<br />
the receiver front end, meaning<br />
the receiver will need to reacquire<br />
the signals.<br />
GNSS Anti-Jamming<br />
Techniques<br />
To enhance the resilience<br />
of GNSS systems against<br />
jamming, researchers and<br />
engineers are developing antijamming<br />
techniques. These<br />
techniques include advanced<br />
signal processing algorithms,<br />
anti-spoofing techniques, secure<br />
signal authentication methods,<br />
and the use of more robust and<br />
interference-resistant receiver<br />
designs.<br />
Interferences that are sparse in<br />
the time or frequency domain<br />
are straightforward to mitigate:<br />
pulsed jammers can simply be<br />
blanked in the time domain,<br />
and stationary continuous<br />
wave (CW) jammers can<br />
be efficiently mitigated by<br />
applying a notch-filter.<br />
FMCW jammers (commonly<br />
perceived and referred to as<br />
chirps) are more difficult to<br />
mitigate, due to the constant<br />
transmission (i.e., no time<br />
domain blanking possible)<br />
and changing frequency (i.e.,<br />
notch filter must be adaptive<br />
if used). This leads to the high<br />
complexity of the interference<br />
mitigation implementation,<br />
with often only limited<br />
mitigation success.<br />
GNSS anti-jamming techniques<br />
can be broadly classified into<br />
pre-correlation and postcorrelation<br />
methods based on<br />
when they are applied in the<br />
signal processing chain of a<br />
GNSS receiver (figure 9).<br />
• No effect at all, if the jammer<br />
is out of range, or its centre<br />
frequency is not aligned with<br />
the target GNSS frequency;<br />
• Degradation of GNSS signals;<br />
as the carrier-to-noise (C/<br />
N0) ratio of received signals<br />
drops, affecting the dilution of<br />
Figure 8: Very High-Power, Military Vehicle-Mounted GPS Jammers<br />
<strong>GEOmedia</strong> n°3-<strong>2023</strong> 39
SPACE<br />
Figure 9: Categorization of anti-jam techniques<br />
Figure 10: Principle of Spatial Nulling and Beamforming<br />
Figure 11: GPS Controlled Reception Pattern Antennas (CRPAs) with Anti-Jamming Capabilities<br />
These techniques aim to<br />
mitigate the effects of jamming<br />
signals before or after the<br />
correlation process, which is the<br />
fundamental step in extracting<br />
timing and positioning<br />
information from the received<br />
GNSS signals.<br />
Pre-correlation techniques<br />
can be implemented either<br />
at Rf or at IF/baseband, after<br />
analog-to-digital conversion.<br />
Post-correlation techniques<br />
necessarily operate at baseband.<br />
Both pre-correlation at<br />
baseband and post-correlation<br />
level mitigation techniques<br />
require access to raw GNSS<br />
signals and unless you are a<br />
GNSS receiver developer this is<br />
almost impossible.<br />
Among the Pre-correlation<br />
techniques it is worth<br />
mentioning the Automatic<br />
Gain Control Technique and<br />
the Antenna Nulling and<br />
Beamforming.<br />
The first is a very simple frontend<br />
level technique, operating<br />
at RF, based on the Automatic<br />
Gain Control (AGC)(either<br />
built into the external LNA<br />
or derived from the following<br />
GNSS receiver, if available),<br />
where the gain of a receiving<br />
GNSS antenna is automatically<br />
adjusted to prevent stronger<br />
jamming signals to reach<br />
the receiver. This technique<br />
provides some protection<br />
against jamming but not the<br />
continued operation under<br />
persistent jamming.<br />
The Antenna Nulling method<br />
involves using an array of<br />
antennas to create nulls in the<br />
direction of jamming sources,<br />
reducing the strength of the<br />
interfering signals before they<br />
enter the correlation process.<br />
These antennas are named<br />
Adaptive Antenna Arrays.<br />
By adjusting the phase and<br />
amplitude of the antenna<br />
elements, the receiver can create<br />
40 <strong>GEOmedia</strong> n°3-<strong>2023</strong>
SPACE<br />
Figure 12: GPS Anti-Jamming Receiver (U-blox)<br />
Figure 13: effect of active notch filtering<br />
nulls in the direction of the<br />
jammer, reducing its impact<br />
on the received GNSS signals<br />
(Figure 10).<br />
In their practical and<br />
commercial implementation,<br />
nulling anti-jamming antennas<br />
are called Controlled Radiation<br />
Pattern Antennas (CRPA).<br />
CRPAs are widely used with<br />
digital beamforming techniques<br />
that quickly detect the jamming<br />
direction and nulls the<br />
reception in that direction to<br />
provide resilient anti-jamming<br />
capability to GNSS receivers.<br />
Figure 11 shows some<br />
commercially available CRPAs<br />
and their anti-jamming<br />
capabilities.<br />
Another pre-correlation<br />
technique widely adopted is<br />
based on active notch filtering.<br />
Notch filters can be configured<br />
in the receiver firmware or by<br />
the user to filter out signals in<br />
narrow frequency bands that are<br />
susceptible to interference.<br />
Figure 12 shows an<br />
implementation of active<br />
notch filtering in the form<br />
of digital filters for the “I”<br />
and “Q” components of the<br />
signal, before correlation and<br />
processing.<br />
Figure 13 shows the effect of<br />
digital notch filtering on the<br />
GNSS signal (GPS L2 in this<br />
case).<br />
KEYWORDS<br />
GNSS; jamming; anti-jamming<br />
ABSTRACT<br />
Attacks and mitigation techniques for the jamming<br />
against GNSS receivers are described according<br />
to the fact that many of GNSS receivers are<br />
used in safety-critical and liability-critical systems.<br />
AUTHOR<br />
Marco Lisi<br />
ingmarcolisi@gmail.com<br />
Member of the Italian Space Agency Board<br />
of Directors<br />
<strong>GEOmedia</strong> n°3-<strong>2023</strong> 41
MERCATO<br />
CONCLUSION OF REMOT PROJECT<br />
Over the last decades global navigation satellite systems<br />
(GNSS) seem to have infiltrated the everyday life<br />
of millions of people all over the world and stopped<br />
being something unusual. The satellite receivers can be<br />
found in most smartphones, smart watches and even<br />
key-holders. However, new GNSS applications are still<br />
being developed, and some of them touch scientific<br />
fields not directly related to navigation and geodesy.<br />
One of such fields is human motion science, a branch<br />
of biomechanics studying kinematics of human movement.<br />
There have been major advances in this sphere<br />
with the availability of modern equipment such as photometric<br />
motion capture systems. However, a precise<br />
and accurate recording using such systems needs a very<br />
strictly defined, highly deterministic environment.<br />
This can be provided in a laboratory, but what about<br />
studying motion of athletes who perform long-distance<br />
runs such as marathon or even a few kilometers? Even<br />
а relatively small stadium cannot be fully covered with<br />
a photometric system. But for sports scientists it is extremely<br />
relevant to study how the movement parameters<br />
of a runner (such as length, width and frequency<br />
of his steps) change over long periods of time. Is there<br />
a way to do it in the lab? Of course, you can put the<br />
subject on a treadmill or make him run in circles, but<br />
this will be quite different from an actual outdoor training.<br />
The only way to study this difference is to find a<br />
way to study track the movement of an athlete in a real<br />
out-of-the-lab environment.<br />
This summer REMOT (Real Environment MOtion<br />
Tracker), a project dedicated specifically to this problem,<br />
met its conclusion. Financed by EUSPA, it was<br />
conducted by two companies: Stonex, responsible for<br />
the hardware and firmware part, and Gter, responsible<br />
for the software and processing part.<br />
The main idea of the project was to use recording devices<br />
consisting of a GNSS receiver integrated with<br />
an IMU (inertial measurement unit). IMU provides a<br />
more frequent data but is highly subject to noise, drift,<br />
and error accumulation related to double integration.<br />
GNSS part generally has a lower frequency and precision,<br />
but it does not accumulate error. Hence, the<br />
combination of these two sensors allows to receive a<br />
more accurate solution.<br />
The sensor configuration includes only three devices:<br />
one on the head and two on the feet. That is a minimum<br />
number to get a precise estimation of step parameters.<br />
In principle, two sensors on the feet would be<br />
enough, but the satellite data they receive tend to be<br />
noisier, and in such cases the receiver on the head can<br />
be used to get a more precise solution using a movingbase<br />
approach (the head receiver is treated like a moving<br />
base station).<br />
The sensors are worn by the subject using a headband<br />
and shoelace clamps, so that they are firmly fixed to<br />
the corresponding body part. Oscillations and impacts<br />
can lead to higher levels of noise in the IMU, problems<br />
with receiving GNSS data and general incorrectness of<br />
the mathematical model which leads to a wrong output.<br />
Also it is preferred to choose areas with clear sky<br />
for recording: trees and tall buildings forming so-called<br />
"urban canyons" obstruct the satellite signals.<br />
After the recording has been completed, the data processing<br />
stage begins. First, the GNSS data is being processed<br />
to obtain a positioning solution. The approach<br />
used by default is PPK (post-processing kinematics)<br />
which uses the corrections from a fixed base station<br />
and allows to obtain centimeter precision solutions.<br />
Then the IMU processing is performed. While GNSS<br />
receivers have a frequency of 10 Hz, the IMUs work at<br />
100 Hz frequency, allowing to get a more continuous<br />
positioning sequence. The processing is done with the<br />
aid of a Kalman filter, which updates the IMU positioning<br />
with already processed GNSS data and resets the<br />
velocity to zero when a static phase is detected. This<br />
way the error accumulation is reduced.<br />
Once the positioning solution is obtained, the second<br />
processing stage starts to extract the step parameters<br />
from the recorded data. Using basic geometric models,<br />
the step length, width and heading are computed. The<br />
tests have been performed in different locations on several<br />
subjects with different walking speed.<br />
The results have been presented to a EUSPA commission<br />
which deemed the test results quite impressive and<br />
declared the project to be successfully concluded.<br />
Nonetheless, the work is far from being finished.<br />
Despite the system being working in general, there is<br />
still a huge field for improvements: from more advanced<br />
hardware to more sophisticated processing techniques<br />
and software architectures. The project has been<br />
noted by movement scientists who are already making<br />
plans about research possible with this equipment, and<br />
this is a key and motivation for further development.<br />
42 <strong>GEOmedia</strong> n°3-<strong>2023</strong>
VIDALASER:<br />
FOIF A90 BASE-ROVER-STATIC<br />
A90 FOIF is equipped with a 1048 channel GNSS card<br />
capable of receiving GPS, GLONASS, GALILEO,<br />
BEIDOU, SBAS, QZSS, L-BAND data which gives<br />
A90 a formidable FIX speed and measurement stability.<br />
The latest generation IMU unit is not subject to influences<br />
from metal objects or electromagnetic fields.<br />
All system components are supplied as standard to be<br />
able to use A90 as:<br />
ROVER connected to CORS networks via integrated<br />
and certified UMTS modem.<br />
BASE-ROVER with local connection via integrated<br />
and certified UHF RADIO.<br />
BASE-ROVER with integrated and certified UMTS<br />
telephone connection connection.<br />
STATIC with integrated 32Gb SD card.<br />
The IP67 controller with Android operating system<br />
with large 6' screen, touch screen with very high<br />
brightness and autonomy, 8MP camera and integrated<br />
GPS/Glonass/Galileo/Beidou L1 and totally multilingual<br />
SURPAD 4.2 software.<br />
The SURPAD 4.2 software with integrated CAD is a<br />
must see and try.<br />
This is the only way to understand how complete, powerful<br />
and precise it is.<br />
By contacting us, we can send you the version with a<br />
free 30-day demo license.<br />
SurPad 4.2 can be installed on any device running<br />
Android.<br />
VIDALASER has been the official importer and service<br />
provider of the FOIF Company since 2003 and<br />
guarantees technical assistance, spare parts and the official<br />
instrument repair service for all FOIF products<br />
in Italy.<br />
vidaLaser<br />
Vic. N. Tommaseo 3<br />
IT-20045 Lainate MI<br />
Tel.029371038<br />
Email info@vidalaser.com<br />
Skype VIDALASER<br />
Web www.vidalaser.com<br />
Use geodata to know your world<br />
We transform and publish data, metadata<br />
and services in conformance to INSPIRE<br />
We support Data Interoperability,<br />
Open Data, Hight Value Datasets,<br />
APIs, Location Intelligence, Data Spaces<br />
INSPIRE Helpdesk<br />
We support all INSPIRE implementers<br />
Epsilon Italia S.r.l.<br />
Viale della Concordia, 79<br />
87040 Mendicino (CS)<br />
Tel. (+39) 0984 631949<br />
info@epsilon-italia.it<br />
www.epsilon-italia.it
MERCATO<br />
NEW STONEX LIDAR SOLUTION<br />
Stonex's 3D product family expands and gains a LiDAR<br />
solution with top features.<br />
XFLY series integrates high performance Inertial<br />
Navigation System with camera and LiDAR for point<br />
cloud generation.<br />
Different customer’s need can be met by the choice of<br />
Hesai LiDAR XFLY120, XFLY300 or other sensors.<br />
The processing platform contains a Wi-Fi interface, an<br />
embedded cellular modem for RTCM corrections, data<br />
logging software and a gigabit Ethernet network.<br />
Equipped with a high-performance INS, it delivers clean<br />
point clouds even at high AGL.<br />
As a small, lightweight and low-power system, it allows<br />
the user to fly longer, adapting to the needs of any<br />
project.<br />
The post-processing software provides fully automatic<br />
point cloud generation.<br />
www.stonex.it<br />
GEOCHEMICAL AND ISOTOPIC TECHNI-<br />
QUES FOR MONITORING AIR, WATER AND<br />
SOIL QUALITY. TERRELOGICHE SOLU-<br />
TIONS FOR TRACKING AND QUANTIFICA-<br />
TION OF ANTHROPOGENIC IMPACTS<br />
TerreLogiche is an Italian company that provides hightech<br />
services and solutions for public administrations,<br />
research entities, firms and professionals in the fields<br />
of environmental monitoring, geographic information<br />
systems and professional and vocational training. Our<br />
staff has decades of experience in these areas including<br />
various publications in international scientific journals,<br />
as well as strong and long-lasting partnerships with the<br />
research world.<br />
In the field of environmental monitoring, TerreLogiche<br />
offers highly specialized services in the study of natural<br />
and anthropogenic processes that help determine the state<br />
of the environment in its different compartments: water,<br />
air and soil. The primary tasks concern the tracking<br />
and quantification of impacts resulting from anthropic<br />
activities (landfills, industrial activities, fuel spills, etc.)<br />
through geochemical and isotopic methodologies.<br />
Landfills and waste disposal plants are among the main<br />
areas of application of the detection and monitoring<br />
techniques offered by the company and on which it has<br />
a particular record of experience. TerreLogiche is in fact<br />
able to provide monitoring and control services on the<br />
main carriers of contamination of disposal plants, namely<br />
biogas and leachate.<br />
Biogas control is carried out by testing the exhalation<br />
diffused by the landfill covers with the accumulation<br />
chamber method and analyzing thermal images. The<br />
data collected is processed with geostatistical and statistical<br />
techniques in order to evaluate the efficiency of<br />
the capturing systems and identify anomalous degassing<br />
areas.<br />
Investigations to determine leachate contamination allow<br />
to identify and recognize the dispersion of contamination<br />
vectors on ground and surface water bodies.<br />
Specifically, TerreLogiche has developed a new method<br />
of analysis that uses the indications provided by stable<br />
and radiogenic isotopes naturally present in water.<br />
Among the markers used as tracers of leachate there is<br />
tritium. Due to its peculiar conservative characteristics,<br />
tritium offers the possibility of recognizing contamination<br />
from the earliest stages and especially at extremely<br />
low levels, otherwise not detectable by routine checkups<br />
imposed by recent legislation.<br />
In support of the activities in the field of environmental<br />
monitoring, TerreLogiche’s ICT sector has developed<br />
TL-Ambiens, a Decision Support web application<br />
for the storage, management and analysis of data from<br />
environmental monitoring operations. This application<br />
is specifically designed for importing huge amounts of<br />
multi-temporal data, and is the ideal software solution<br />
for those who need to produce and query particularly<br />
large environmental datasets. TL-Ambiens is capable of<br />
storing information about multiple environmental compartments.<br />
Integrated data analysis tools easily allow to<br />
query and filter data according on several parameters<br />
(eg. exceeding maximum levels, compartment, sampling<br />
campaign, date range, control spot, parameter and so<br />
on), to generate outputs both in graphical and tabular<br />
form and to obtain a numerical and graphical statistical<br />
summary of the data.<br />
Find out more about TerreLogiche’s activities in the environmental<br />
field: www.terrelogiche.com<br />
44 <strong>GEOmedia</strong> n°3-<strong>2023</strong>
MERCATO<br />
GISTAM<br />
2024<br />
10 th International Conference on Geographical Information<br />
Systems Theory, Applications and Management<br />
Angers, France<br />
2 - 4 May, 2024<br />
The International Conference on Geographical Information Systems Theory, Applications and Management aims at creating a<br />
meeting point of researchers and practitioners that address new challenges in geo-spatial data sensing, observation, representation,<br />
processing, visualization, sharing and managing, in all aspects concerning both information communication and technologies (ICT)<br />
as well as management information systems and knowledge-based systems. The conference welcomes original papers of either<br />
practical or theoretical nature, presenting research or applications, of specialized or interdisciplinary nature, addressing any aspect<br />
of geographic information systems and technologies.<br />
CONFERENCE AREAS<br />
Data Acquisition and Processing<br />
Domain Applications<br />
Interaction with Spatial-Temporal Information<br />
Spatial Data Mining<br />
Managing Spatial Data<br />
Modeling, Representation and Visualization<br />
Remote Sensing<br />
MORE INFORMATION AT: HTTPS://GISTAM.SCITEVENTS.ORG/<br />
UPCOMING SUBMISSION DEADLINES<br />
REGULAR PAPER SUBMISSION: DECEMBER 13, <strong>2023</strong><br />
POSITION PAPER SUBMISSION: JANUARY 25, 2024<br />
SPONSORED BY: LOCALLY ORGANIZED AND HOSTED BY: INSTICC IS MEMBER OF: LOGISTICS:<br />
PUBLICATIONS:<br />
IN COOPERATION WITH:<br />
PROCEEDINGS WILL BE SUBMITTED FOR INDEXATION BY:<br />
Scan and connect to:<br />
gistam.scitevents.org<br />
<strong>GEOmedia</strong> n°3-<strong>2023</strong> 45
AGENDA<br />
10-12 OTTOBRE <strong>2023</strong><br />
INTERGEO <strong>2023</strong><br />
Berlino (Germania)<br />
www.intergeo.de<br />
8 - 9 NOVEMBRE <strong>2023</strong><br />
Smart Geo Expo <strong>2023</strong><br />
Kintex (Corea)<br />
https://smartgeoexpo.kr/<br />
14-16 NOVEMBRE <strong>2023</strong><br />
TECHNOLOGYforALL<br />
<strong>2023</strong><br />
Rome (Italy)<br />
8–10 APRIL 2024<br />
Esri International<br />
Infrastructure Management<br />
and GIS Conference<br />
Frankfurt (Germany)<br />
www.esri.com<br />
JULY 15–19, 2024<br />
Esri User Conference<br />
San Diego (USA)<br />
www.esri.com<br />
2 – 4 MAY 2024<br />
GISTAM 2024 – 10th<br />
International Conference on<br />
Geographical Information<br />
Systems<br />
Angers (France)<br />
https://gistam.scitevents.org/<br />
2024<br />
FOSS4G<br />
Belem (Brasil)<br />
https://foss4g.org/<br />
14 – 15 DECEMBER <strong>2023</strong><br />
GEO-AI – Artificial<br />
Intelligence for Geospatial<br />
Data<br />
Torino (Italy)<br />
www.polito.it<br />
Roma<br />
NEW LEICA BLK360<br />
The all-new Leica BLK360 breaks open<br />
the possibilities of reality capture.<br />
With unprecedented, best-in-class scanning speed,<br />
the BLK360 makes you faster.<br />
◗ A supercharged next-gen imaging laser scanner, it captures<br />
a full scan with spherical images in only twenty seconds over<br />
five times faster than the BLK360 G1.<br />
◗ With fast and agile in-field workflows, along with live feedback<br />
on your mobile device, you can be absolutely sure you’ve captured<br />
everything you need. VIS technology automatically combines<br />
your scans to speed up your workflow and help you make sure<br />
your datasets are complete.<br />
◗ BLK360 data is highly valuable for so many uses - from AEC to VR.<br />
Easily transfer and work with data in your software ecosystem<br />
to create immersive and highly accurate deliverables.<br />
◗ You can also upload BLK360 data to HxDR, the Hexagon cloud-based<br />
data storage, visualization and collaboration platform.<br />
to know<br />
more<br />
Contact us to know more!<br />
Via A. Romilli, 20/8 - 20139 Milano • Tel. 02 5398739<br />
E-mail: teorema@geomatica.it<br />
www.geomatica.it • www.disto.it • www.termocamere.com
www.stonex.it<br />
SURVEYING<br />
THE WORLD<br />
COME SEE US:<br />
Hall 27<br />
Stand A27.27 / A27.28
High performance<br />
technologies<br />
Immagine: MTS Engineering<br />
Sale, rental, training,<br />
technical assistance<br />
Coastal and marine surveys<br />
Multibeams, SSS, SBP, magnetometers,<br />
marine drones …<br />
3D imaging<br />
terrestrial, underground, underwater,<br />
coastal and all of them integrated,<br />
even dynamic …<br />
Seismic monitoring<br />
seismometers, Strong Motion,<br />
Early Warning networks, tiltmeters …<br />
High precision positioning<br />
and navigation<br />
GNSS, IMU, underwater systems …<br />
Underground surveys<br />
GPR, seismographs, DC resistivity meters,<br />
inclinometers …<br />
CODEVINTEC<br />
Tecnologie per le Scienze della Terra e del Mare<br />
tel. +39 02 4830.2175 | info@codevintec.it | www.codevintec.it