THE ACCOUNTANT_AUTUMN_2018_VER-7-L

Create successful ePaper yourself
Turn your PDF publications into a flip-book with our unique Google optimized e-Paper software.
TECHNICAL<br />
see if our returns on Apple Corp stock (notice that<br />
I apply it on returns and not to prices) are roughly<br />
shaped in this manner.<br />
Using some Excel tricks that you will learn, you<br />
can see that the chart above could be called a distant<br />
cousin to the Normal Distribution (nothing will ever<br />
be perfectly Normal in practice) and, for the sake<br />
of this discussion, we can assume that our returns<br />
follow a Bell-Shaped curve with the peak being close<br />
to 0% daily returns (not a surprise here because in<br />
practice you should not expect any money within<br />
the very short period of a day). In practice there are<br />
various statistical tests that one can do but they are<br />
beyond the scope of this exercise.<br />
Relationships<br />
So now that we have assumed that our Apple returns<br />
follow a normal distribution with average daily<br />
return of 0% we can start thinking about doing some<br />
forecasting. Can we create a tool which accepts an<br />
input and gives us an output for expected return?<br />
The answer to this is “yes!” and the technique (that<br />
you will also learn in class) is called Regression.<br />
Before going into the details of what Regression<br />
is, I would like to discuss this question with you: Since<br />
Apple is a company that is part of the Tech industry,<br />
is it reasonable to think that what happens in the<br />
tech industry in general can have a major effect on<br />
Apple’s fortunes as a company? Intuitively we might<br />
think that the answer is “yes”. This is because every<br />
company out there is affected by both internal affairs<br />
(profitability, efficiency of personnel, technological<br />
breakthroughs, scandals and conflict etc) and also<br />
system-wide affairs (economy, inflation, tourism,<br />
media relations etc). It is, therefore, fair to ask by<br />
“how much” the Tech industry effects the fortunes<br />
of Apple. The Regression tool that you will learn in<br />
this course tackles exactly this problem. If some<br />
conditions on your data are satisfied (errors look like<br />
a bell-shaped graph etc) you can safely apply this tool<br />
and get some forecasts on future data points to a<br />
reasonable degree of accuracy.<br />
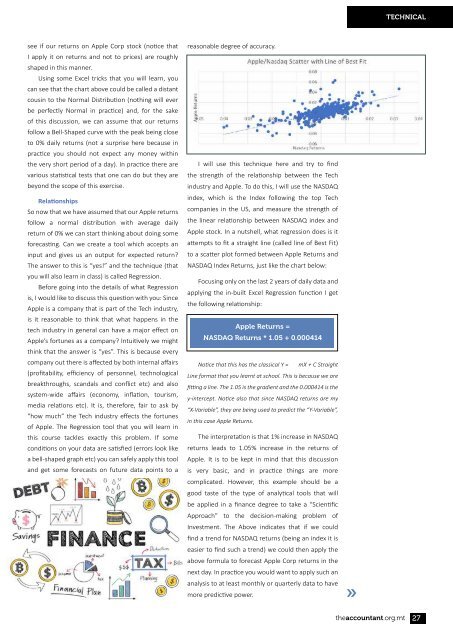
I will use this technique here and try to find<br />
the strength of the relationship between the Tech<br />
industry and Apple. To do this, I will use the NASDAQ<br />
index, which is the Index following the top Tech<br />
companies in the US, and measure the strength of<br />
the linear relationship between NASDAQ index and<br />
Apple stock. In a nutshell, what regression does is it<br />
attempts to fit a straight line (called line of Best Fit)<br />
to a scatter plot formed between Apple Returns and<br />
NASDAQ Index Returns, just like the chart below:<br />
Focusing only on the last 2 years of daily data and<br />
applying the in-built Excel Regression function I get<br />
the following relationship:<br />
Apple Returns =<br />
NASDAQ Returns * 1.05 + 0.000414<br />
Notice that this has the classical Y = mX + C Straight<br />
Line format that you learnt at school. This is because we are<br />
fitting a line. The 1.05 is the gradient and the 0.000414 is the<br />
y-intercept. Notice also that since NASDAQ returns are my<br />
“X-Variable”, they are being used to predict the “Y-Variable”,<br />
in this case Apple Returns.<br />
The interpretation is that 1% increase in NASDAQ<br />
returns leads to 1.05% increase in the returns of<br />
Apple. It is to be kept in mind that this discussion<br />
is very basic, and in practice things are more<br />
complicated. However, this example should be a<br />
good taste of the type of analytical tools that will<br />
be applied in a finance degree to take a “Scientific<br />
Approach” to the decision-making problem of<br />
Investment. The Above indicates that if we could<br />
find a trend for NASDAQ returns (being an index it is<br />
easier to find such a trend) we could then apply the<br />
above formula to forecast Apple Corp returns in the<br />
next day. In practice you would want to apply such an<br />
analysis to at least monthly or quarterly data to have<br />
more predictive power.<br />
theaccountant.org.mt<br />
27