The Economic Value of WTAMU Main Report
This report assesses the impact of West Texas A&M University (WTAMU) on the regional economy and the benefits generated by the university for students, taxpayers, and society. The results of this study show that WTAMU creates a positive net impact on the regional economy and generates a positive return on investment for students, taxpayers, and society.
This report assesses the impact of West Texas A&M University (WTAMU) on the regional economy and the benefits generated by the university for students, taxpayers, and society. The results of this study show that WTAMU creates a positive net impact on the regional economy and generates a positive return on investment for students, taxpayers, and society.

You also want an ePaper? Increase the reach of your titles
YUMPU automatically turns print PDFs into web optimized ePapers that Google loves.
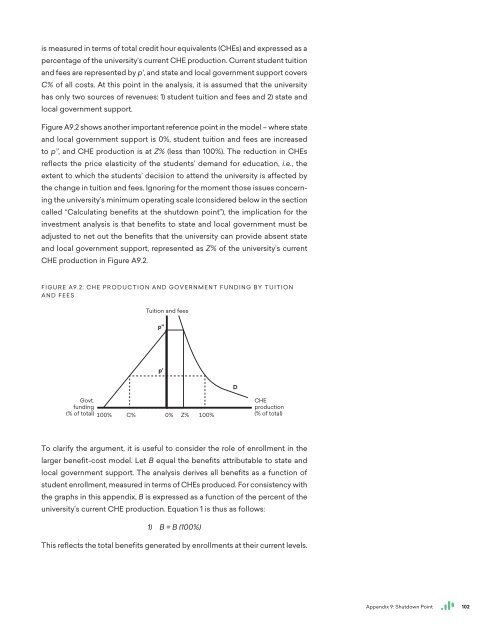
is measured in terms <strong>of</strong> total credit hour equivalents (CHEs) and expressed as a<br />
percentage <strong>of</strong> the university’s current CHE production. Current student tuition<br />
and fees are represented by p’, and state and local government support covers<br />
C% <strong>of</strong> all costs. At this point in the analysis, it is assumed that the university<br />
has only two sources <strong>of</strong> revenues: 1) student tuition and fees and 2) state and<br />
local government support.<br />
Figure A9.2 shows another important reference point in the model – where state<br />
and local government support is 0%, student tuition and fees are increased<br />
to p’’, and CHE production is at Z% (less than 100%). <strong>The</strong> reduction in CHEs<br />
reflects the price elasticity <strong>of</strong> the students’ demand for education, i.e., the<br />
extent to which the students’ decision to attend the university is affected by<br />
the change in tuition and fees. Ignoring for the moment those issues concerning<br />
the university’s minimum operating scale (considered below in the section<br />
called “Calculating benefits at the shutdown point”), the implication for the<br />
investment analysis is that benefits to state and local government must be<br />
adjusted to net out the benefits that the university can provide absent state<br />
and local government support, represented as Z% <strong>of</strong> the university’s current<br />
CHE production in Figure A9.2.<br />
FIGURE A9.2: CHE PRODUCTION AND GOVERNMENT FUNDING BY TUITION<br />
AND FEES<br />
Tuition and fees<br />
p"<br />
p'<br />
D<br />
Govt.<br />
funding<br />
(% <strong>of</strong> total)<br />
100% C% 0% Z% 100%<br />
CHE<br />
production<br />
(% <strong>of</strong> total)<br />
To clarify the argument, it is useful to consider the role <strong>of</strong> enrollment in the<br />
larger benefit-cost model. Let B equal the benefits attributable to state and<br />
local government support. <strong>The</strong> analysis derives all benefits as a function <strong>of</strong><br />
student enrollment, measured in terms <strong>of</strong> CHEs produced. For consistency with<br />
the graphs in this appendix, B is expressed as a function <strong>of</strong> the percent <strong>of</strong> the<br />
university’s current CHE production. Equation 1 is thus as follows:<br />
1) B = B (100%)<br />
This reflects the total benefits generated by enrollments at their current levels.<br />
Appendix 9: Shutdown Point<br />
102