The Economic Value of WTAMU Main Report
This report assesses the impact of West Texas A&M University (WTAMU) on the regional economy and the benefits generated by the university for students, taxpayers, and society. The results of this study show that WTAMU creates a positive net impact on the regional economy and generates a positive return on investment for students, taxpayers, and society.
This report assesses the impact of West Texas A&M University (WTAMU) on the regional economy and the benefits generated by the university for students, taxpayers, and society. The results of this study show that WTAMU creates a positive net impact on the regional economy and generates a positive return on investment for students, taxpayers, and society.

You also want an ePaper? Increase the reach of your titles
YUMPU automatically turns print PDFs into web optimized ePapers that Google loves.
to the earnings they would have received had they not chosen to attend the<br />
university. Both employment variables affect the investment analysis results<br />
from the student perspective.<br />
Students incur substantial expense by attending <strong>WTAMU</strong> because <strong>of</strong> the time<br />
they spend not gainfully employed. Some <strong>of</strong> that cost is recaptured if students<br />
remain partially (or fully) employed while attending. It is estimated that 60% <strong>of</strong><br />
students are employed. 44 This variable is tested in the sensitivity analysis by<br />
changing it first to 100% and then to 0%.<br />
<strong>The</strong> second student employment variable is more difficult to estimate. In this<br />
study we estimate that students who are working while attending the university<br />
earn only 69%, on average, <strong>of</strong> the earnings that they statistically would<br />
have received if not attending <strong>WTAMU</strong>. This suggests that many students<br />
hold part-time jobs that accommodate their <strong>WTAMU</strong> attendance, though it is<br />
at an additional cost in terms <strong>of</strong> receiving a wage that is less than what they<br />
otherwise might make. <strong>The</strong> 69% variable is an estimation based on the average<br />
hourly wages <strong>of</strong> the most common jobs held by students while attending<br />
college relative to the average hourly wages <strong>of</strong> all occupations in the U.S. <strong>The</strong><br />
model captures this difference in wages and counts it as part <strong>of</strong> the opportunity<br />
cost <strong>of</strong> time. As above, the 69% estimate is tested in the sensitivity analysis by<br />
changing it to 100% and then to 0%.<br />
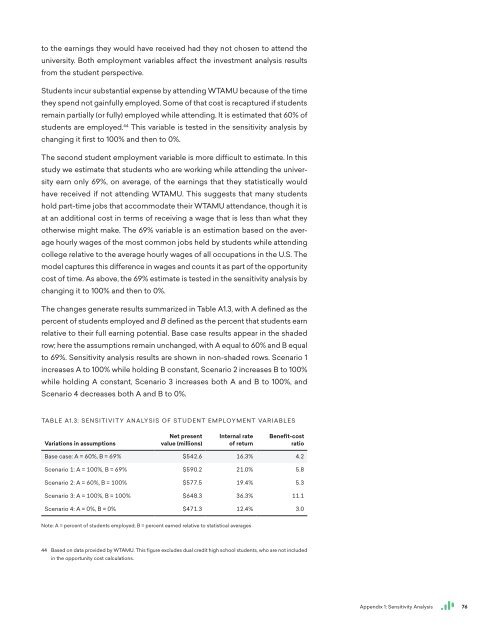
<strong>The</strong> changes generate results summarized in Table A1.3, with A defined as the<br />
percent <strong>of</strong> students employed and B defined as the percent that students earn<br />
relative to their full earning potential. Base case results appear in the shaded<br />
row; here the assumptions remain unchanged, with A equal to 60% and B equal<br />
to 69%. Sensitivity analysis results are shown in non-shaded rows. Scenario 1<br />
increases A to 100% while holding B constant, Scenario 2 increases B to 100%<br />
while holding A constant, Scenario 3 increases both A and B to 100%, and<br />
Scenario 4 decreases both A and B to 0%.<br />
TABLE A1.3: SENSITIVITY ANALYSIS OF STUDENT EMPLOYMENT VARIABLES<br />
Variations in assumptions<br />
Net present<br />
value (millions)<br />
Internal rate<br />
<strong>of</strong> return<br />
Benefit-cost<br />
ratio<br />
Base case: A = 60%, B = 69% $542.6 16.3% 4.2<br />
Scenario 1: A = 100%, B = 69% $590.2 21.0% 5.8<br />
Scenario 2: A = 60%, B = 100% $577.5 19.4% 5.3<br />
Scenario 3: A = 100%, B = 100% $648.3 36.3% 11.1<br />
Scenario 4: A = 0%, B = 0% $471.3 12.4% 3.0<br />
Note: A = percent <strong>of</strong> students employed; B = percent earned relative to statistical averages<br />
44 Based on data provided by <strong>WTAMU</strong>. This figure excludes dual credit high school students, who are not included<br />
in the opportunity cost calculations.<br />
Appendix 1: Sensitivity Analysis<br />
76