The Economic Value of WTAMU Main Report
This report assesses the impact of West Texas A&M University (WTAMU) on the regional economy and the benefits generated by the university for students, taxpayers, and society. The results of this study show that WTAMU creates a positive net impact on the regional economy and generates a positive return on investment for students, taxpayers, and society.
This report assesses the impact of West Texas A&M University (WTAMU) on the regional economy and the benefits generated by the university for students, taxpayers, and society. The results of this study show that WTAMU creates a positive net impact on the regional economy and generates a positive return on investment for students, taxpayers, and society.

You also want an ePaper? Increase the reach of your titles
YUMPU automatically turns print PDFs into web optimized ePapers that Google loves.
that generate social savings, also known as external or<br />
incidental benefits <strong>of</strong> education. <strong>The</strong>se represent the<br />
avoided costs to the government that otherwise would<br />
have been drawn from public resources absent the<br />
education provided by <strong>WTAMU</strong>. Government savings<br />
appear in Figure 3.2 and Table 3.3 and break down into<br />
three main categories: 1) health savings, 2) crime savings,<br />
and 3) income assistance savings. Health savings include<br />
avoided medical costs that would have otherwise been<br />
covered by state and local government. Crime savings<br />
consist <strong>of</strong> avoided costs to the justice system (i.e., police<br />
protection, judicial and legal, and corrections). Income<br />
assistance benefits comprise avoided costs due to the reduced number <strong>of</strong><br />
welfare and unemployment insurance claims.<br />
In addition to the creation <strong>of</strong> higher<br />
tax revenues to the state and local<br />
government, education is statistically<br />
associated with a variety <strong>of</strong> lifestyle<br />
changes that generate social savings.<br />
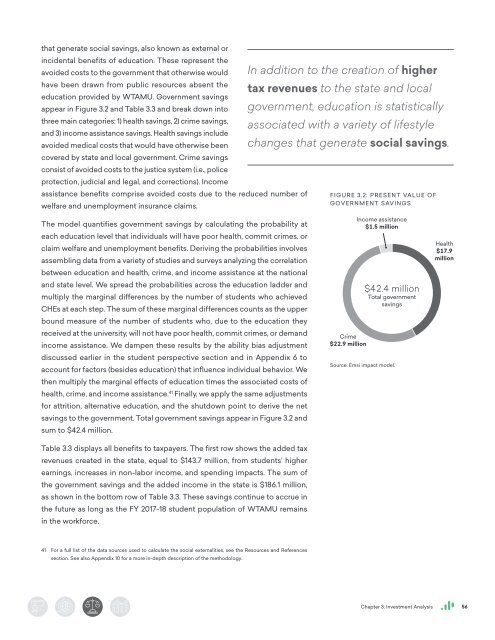
FIGURE 3.2: PRESENT VALUE OF<br />
GOVERNMENT SAVINGS<br />
<strong>The</strong> model quantifies government savings by calculating the probability at<br />
each education level that individuals will have poor health, commit crimes, or<br />
claim welfare and unemployment benefits. Deriving the probabilities involves<br />
assembling data from a variety <strong>of</strong> studies and surveys analyzing the correlation<br />
between education and health, crime, and income assistance at the national<br />
and state level. We spread the probabilities across the education ladder and<br />
multiply the marginal differences by the number <strong>of</strong> students who achieved<br />
CHEs at each step. <strong>The</strong> sum <strong>of</strong> these marginal differences counts as the upper<br />
bound measure <strong>of</strong> the number <strong>of</strong> students who, due to the education they<br />
received at the university, will not have poor health, commit crimes, or demand<br />
income assistance. We dampen these results by the ability bias adjustment<br />
discussed earlier in the student perspective section and in Appendix 6 to<br />
account for factors (besides education) that influence individual behavior. We<br />
then multiply the marginal effects <strong>of</strong> education times the associated costs <strong>of</strong><br />
health, crime, and income assistance. 41 Finally, we apply the same adjustments<br />
for attrition, alternative education, and the shutdown point to derive the net<br />
savings to the government. Total government savings appear in Figure 3.2 and<br />
sum to $42.4 million.<br />
42+54+4+R<br />
Crime<br />
$22.9 million<br />
Income assistance<br />
$1.5 million<br />
$42.4 million<br />
Total government<br />
savings<br />
Source: Emsi impact model.<br />
Health<br />
$17.9<br />
million<br />
Table 3.3 displays all benefits to taxpayers. <strong>The</strong> first row shows the added tax<br />
revenues created in the state, equal to $143.7 million, from students’ higher<br />
earnings, increases in non-labor income, and spending impacts. <strong>The</strong> sum <strong>of</strong><br />
the government savings and the added income in the state is $186.1 million,<br />
as shown in the bottom row <strong>of</strong> Table 3.3. <strong>The</strong>se savings continue to accrue in<br />
the future as long as the FY 2017-18 student population <strong>of</strong> <strong>WTAMU</strong> remains<br />
in the workforce.<br />
41 For a full list <strong>of</strong> the data sources used to calculate the social externalities, see the Resources and References<br />
section. See also Appendix 10 for a more in-depth description <strong>of</strong> the methodology.<br />
Chapter 3: Investment Analysis 56