The Economic Value of WTAMU Main Report
This report assesses the impact of West Texas A&M University (WTAMU) on the regional economy and the benefits generated by the university for students, taxpayers, and society. The results of this study show that WTAMU creates a positive net impact on the regional economy and generates a positive return on investment for students, taxpayers, and society.
This report assesses the impact of West Texas A&M University (WTAMU) on the regional economy and the benefits generated by the university for students, taxpayers, and society. The results of this study show that WTAMU creates a positive net impact on the regional economy and generates a positive return on investment for students, taxpayers, and society.

You also want an ePaper? Increase the reach of your titles
YUMPU automatically turns print PDFs into web optimized ePapers that Google loves.
<strong>The</strong> Centers for Disease Control and Prevention (CDC) reports the percentage<br />
<strong>of</strong> adults who are current smokers by state. 55 We use this information to create<br />
an index value by which we adjust the national prevalence data on smoking to<br />
each state. For example, 14.3% <strong>of</strong> Texas adults were smokers in 2016, relative to<br />
15.5% for the nation. We thus apply a scalar <strong>of</strong> 0.92 to the national probabilities<br />
<strong>of</strong> smoking in order to adjust them to the state <strong>of</strong> Texas.<br />
ALCOHOL DEPENDENCE<br />
Although alcohol dependence has large public and private costs, it is difficult<br />
to measure and define. <strong>The</strong>re are many patterns <strong>of</strong> drinking, ranging from abstinence<br />
to heavy drinking. Alcohol abuse is riddled with social costs, including<br />
health care expenditures for treatment, prevention, and support; workplace<br />
losses due to reduced worker productivity; and other effects.<br />
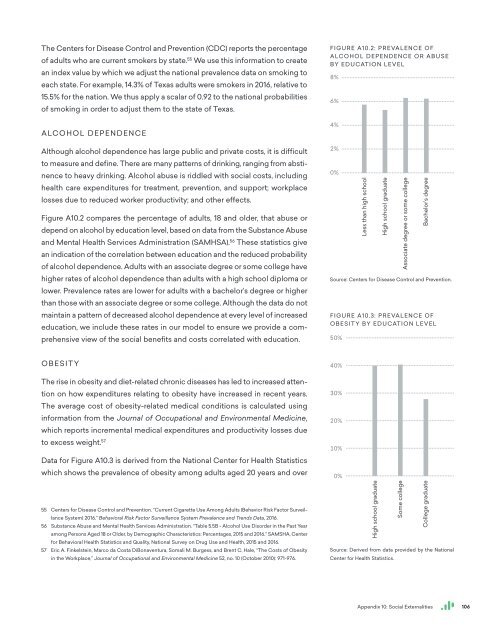
Figure A10.2 compares the percentage <strong>of</strong> adults, 18 and older, that abuse or<br />
depend on alcohol by education level, based on data from the Substance Abuse<br />
and Mental Health Services Administration (SAMHSA). 56 <strong>The</strong>se statistics give<br />
an indication <strong>of</strong> the correlation between education and the reduced probability<br />
<strong>of</strong> alcohol dependence. Adults with an associate degree or some college have<br />
higher rates <strong>of</strong> alcohol dependence than adults with a high school diploma or<br />
lower. Prevalence rates are lower for adults with a bachelor’s degree or higher<br />
than those with an associate degree or some college. Although the data do not<br />
maintain a pattern <strong>of</strong> decreased alcohol dependence at every level <strong>of</strong> increased<br />
education, we include these rates in our model to ensure we provide a comprehensive<br />
view <strong>of</strong> the social benefits and costs correlated with education.<br />
FIGURE A10.2: PREVALENCE OF<br />
ALCOHOL DEPENDENCE OR ABUSE<br />
BY EDUCATION LEVEL<br />
8%<br />
6%<br />
4%<br />
2%<br />
0%<br />
Source: Centers for Disease Control and Prevention.<br />
FIGURE A10.3: PREVALENCE OF<br />
OBESITY BY EDUCATION LEVEL<br />
50%<br />
91+84+100+99<br />
Less than high school<br />
High school graduate<br />
Associate degree or some college<br />
Bachelor’s degree<br />
OBESITY<br />
<strong>The</strong> rise in obesity and diet-related chronic diseases has led to increased attention<br />
on how expenditures relating to obesity have increased in recent years.<br />
<strong>The</strong> average cost <strong>of</strong> obesity-related medical conditions is calculated using<br />
information from the Journal <strong>of</strong> Occupational and Environmental Medicine,<br />
which reports incremental medical expenditures and productivity losses due<br />
to excess weight. 57<br />
Data for Figure A10.3 is derived from the National Center for Health Statistics<br />
which shows the prevalence <strong>of</strong> obesity among adults aged 20 years and over<br />
55 Centers for Disease Control and Prevention. “Current Cigarette Use Among Adults (Behavior Risk Factor Surveillance<br />
System) 2016.” Behavioral Risk Factor Surveillance System Prevalence and Trends Data, 2016.<br />
56 Substance Abuse and Mental Health Services Administration. “Table 5.5B - Alcohol Use Disorder in the Past Year<br />
among Persons Aged 18 or Older, by Demographic Characteristics: Percentages, 2015 and 2016.” SAMSHA, Center<br />
for Behavioral Health Statistics and Quality, National Survey on Drug Use and Health, 2015 and 2016.<br />
57 Eric A. Finkelstein, Marco da Costa DiBonaventura, Somali M. Burgess, and Brent C. Hale, “<strong>The</strong> Costs <strong>of</strong> Obesity<br />
in the Workplace,” Journal <strong>of</strong> Occupational and Environmental Medicine 52, no. 10 (October 2010): 971-976.<br />
40%<br />
30%<br />
20%<br />
10%<br />
0%<br />
99+100+69<br />
High school graduate<br />
Some college<br />
College graduate<br />
Source: Derived from data provided by the National<br />
Center for Health Statistics.<br />
Appendix 10: Social Externalities<br />
106