The Economic Value of WTAMU Main Report
This report assesses the impact of West Texas A&M University (WTAMU) on the regional economy and the benefits generated by the university for students, taxpayers, and society. The results of this study show that WTAMU creates a positive net impact on the regional economy and generates a positive return on investment for students, taxpayers, and society.
This report assesses the impact of West Texas A&M University (WTAMU) on the regional economy and the benefits generated by the university for students, taxpayers, and society. The results of this study show that WTAMU creates a positive net impact on the regional economy and generates a positive return on investment for students, taxpayers, and society.

Create successful ePaper yourself
Turn your PDF publications into a flip-book with our unique Google optimized e-Paper software.
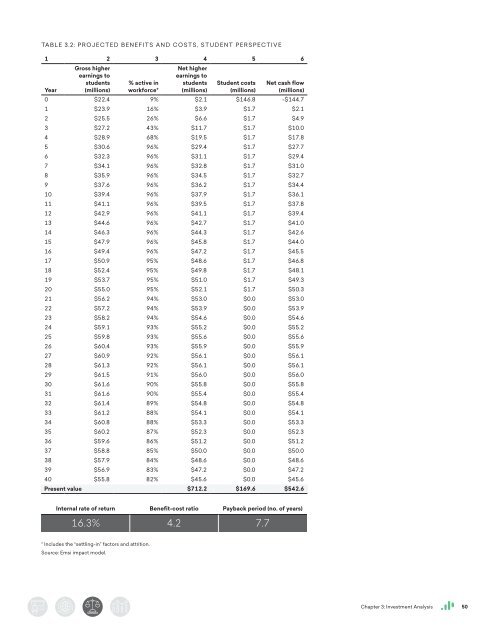
TABLE 3.2: PROJECTED BENEFITS AND COSTS, STUDENT PERSPECTIVE<br />
1 2 3 4 5 6<br />
Year<br />
Gross higher<br />
earnings to<br />
students<br />
(millions)<br />
% active in<br />
workforce*<br />
Net higher<br />
earnings to<br />
students<br />
(millions)<br />
Student costs<br />
(millions)<br />
Net cash flow<br />
(millions)<br />
0 $22.4 9% $2.1 $146.8 -$144.7<br />
1 $23.9 16% $3.9 $1.7 $2.1<br />
2 $25.5 26% $6.6 $1.7 $4.9<br />
3 $27.2 43% $11.7 $1.7 $10.0<br />
4 $28.9 68% $19.5 $1.7 $17.8<br />
5 $30.6 96% $29.4 $1.7 $27.7<br />
6 $32.3 96% $31.1 $1.7 $29.4<br />
7 $34.1 96% $32.8 $1.7 $31.0<br />
8 $35.9 96% $34.5 $1.7 $32.7<br />
9 $37.6 96% $36.2 $1.7 $34.4<br />
10 $39.4 96% $37.9 $1.7 $36.1<br />
11 $41.1 96% $39.5 $1.7 $37.8<br />
12 $42.9 96% $41.1 $1.7 $39.4<br />
13 $44.6 96% $42.7 $1.7 $41.0<br />
14 $46.3 96% $44.3 $1.7 $42.6<br />
15 $47.9 96% $45.8 $1.7 $44.0<br />
16 $49.4 96% $47.2 $1.7 $45.5<br />
17 $50.9 95% $48.6 $1.7 $46.8<br />
18 $52.4 95% $49.8 $1.7 $48.1<br />
19 $53.7 95% $51.0 $1.7 $49.3<br />
20 $55.0 95% $52.1 $1.7 $50.3<br />
21 $56.2 94% $53.0 $0.0 $53.0<br />
22 $57.2 94% $53.9 $0.0 $53.9<br />
23 $58.2 94% $54.6 $0.0 $54.6<br />
24 $59.1 93% $55.2 $0.0 $55.2<br />
25 $59.8 93% $55.6 $0.0 $55.6<br />
26 $60.4 93% $55.9 $0.0 $55.9<br />
27 $60.9 92% $56.1 $0.0 $56.1<br />
28 $61.3 92% $56.1 $0.0 $56.1<br />
29 $61.5 91% $56.0 $0.0 $56.0<br />
30 $61.6 90% $55.8 $0.0 $55.8<br />
31 $61.6 90% $55.4 $0.0 $55.4<br />
32 $61.4 89% $54.8 $0.0 $54.8<br />
33 $61.2 88% $54.1 $0.0 $54.1<br />
34 $60.8 88% $53.3 $0.0 $53.3<br />
35 $60.2 87% $52.3 $0.0 $52.3<br />
36 $59.6 86% $51.2 $0.0 $51.2<br />
37 $58.8 85% $50.0 $0.0 $50.0<br />
38 $57.9 84% $48.6 $0.0 $48.6<br />
39 $56.9 83% $47.2 $0.0 $47.2<br />
40 $55.8 82% $45.6 $0.0 $45.6<br />
Present value $712.2 $169.6 $542.6<br />
Internal rate <strong>of</strong> return Benefit-cost ratio Payback period (no. <strong>of</strong> years)<br />
16.3% 4.2 7.7<br />
* Includes the “settling-in” factors and attrition.<br />
Source: Emsi impact model.<br />
Chapter 3: Investment Analysis 50