The Economic Value of WTAMU Main Report
This report assesses the impact of West Texas A&M University (WTAMU) on the regional economy and the benefits generated by the university for students, taxpayers, and society. The results of this study show that WTAMU creates a positive net impact on the regional economy and generates a positive return on investment for students, taxpayers, and society.
This report assesses the impact of West Texas A&M University (WTAMU) on the regional economy and the benefits generated by the university for students, taxpayers, and society. The results of this study show that WTAMU creates a positive net impact on the regional economy and generates a positive return on investment for students, taxpayers, and society.

Create successful ePaper yourself
Turn your PDF publications into a flip-book with our unique Google optimized e-Paper software.
economics. Those critical <strong>of</strong> the Mincer function point to several unobserved<br />
factors such as ability, socioeconomic status, and family background that also<br />
help explain higher earnings. Failure to account for these factors results in what<br />
is known as an “ability bias.” Research by Card (1999 and 2001) suggests that<br />
the benefits estimated using Mincer’s function are biased upwards by 10% or<br />
less. As such, we reduce the estimated benefits by 10%. We use state-specific<br />
and education level-specific Mincer coefficients.<br />
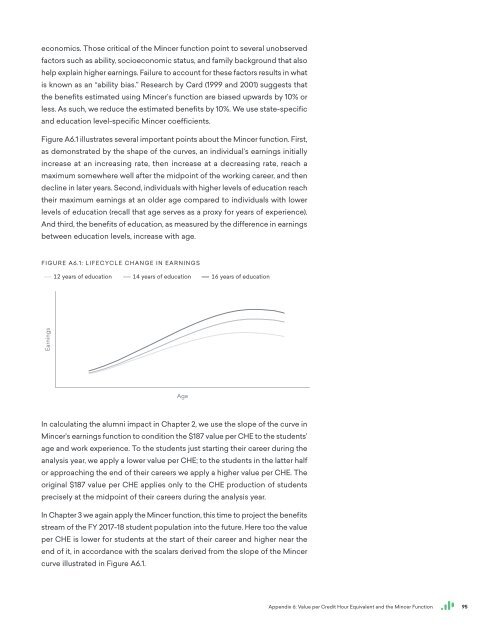
Figure A6.1 illustrates several important points about the Mincer function. First,<br />
as demonstrated by the shape <strong>of</strong> the curves, an individual’s earnings initially<br />
increase at an increasing rate, then increase at a decreasing rate, reach a<br />
maximum somewhere well after the midpoint <strong>of</strong> the working career, and then<br />
decline in later years. Second, individuals with higher levels <strong>of</strong> education reach<br />
their maximum earnings at an older age compared to individuals with lower<br />
levels <strong>of</strong> education (recall that age serves as a proxy for years <strong>of</strong> experience).<br />
And third, the benefits <strong>of</strong> education, as measured by the difference in earnings<br />
between education levels, increase with age.<br />
FIGURE A6.1: LIFECYCLE CHANGE IN EARNINGS<br />
12 years <strong>of</strong> education 14 years <strong>of</strong> education 16 years <strong>of</strong> education<br />
Earnings<br />
Age<br />
In calculating the alumni impact in Chapter 2, we use the slope <strong>of</strong> the curve in<br />
Mincer’s earnings function to condition the $187 value per CHE to the students’<br />
age and work experience. To the students just starting their career during the<br />
analysis year, we apply a lower value per CHE; to the students in the latter half<br />
or approaching the end <strong>of</strong> their careers we apply a higher value per CHE. <strong>The</strong><br />
original $187 value per CHE applies only to the CHE production <strong>of</strong> students<br />
precisely at the midpoint <strong>of</strong> their careers during the analysis year.<br />
In Chapter 3 we again apply the Mincer function, this time to project the benefits<br />
stream <strong>of</strong> the FY 2017-18 student population into the future. Here too the value<br />
per CHE is lower for students at the start <strong>of</strong> their career and higher near the<br />
end <strong>of</strong> it, in accordance with the scalars derived from the slope <strong>of</strong> the Mincer<br />
curve illustrated in Figure A6.1.<br />
Appendix 6: <strong>Value</strong> per Credit Hour Equivalent and the Mincer Function<br />
95