The Economic Value of WTAMU Main Report
This report assesses the impact of West Texas A&M University (WTAMU) on the regional economy and the benefits generated by the university for students, taxpayers, and society. The results of this study show that WTAMU creates a positive net impact on the regional economy and generates a positive return on investment for students, taxpayers, and society.
This report assesses the impact of West Texas A&M University (WTAMU) on the regional economy and the benefits generated by the university for students, taxpayers, and society. The results of this study show that WTAMU creates a positive net impact on the regional economy and generates a positive return on investment for students, taxpayers, and society.

Create successful ePaper yourself
Turn your PDF publications into a flip-book with our unique Google optimized e-Paper software.
students attending <strong>WTAMU</strong>, broken out by educational achievement. In total,<br />
students completed 225,982 CHEs during the analysis year, excluding personal<br />
enrichment students. We map each <strong>of</strong> these CHEs to the education ladder<br />
depending on the students’ education level and the average number <strong>of</strong> CHEs<br />
they completed during the year. For example, bachelor’s degree graduates<br />
are allocated to the stage between the associate degree and the bachelor’s<br />
degree, and the average number <strong>of</strong> CHEs they completed informs the shape<br />
<strong>of</strong> the distribution curve used to spread out their total CHE production within<br />
that stage <strong>of</strong> the progression.<br />
<strong>The</strong> sum product <strong>of</strong> the CHEs earned at each step within the education ladder<br />
and their corresponding value yields the students’ aggregate annual increase<br />
in income (∆E), as shown in the following equation:<br />
and n is the number <strong>of</strong> steps in the education ladder, e i<br />
is the marginal earnings<br />
gain at step i, and h i<br />
is the number <strong>of</strong> CHEs completed at step i.<br />
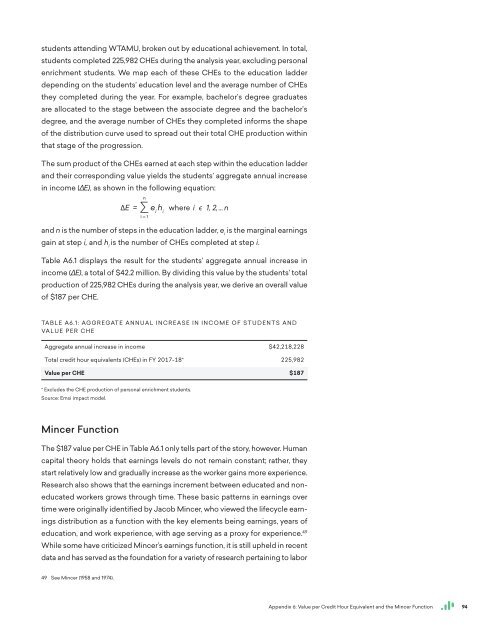
Table A6.1 displays the result for the students’ aggregate annual increase in<br />
income (∆E), a total <strong>of</strong> $42.2 million. By dividing this value by the students’ total<br />
production <strong>of</strong> 225,982 CHEs during the analysis year, we derive an overall value<br />
<strong>of</strong> $187 per CHE.<br />
TABLE A6.1: AGGREGATE ANNUAL INCREASE IN INCOME OF STUDENTS AND<br />
VALUE PER CHE<br />
Aggregate annual increase in income $42,218,228<br />
Total credit hour equivalents (CHEs) in FY 2017-18* 225,982<br />
<strong>Value</strong> per CHE $187<br />
* Excludes the CHE production <strong>of</strong> personal enrichment students.<br />
Source: Emsi impact model.<br />
Mincer Function<br />
<strong>The</strong> $187 value per CHE in Table A6.1 only tells part <strong>of</strong> the story, however. Human<br />
capital theory holds that earnings levels do not remain constant; rather, they<br />
start relatively low and gradually increase as the worker gains more experience.<br />
Research also shows that the earnings increment between educated and noneducated<br />
workers grows through time. <strong>The</strong>se basic patterns in earnings over<br />
time were originally identified by Jacob Mincer, who viewed the lifecycle earnings<br />
distribution as a function with the key elements being earnings, years <strong>of</strong><br />
education, and work experience, with age serving as a proxy for experience. 49<br />
While some have criticized Mincer’s earnings function, it is still upheld in recent<br />
data and has served as the foundation for a variety <strong>of</strong> research pertaining to labor<br />
49 See Mincer (1958 and 1974).<br />
Appendix 6: <strong>Value</strong> per Credit Hour Equivalent and the Mincer Function<br />
94