Issue 06/2018
bioplasticsMAGAZINE_1806
bioplasticsMAGAZINE_1806

Create successful ePaper yourself
Turn your PDF publications into a flip-book with our unique Google optimized e-Paper software.
From Science & Research<br />
How to<br />
calculate land<br />
use accurately<br />
A sensitivity approach<br />
By:<br />
Christian Schulz, Research associate<br />
Hans-Josef Endres, Head of the institute<br />
Hochschule Hannover,<br />
IfBB – Institute for Bioplastics and Biocomposites<br />
Hannover, Germany<br />
Satisfying (growing) human needs requires efficient use of<br />
limited economic resources. This also applies to the discussion<br />
about the use of available agricultural land, which in<br />
particular bioplastics has increasingly had to face in recent years.<br />
Previous estimates by IfBB - Institute for Bioplastics and Biocomposites,<br />
Hannover, Germany, have already shown that the impact<br />
of producing new generation bioplastics (New Economy such as<br />
PLA, Bio-PE, etc.) based on agricultural raw materials, such as<br />
starch, sugar and vegetable oil, is currently marginal at around<br />
0.05 % in 2017 and probably 0.07 % in 2022 in terms of land use<br />
compared to the global amount of arable land.<br />
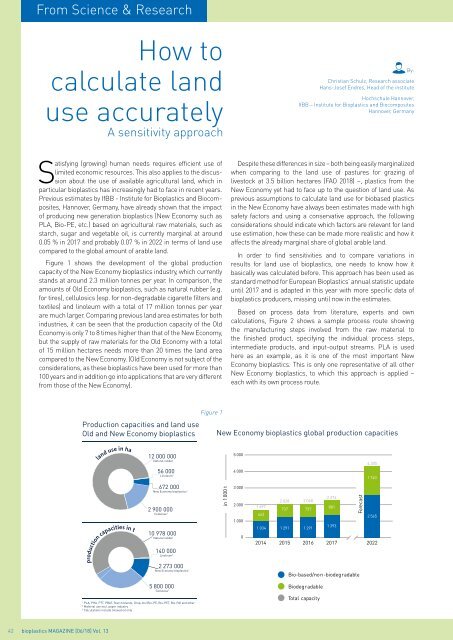
Figure 1 shows the development of the global production<br />
capacity of the New Economy bioplastics industry, which currently<br />
stands at around 2.3 million tonnes per year. In comparison, the<br />
amounts of Old Economy bioplastics, such as natural rubber (e.g.<br />
for tires), cellulosics (esp. for non-degradable cigarette filters and<br />
textiles) and linoleum with a total of 17 million tonnes per year<br />
are much larger. Comparing previous land area estimates for both<br />
industries, it can be seen that the production capacity of the Old<br />
Economy is only 7 to 8 times higher than that of the New Economy,<br />
but the supply of raw materials for the Old Economy with a total<br />
of 15 million hectares needs more than 20 times the land area<br />
compared to the New Economy. (Old Economy is not subject of the<br />
considerations, as these bioplastics have been used for more than<br />
100 years and in addition go into applications that are very different<br />
from those of the New Economy).<br />
Despite these differences in size – both being easily marginalized<br />
when comparing to the land use of pastures for grazing of<br />
livestock at 3.5 billion hectares (FAO <strong>2018</strong>) –, plastics from the<br />
New Economy yet had to face up to the question of land use. As<br />
previous assumptions to calculate land use for biobased plastics<br />
in the New Economy have always been estimates made with high<br />
safety factors and using a conservative approach, the following<br />
considerations should indicate which factors are relevant for land<br />
use estimation, how these can be made more realistic and how it<br />
affects the already marginal share of global arable land.<br />
In order to find sensitivities and to compare variations in<br />
results for land use of bioplastics, one needs to know how it<br />
basically was calculated before. This approach has been used as<br />
standard method for European Bioplastics’ annual statistic update<br />
until 2017 and is adapted in this year with more specific data of<br />
bioplastics producers, missing until now in the estimates.<br />
Based on process data from literature, experts and own<br />
calculations, Figure 2 shows a sample process route showing<br />
the manufacturing steps involved from the raw material to<br />
the finished product, specifying the individual process steps,<br />
intermediate products, and input-output streams. PLA is used<br />
here as an example, as it is one of the most important New<br />
Economy bioplastics. This is only one representative of all other<br />
New Economy bioplastics, to which this approach is applied –<br />
each with its own process route.<br />
Production capacities and land use<br />
Old and New Economy bioplastics<br />
Figure 1<br />
New Economy bioplastics global production capacities<br />
12 000 000<br />
Natural rubber<br />
56 000<br />
Linoleum 3<br />
5 000<br />
4 000<br />
4 305<br />
1 740<br />
672 000<br />
New Economy bioplastics 1<br />
2 900 000<br />
Cellulose 2<br />
10 978 000<br />
Natural rubber<br />
140 000<br />
Linoleum 3<br />
in 1 000 t<br />
3 000<br />
2 000<br />
1 000<br />
0<br />
2 028<br />
1 697<br />
737<br />
663<br />
1 034 1 291<br />
2014 2015<br />
2 048<br />
757<br />
1 291<br />
2016<br />
2 274<br />
881<br />
1 393<br />
2017<br />
Forecast<br />
2 565<br />
2022<br />
2 273 000<br />
New Economy bioplastics 1<br />
5 800 000<br />
Cellulose 2<br />
1 PLA, PHA, PTT, PBAT, Starch blends, Drop-Ins (Bio-PE, Bio-PET, Bio-PA) and other<br />
2 Material use excl. paper industry<br />
3 Calculations include linseed oil only<br />
Bio-based/non-biodegradable<br />
Biodegradable<br />
Total capacity<br />
Biopolymers, facts and statistics <strong>2018</strong> – 41<br />
42 bioplastics MAGAZINE [<strong>06</strong>/18] Vol. 13