Protim: Kobra - ANGL
Good practice example: Kobra Plus energy business building Kobra
Good practice example: Kobra
Plus energy business building Kobra

You also want an ePaper? Increase the reach of your titles
YUMPU automatically turns print PDFs into web optimized ePapers that Google loves.
20<br />
energy<br />
management of the building<br />
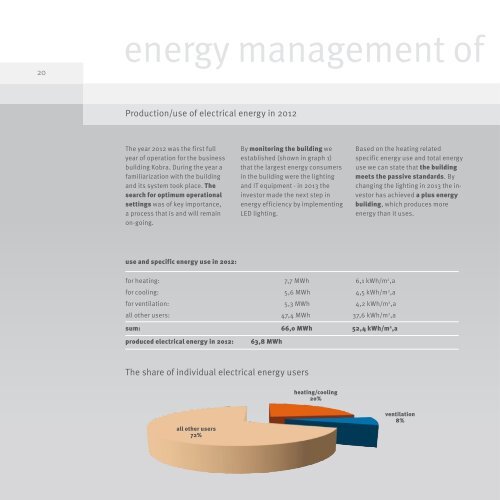
Production/use of electrical energy in 2012<br />
Monthly production/use of electrical energy in 2012<br />
The year 2012 was the first full<br />
year of operation for the business<br />
building <strong>Kobra</strong>. During the year a<br />
familiarization with the building<br />
and its system took place. The<br />
search for optimum operational<br />
settings was of key importance,<br />
a process that is and will remain<br />
on-going.<br />
By monitoring the building we<br />
established (shown in graph 1)<br />
that the largest energy consumers<br />
in the building were the lighting<br />
and IT equipment - in 2013 the<br />
investor made the next step in<br />
energy efficiency by implementing<br />
LED lighting.<br />
Based on the heating related<br />
specific energy use and total energy<br />
use we can state that the building<br />
meets the passive standards. By<br />
changing the lighting in 2013 the investor<br />
has achieved a plus energy<br />
building, which produces more<br />
energy than it uses.<br />
graph of production - use of el. energy (kWh)<br />
9,000<br />
8,000<br />
7,000<br />
6,000<br />
5,000<br />
4,000<br />
3,000<br />
2,000<br />
1,000<br />
use and specific energy use in 2012:<br />
for heating: 7,7 MWh 6,1 kWh/m 2 ,a<br />
0<br />
Jan.12<br />
Jan.12 - PPP<br />
Feb.12<br />
Feb.12 - PPP<br />
Mar.12<br />
Mar.12 - PPP<br />
Apr.12<br />
Apr.12 - PPP<br />
May.12<br />
May.12 - PPP<br />
Jun.12<br />
Jun.12 - PPP<br />
Jul.12<br />
Jul.12 - PPP<br />
Aug.12<br />
Aug.12 - PPP<br />
Sep.12<br />
Sep.12 - PPP<br />
Oct.12<br />
Oct.12 - PPP<br />
Nov.12<br />
Nov.12 - PPP<br />
Dec.12<br />
Dec.12 - PPP<br />
for cooling: 5,6 MWh 4,5 kWh/m 2 ,a<br />
for ventilation: 5,3 MWh 4,2 kWh/m 2 ,a<br />
all other users: 47,4 MWh 37,6 kWh/m 2 ,a<br />
Production/use of electrical energy in 2012<br />
sum: 66,0 MWh 52,4 kWh/m 2 ,a<br />
produced electrical energy in 2012: 63,8 MWh<br />
The share of individual electrical energy users<br />
all other users<br />
72%<br />
heating/cooling<br />
20%<br />
ventilation<br />
8%<br />
graph of production - use of el. energy (kWh)<br />
70,000<br />
60,000<br />
50,000<br />
40,000<br />
30,000<br />
20,000<br />
10,000<br />
0<br />
use of electrical energy<br />
production of electrical energy<br />
produced electrical energy heating/cooling ventilation all other users