

and HBeAg(-) patients - World Journal of Gastroenterology
and HBeAg(-) patients - World Journal of Gastroenterology
and HBeAg(-) patients - World Journal of Gastroenterology

Create successful ePaper yourself
Turn your PDF publications into a flip-book with our unique Google optimized e-Paper software.
trifuge tube, subsequently centrifuged at 18 000 × g for<br />
3 min <strong>and</strong> 50 μL <strong>of</strong> the supernatant was collected from<br />
each sample into a 1-mL EP tube, respectively. The collected<br />
supernatant was evaporated to dryness at 60℃ for<br />
24 h, using a vacuum dryer. Then 100 μL THF was added<br />
to each <strong>of</strong> the dried urine extracts <strong>and</strong> vortex-mixed for<br />
2 min, <strong>and</strong> 50 μL BSTFA was added to the mixture <strong>and</strong><br />
vortex-mixed for 2 min. The mixture was incubated at 60℃<br />
<strong>and</strong> derivatized for 30 min. After returning to the ambient<br />
temperature, samples were prepared for GC/MS analysis.<br />
GC/MS analysis<br />
Each derivatized sample <strong>of</strong> 1 μL was injected splitless into<br />
an Agilent 6980 GC system equipped with an HP5MS<br />
capillary column (30 m × 0.25 mm i.d., 0.25 μm), electron<br />
impact ionization at 70 eV, <strong>and</strong> a quadrupole mass<br />
spectrometric detector (Agilent Technologies, Palo Alto,<br />
CA, USA). The column temperature was initially held at<br />
100℃ for 3 min, 10℃/min up to 220℃, then 10℃/min to<br />
280℃, <strong>and</strong> remained there for 5 min. The injector temperature<br />
was 280℃. Carrier gas flow was helium at a constant<br />
flow rate <strong>of</strong> 1.0 mL/min. The interface temperature <strong>and</strong><br />
the ion source temperature were set at 200℃. Masses were<br />
obtained from 100-600 m/z. GC total ion chromatograms<br />
(TICs) <strong>and</strong> fragmentation patterns were acquired using<br />
GC/MSD ChemStation S<strong>of</strong>tware (Agilent Technologies,<br />
Palo Alto, CA, USA). Compound identification was performed<br />
by comparing the mass spectrum with a st<strong>and</strong>ard<br />
mass spectrum in the national institute <strong>of</strong> st<strong>and</strong>ards <strong>and</strong><br />
technology (NIST) mass spectra library. Peaks with similarity<br />
index more than 70% were assigned compound names,<br />
while those having less than 70% similarity were listed as<br />
unknown metabolites [30] . The chromatograms were subjected<br />
to noise reduction prior to peak area integration.<br />
Any known artificial peaks, such as peaks due to noise, column<br />
bleed <strong>and</strong> BSTFA derivatization procedure, were excluded<br />
from the data set. Integrated peak areas <strong>of</strong> multiple<br />
derivative peaks belonging to the same compound were<br />
summed <strong>and</strong> considered as a single compound. The resulting<br />
three dimensional matrix included sample information,<br />
peak intensities <strong>and</strong> peak retention time, <strong>and</strong> was applied<br />
to correlation analysis <strong>and</strong> pattern recognition.<br />
Data processing <strong>and</strong> pattern recognition<br />
The relative peak area <strong>of</strong> each compound would be calculated<br />
as the response after the peak areas <strong>of</strong> compounds<br />
were integrated. Each sample was represented by a GC/<br />
MS TIC. t test was employed for statistical analysis. Data<br />
were expressed as mean ± SD. The differentially expressed<br />
compounds with P < 0.05 were considered statistically<br />
significant. PCA was used to differentiate the samples <strong>and</strong><br />
performed using the SPSS 16.0 for Windows.<br />
RESULTS<br />
General state <strong>of</strong> mice <strong>and</strong> pathological results<br />
The mean weight <strong>of</strong> mice was 23.81 ± 0.16 g, 23.87 ±<br />
0.19 g <strong>and</strong> 23.98 ± 0.19 g for normal group, non-metastasis<br />
group <strong>and</strong> metastasis group, respectively (P > 0.05).<br />
WJG|www.wjgnet.com<br />
Hu JD et al . Urinary metabolomic pr<strong>of</strong>ile <strong>and</strong> gastric cancer<br />
A<br />
B<br />
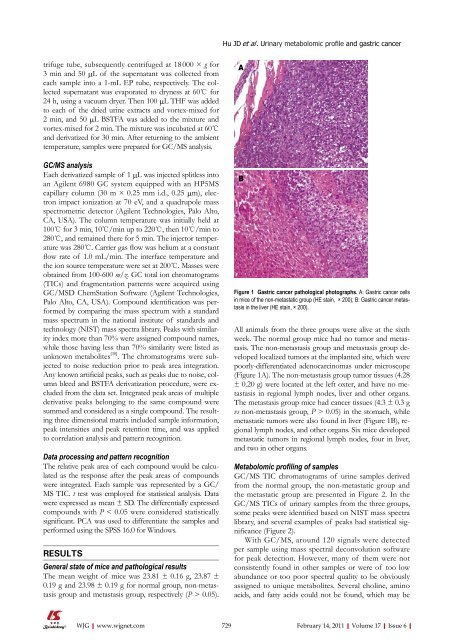
Figure 1 Gastric cancer pathological photographs. A: Gastric cancer cells<br />
in mice <strong>of</strong> the non-metastatic group (HE stain, × 200); B: Gastric cancer metastasis<br />
in the liver (HE stain, × 200).<br />
All animals from the three groups were alive at the sixth<br />
week. The normal group mice had no tumor <strong>and</strong> metastasis.<br />
The non-metastasis group <strong>and</strong> metastasis group developed<br />
localized tumors at the implanted site, which were<br />
poorly-differentiated adenocarcinomas under microscope<br />
(Figure 1A). The non-metastasis group tumor tissues (4.28<br />
± 0.20 g) were located at the left oxter, <strong>and</strong> have no metastasis<br />
in regional lymph nodes, liver <strong>and</strong> other organs.<br />
The metastasis group mice had cancer tissues (4.3 ± 0.3 g<br />
vs non-metastasis group, P > 0.05) in the stomach, while<br />
metastatic tumors were also found in liver (Figure 1B), regional<br />
lymph nodes, <strong>and</strong> other organs. Six mice developed<br />
metastatic tumors in regional lymph nodes, four in liver,<br />
<strong>and</strong> two in other organs.<br />
Metabolomic pr<strong>of</strong>iling <strong>of</strong> samples<br />
GC/MS TIC chromatograms <strong>of</strong> urine samples derived<br />
from the normal group, the non-metastatic group <strong>and</strong><br />
the metastatic group are presented in Figure 2. In the<br />
GC/MS TICs <strong>of</strong> urinary samples from the three groups,<br />
some peaks were identified based on NIST mass spectra<br />
library, <strong>and</strong> several examples <strong>of</strong> peaks had statistical significance<br />
(Figure 2).<br />
With GC/MS, around 120 signals were detected<br />
per sample using mass spectral deconvolution s<strong>of</strong>tware<br />
for peak detection. However, many <strong>of</strong> them were not<br />
consistently found in other samples or were <strong>of</strong> too low<br />
abundance or too poor spectral quality to be obviously<br />
assigned to unique metabolites. Several choline, amino<br />
acids, <strong>and</strong> fatty acids could not be found, which may be<br />
729 February 14, 2011|Volume 17|Issue 6|


