

and HBeAg(-) patients - World Journal of Gastroenterology
and HBeAg(-) patients - World Journal of Gastroenterology
and HBeAg(-) patients - World Journal of Gastroenterology

Create successful ePaper yourself
Turn your PDF publications into a flip-book with our unique Google optimized e-Paper software.
A<br />
Regression factor scores 2 for<br />
analysis 1<br />
B 1.0<br />
Sensitivity<br />
Hu JD et al . Urinary metabolomic pr<strong>of</strong>ile <strong>and</strong> gastric cancer<br />
2.00000<br />
1.00000<br />
0.00000<br />
-1.00000<br />
-2.00000<br />
-2.00000 -1.00000 0.00000 1.00000<br />
0.8<br />
0.6<br />
0.4<br />
0.2<br />
0.0<br />
receiver operating characteristic (ROC) analysis (AUC =<br />
1.00, Figure 5B).<br />
DISCUSSION<br />
The first two principal components<br />
Regression factor scores 1 for analysis 1<br />
ROC curve<br />
AUC = 1.00<br />
0.0 0.2 0.4 0.6 0.8 1.0<br />
1-specificity<br />
In this study, we investigated urinary metabolite pr<strong>of</strong>iling<br />
using GC/MS. This was assessed non-invasively by measuring<br />
two voxels (tumor <strong>and</strong> healthy controls). We have<br />
discriminated the gastric cancer model mice from their<br />
healthy controls in a PCA analysis <strong>of</strong> GC-MS urinary metabolite<br />
spectra. Moreover, we could also discriminate the<br />
gastric cancer metastasis model mice from the non-metastasis<br />
model mice by GC-MS <strong>and</strong> PCA <strong>of</strong> urinary metabolites.<br />
Some marker metabolites were worth investigating in<br />
the future. Compared with the normal group, the level <strong>of</strong><br />
lactic acid was higher in the cancer group urine. It could be<br />
explained that glucose is <strong>of</strong>ten converted into lactic acid in<br />
cancer cells, which is known as the “Warburg effect”, <strong>and</strong><br />
cancer cells have a higher rate <strong>of</strong> aerobic glycolysis [31] . The<br />
levels <strong>of</strong> butanedioic acid, malic acid <strong>and</strong> citric acid, intermediates<br />
<strong>of</strong> tricarboxylic acid (TCA) cycle, were also found<br />
to be higher in the gastric cancer mice. The abnormalities<br />
WJG|www.wjgnet.com<br />
Group<br />
Normal<br />
Cancer<br />
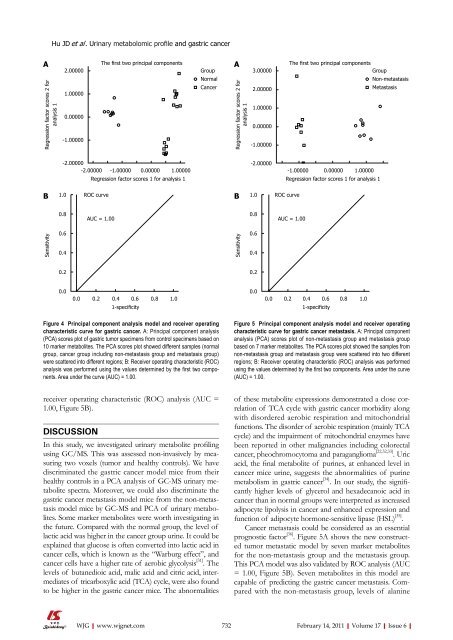
Figure 4 Principal component analysis model <strong>and</strong> receiver operating<br />
characteristic curve for gastric cancer. A: Principal component analysis<br />
(PCA) scores plot <strong>of</strong> gastric tumor specimens from control specimens based on<br />
10 marker metabolites. The PCA scores plot showed different samples (normal<br />
group, cancer group including non-metastasis group <strong>and</strong> metastasis group)<br />
were scattered into different regions; B: Receiver operating characteristic (ROC)<br />
analysis was performed using the values determined by the first two components.<br />
Area under the curve (AUC) = 1.00.<br />
A<br />
Regression factor scores 2 for<br />
analysis 1<br />
B 1.0<br />
Sensitivity<br />
3.00000<br />
2.00000<br />
1.00000<br />
0.00000<br />
-1.00000<br />
-2.00000<br />
0.8<br />
0.6<br />
0.4<br />
0.2<br />
0.0<br />
ROC curve<br />
The first two principal components<br />
Group<br />
-1.00000 0.00000 1.00000<br />
Regression factor scores 1 for analysis 1<br />
AUC = 1.00<br />
0.0 0.2 0.4 0.6 0.8 1.0<br />
1-specificity<br />
Non-metastasis<br />
Metastasis<br />
Figure 5 Principal component analysis model <strong>and</strong> receiver operating<br />
characteristic curve for gastric cancer metastasis. A: Principal component<br />
analysis (PCA) scores plot <strong>of</strong> non-metastasis group <strong>and</strong> metastasis group<br />
based on 7 marker metabolites. The PCA scores plot showed the samples from<br />
non-metastasis group <strong>and</strong> metastasis group were scattered into two different<br />
regions; B: Receiver operating characteristic (ROC) analysis was performed<br />
using the values determined by the first two components. Area under the curve<br />
(AUC) = 1.00.<br />
<strong>of</strong> these metabolite expressions demonstrated a close correlation<br />
<strong>of</strong> TCA cycle with gastric cancer morbidity along<br />
with disordered aerobic respiration <strong>and</strong> mitochondrial<br />
functions. The disorder <strong>of</strong> aerobic respiration (mainly TCA<br />
cycle) <strong>and</strong> the impairment <strong>of</strong> mitochondrial enzymes have<br />
been reported in other malignancies including colorectal<br />
cancer, pheochromocytoma <strong>and</strong> paraganglioma [22,32,33] . Uric<br />
acid, the final metabolite <strong>of</strong> purines, at enhanced level in<br />
cancer mice urine, suggests the abnormalities <strong>of</strong> purine<br />
metabolism in gastric cancer [34] . In our study, the significantly<br />
higher levels <strong>of</strong> glycerol <strong>and</strong> hexadecanoic acid in<br />
cancer than in normal groups were interpreted as increased<br />
adipocyte lipolysis in cancer <strong>and</strong> enhanced expression <strong>and</strong><br />
function <strong>of</strong> adipocyte hormone-sensitive lipase (HSL) [35] .<br />
Cancer metastasis could be considered as an essential<br />
prognostic factor [36] . Figure 5A shows the new constructed<br />
tumor metastatic model by seven marker metabolites<br />
for the non-metastasis group <strong>and</strong> the metastasis group.<br />
This PCA model was also validated by ROC analysis (AUC<br />
= 1.00, Figure 5B). Seven metabolites in this model are<br />
capable <strong>of</strong> predicting the gastric cancer metastasis. Compared<br />
with the non-metastasis group, levels <strong>of</strong> alanine<br />
732 February 14, 2011|Volume 17|Issue 6|


