GEOmedia 3 2020
The first italian geomatics magazine
The first italian geomatics magazine

Create successful ePaper yourself
Turn your PDF publications into a flip-book with our unique Google optimized e-Paper software.
Rivista bimestrale - anno XXIV - Numero 3/2020 - Sped. in abb. postale 70% - Filiale di Roma
LAND CARTOGRAPHY
GIS
CADASTRE
GEOGRAPHIC INFORMATION
PHOTOGRAMMETRY
3D
SURVEY TOPOGRAPHY
CAD
BIM
EARTH OBSERVATION SPACE
WEBGIS
UAV
URBAN PLANNING
CONSTRUCTION
LBS
SMART CITY
GNSS
ENVIRONMENT
NETWORKS
LiDAR
CULTURAL HERITAGE
Mag/Giu 2020 anno XXIV N°3
Terra Seismic
earthquake prediction
EO, VGI AND AI FOR
LAND MANAGEMENT
DISASTER RISK REDUCTION
WITH EARTH OBSERVATION
MONITORING ZNOSKO
GLACIER
STRUMENTI
TOPOGRAFICI
REACH RS2
MULTIFREQUENZA (L1,L2,L5)
MULTICOSTELLAZIONE (GPS, GLONASS, GALILEO, BEIDOU)
Il ricevitore RTK GNSS multifrequenza con precisione
centimetrica che stavi aspettando!
Dedicato ai professionisti della topografia
se acquistato in configurazione Pro (completo
a partire da*
di tablet windows con il software Libretto)
€ 1999
strumentitopografici.it 0825 191 22 58
*il prezzo è iva e spese di spedizione esclusi e si riferisce alla sola antenna con garanzia come per legge e fattura italia. nessun accessorio e nessun software sono inclusi.
per tutte le configurazioni consultare il sito internet strumentitopografici.it
The “everything digital” geospatial environment
This issue, mainly edited in English for the annual fair of INTERGEO, is facing, for the first
time, the international Geo-IT community in a digital meeting!
INTERGEO organizers says that exhibitors will meet international trade fair visitors, speakers
will meet their audience, and everything will be as usual. But we all know that things will not
be as usual and we hope that in the very next future the industrial economy of the Geospatial
community will run again, but surely in a different way.
In this “everything digital” environment, GEOmedia decided not to change producing a print
publication. Why? Because our readers still want it. Especially in this period were the pleasure
of getting away from the screens and continue enjoy geospatial information on a print paper
is really a great opportunity. But how are going other similar publications in the world? Many
decided to stop printing, mainly because of paper press process cost, but many other not. One for
all is an example for all of us, and we want to share with you the answer of Neil Sandlers to the
why xyHT is still a print magazine: “Yes, we are, and for some very good reasons. You, our readers,
still demand print. Our numbers show that 19,870 of you are holding a print version of this issue in
your hands, and 10,912 of you are looking at a digital edition on your phones or computers”.
Our numbers are not the same, we are in Italy not in USA, and our magazine is mainly in Italian
language, but the ratio looks the same.
Our first focus this issue is on Earthquake prediction with the article by Oleg Elshin of Terra
Seismic, an international team of scientists with over 30 years of experience in developing
effective technologies & methods in seismic forecasting. Oleg explain us that Terra Seismic can
predict most major earthquakes (M6.2 or greater) at least 2 - 5 months before they will strike,
based on determinations of the stressed areas that will start to behave abnormally before major
earthquakes.
The second focus approach the fusion of Earth Observation, Volunteered Geographic
Information and Artificial Intelligence for improved Land Management in an article by Vyron
Antoniou and Flavio Lupia.
Despite the coronavirus pandemic, the worldwide economic crisis and the general slow-down
of space activities, the temperature is high about the NASA Artemis program, meant to land in
2024 again on the Moon. The report of Marco Lisi “Positioning, Navigation and Timing for
Planetary Exploration and Colonization: to the Moon and Beyond” heralds the presence of a lot
of geomatics in next years.
Vincenzo Massimi on the article “Disaster risk reduction and reconstruction in Indonesia with
Earth Observation” report how Indra and Planetek Italia contributed with a batch of EO-based
services, for terrain deformation mapping before and after the 7.5 magnitude earthquake of
September 28, 2018 in the island of Sulawesi, Indonesia.
Gabriele Garnero, in the report “Control and monitoring of the Znosko Glacier in Antarctica”
with Fabian Brondi Rueda, Giovanni Righetti and Stefano Serafini will focus on the generation
of correct digital elevation models (DEM) for the monitoring of the glacier observed since the
1990s by Peru’s IGN (Instituto Geográfico Nacional), demonstrating that a correct geodesic setting
allows to obtain high resolution geospatial products.
Enjoy your reading.
Buona lettura,
Renzo Carlucci
In this
issue...
FOCUS
REPORT
COLUMNS
With Terra Seismic
earthquake
prediction, we can be
better
prepared for
earthquakes in Italy
by Oleg Elshin
6
22 SPACE AND EARTH
24 ESA Image
30 AUGMENTED REALITY
40 NEWS
42 AEROFOTOTECA
46 AGENDA
10
Fusing Earth
Observation,
Volunteered
Geographic Information
and Artificial
Intelligence for improved
Land Management
By Vyron Antoniou, Flavio Lupia
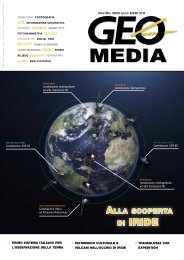
In cover image - stressed
areas and anomalies map in
Italy on 01.10.2008, six
months before 2009
L’Aquila earthquake
geomediaonline.it
GEOmedia, published bi-monthly, is the Italian magazine for
geomatics. Since more than 20 years publishing to open a
worldwide window to the Italian market and vice versa.
Themes are on latest news, developments and applications in
the complex field of earth surface sciences.
GEOmedia faces with all activities relating to the acquisition,
processing, querying, analysis, presentation, dissemination,
management and use of geo-data and geo-information. The
magazine covers subjects such as surveying, environment,
mapping, GNSS systems, GIS, Earth Observation, Geospatial
Data, BIM, UAV and 3D technologies.
ADV
Positioning, Navigation
and Timing
for Planetary
Exploration and
Colonization: to the
Moon and Beyond
by Marco Lisi
16
3DTARGET 21
ARCHIMETER 9
AUTODESK 29
EPSILON 14
ESRI ITALIA 39
CODEVINTEC 45
GEOBUSINESS 15
GEC SOFTWARE 2
GEOMAX 33
GIS3W 20
GTER 41
Disaster risk
reduction and
reconstruction in
Indonesia with Earth
Observation
by Vincenzo Massimi
26
PLANETEK 48
STONEX 47
TEOREMA 46
TOPCON 40
In the background image,
many multicolored curves
and handles of the Flinders
Mountains - the largest
mountain system of southern
Australia - appear in this
image in false-color captured
by the Copernicus Sentinel
mission-2.
34
Control and
monitoring of the
Znosko Glacier in
Antarctica
by Fabian Brondi Rueda,
Gabriele Garnero,
Giovanni Righetti,
Stefano Serafini
This image was captured on
December 31 2019 from the
two-satellite Sentinel-2, whose
goal is to ensure coverage
and the distribution of data
required by the program European
Copernicus. The data
were tried through the selection
of spectral bands useful
to classify the geological features.
This image also does
part of the video program
Earth from Space.
una pubblicazione
Chief Editor
RENZO CARLUCCI, direttore@rivistageomedia.it
Editorial Board
Vyron Antoniou, Fabrizio Bernardini, Mario Caporale,
Luigi Colombo, Mattia Crespi, Luigi Di Prinzio,
Michele Dussi, Michele Fasolo, Marco Lisi, Flavio Lupia,
Beniamino Murgante, Aldo Riggio, Mauro Salvemini,
Domenico Santarsiero, Attilio Selvini, Donato Tufillaro
Managing Director
FULVIO BERNARDINI, fbernardini@rivistageomedia.it
Editorial Staff
VALERIO CARLUCCI, GIANLUCA PITITTO,
redazione@rivistageomedia.it
Marketing Assistant
TATIANA IASILLO, diffusione@rivistageomedia.it
Design
DANIELE CARLUCCI, dcarlucci@rivistageomedia.it
MediaGEO soc. coop.
Via Palestro, 95 00185 Roma
Tel. 06.64871209 - Fax. 06.62209510
info@rivistageomedia.it
ISSN 1128-8132
Reg. Trib. di Roma N° 243/2003 del 14.05.03
Stampa: System Graphics Srl
Via di Torre Santa Anastasia 61 00134 Roma
Paid subscriptions
GEOmedia is available bi-monthly on a subscription
Science & Technology
basis.
Communication
The annual subscription rate is € 45. It is possible to subscribe at any time via
https://geo4all.it/abbonamento. The cost of one issue is € 9 €, for the previous
issue the cost is € 12 €. Prices and conditions may be subject to change.
Magazine founded by: Domenico Santarsiero.
Issue closed on: 28/08/2020.
Science & Technology Communication
FOCUS
With Terra Seismic earthquake
prediction, we can be better
prepared for earthquakes in Italy
by Oleg Elshin
Fig 1 - Stressed area in Italy on 01.10.2008, six months before 2009 L’Aquila earthquake."
Earthquakes have represented a permanent threat to Italy throughout the
country’s entire history: seismic events have been well known since Roman
times. The country also suffered major events in the 20th century. The most
tragic was the 1908 M7.1 Messina earthquake and subsequent tsunami that
almost completely destroyed the cities of Messina and Reggio Calabria,
leaving more than 80,000 victims in its wake. This threat still hangs over the
Italian people. Just within the last decade, the 2009 L’Aquila quake, the 2012
Emilia Romagna quakes and the 2016 Central Italy quakes reminded us that
we live in a dangerous and seismically active period for Italy.
The traditional response
to earthquake-related
danger is based on
long-term preparation in areas
where major earthquakes were
historically recorded. These
preparations usually include
establishing more resilient
building standards for new
buildings and reinforcing old
heritage. Italy is home to a
plethora of invaluable historic
buildings that are very vulnerable
to earthquakes. According
to some estimates, only about
25% of Italian buildings are
built in accordance with seismic
standards and only about
40% of current Italian infrastructure
is earthquake proof.
Akin to many other seismic
regions around the world,
insurance is not usually used
as a tool to obtain earthquake
damage relief in Italy. It’s estimated
that only about one per
cent of Italian buildings are insured
against earthquakes (2).
Recent events have again clearly
demonstrated that the
traditional approach provides
a little help in preventing
human loss, saving historic
buildings and mitigating the
economic damage produced by
earthquakes. For instance, the
Italian Civil Protection Agency
estimated the economic losses
from the 2016 October
earthquakes at €16.5 billion.
The insured loss was just €208
million, which indicates that
only 1.3% of the overall economic
loss was insured (3). Thus,
Italy remains very vulnerable to
6 GEOmedia n°3-2020
FOCUS
major earthquakes. With this
in mind, we need to find new
and better solutions to address
the danger posed by earthquakes
in Italy.
Fortunately, science and
technology progresses, and
global earthquake prediction,
a radically novel technology,
has created new and very promising
prospects for mitigating
earthquake danger in Italy and
globally. Terra Seismic, the
world’s first company of its
kind, has successfully developed
satellite Big Data technology
that can predict most
major earthquakes (M6.2+ or
greater) at least 2-5 months
before they will occur. The
technology has been in practical
use since 2013.
Terra Seismic’s unparalleled
technology
has been successfully
tested against historical
data for global
and Italian quakes
that have occurred
in the last 50 years.
Backward testing
shows that the
technology would
have successfully detected
all major M6+
Italian earthquakes
since 1980.
Global earthquake
prediction is based
on simple and universally
understandable
assumptions.
While earthquakes
occur suddenly for
humans, these perils
are not sudden for
nature. Nature needs
time to accumulate
a huge amount of
stress before producing
a major
earthquake. The area
where the future
earthquake will hit
will be stressed and
behave differently from other
areas in the vicinity. These areas
of abnormal behavior can be
detected well in advance and
this gives humans a warning
period to prepare effectively for
forthcoming major earthquakes.
Italians know that earthquakes
are a real and permanent danger,
but every new event still
catches Italy underprepared.
With radically new technology
and a much better understanding
of earthquake build-up
processes, what can we do differently
now?
Firstly, we now know that seismic
danger is distributed unevenly
across time and different
Italian regions. A specific pe-
culiarity of Italy is that periods
of high seismic activity may
be interspersed with relatively
quiet and prolonged risk-free
periods. Italy could establish
a special earthquake preparedness
and recovery fund,
which would accumulate funds
during quiet seismic periods
and spend money effectively
just before major earthquakes.
Secondly, the scarce resources
available for preparedness
could be more efficiently allocated
across Italian regions.
While almost all Italian regions
are exposed to earthquake risks,
funds could be invested mainly
in the region that will be affected
by a forthcoming major
earthquake.
Fig. 2 – Real predictions, stressed areas
and anomalies map: some latest case
analysed.
GEOmedia n°3-2020 7
FOCUS
Thirdly, we need to carefully
reanalyze and draw lessons
from past Italian events to
predict the potential secondary
consequences associated with
earthquakes. For example, the
2016 Amatrice quake shows
that destroyed and damaged
roads and bridges may hinder
the prompt arrival of rescue
teams and heavy rescue machinery
in the damaged area, and
so on.
Terra Seismic can predict most
major earthquakes (M6.2 or greater)
at least 2 - 5 months before
they will strike. Global earthquake
prediction is based on determinations
of the stressed areas that will
start to behave abnormally be- fore
major earthquakes. The size of the
observed stressed areas roughly
corresponds to estimates calculated
from Dobrovolsky’s formula.
To identify abnormalities and
make predictions, Terra Seismic
applies various methodologies,
including satellite remote sensing
methods and data from groundbased
instruments. We currently
process terabytes of information
daily, and use more than 80 different
multiparameter prediction
systems. Alerts are issued if the
abnormalities are confirmed by
at least five different systems. We
observed that geophysical patterns
of earthquake development and
stress accumulation are generally
the same for all key seismic regions.
Thus, the same earthquake
prediction methodologies and
systems can be applied successfully
worldwide. Our technology has
been used to retrospectively test
data gathered since 1970 and it
successfully detected about 90 percent
of all significant quakes over
the last 50 years.
www.terraseismic.org
Fourthly, detailed action plans
could be developed before
major events to address a region’s
specific characteristics.
According to these plans, the
government would need to
examine and reinforce the critical
and important infrastructure
in the area of a forthcoming
quake – hospitals, schools,
cultural heritage buildings, etc.
The rational use of millions of
euros on effective loss prevention
measures before earthquakes
hit is estimated to save
billions that are usually spent
on recovery after earthquakes.
Thus, thanks to this approach,
billions of euros’ worth of economic
damage could be prevented
in Italian earthquakes
and these huge savings allocated
to other purposes.
Fifthly, besides government
funding, private money and,
specifically, insurance companies
could play a greater role in
preparedness and earthquake
risk mitigation. Earthquake insurance
penetration is currently
very low in Italy. One of the
main reasons for this situation
is that quake insurance is very
expensive due to incorrect quake
risk assessment. Earthquake
prediction will assess quake
risk much more accurately,
thus allowing insurers to offer
much lower premiums
for many Italian regions and
make insurance coverage more
attractive. Innovation will create
conditions for affordable
earthquake insurance to penetrate
into the Italian market.
Finally, in Italy, building collapses
are responsible for most
deaths during earthquakes.
The death toll would be significantly
lower if people were
outside and distanced from old
buildings when the quake strikes.
As such, a timely warning
for people to simply sleep and
spend more time outside buildings
before major earthquakes
represents a very cheap and
effective solution. Training
drills and early warning alarms
will be effective at preventing
significant human loss due to
earthquakes. Based on Terra
Seismic’s global technology,
we can dramatically reduce the
human loss arising from these
awful perils and better protect
Italy. Terra Seismic calls for
cooperation with the Italian
Central and Regional governments
in order to improve
preparedness for forthcoming
events.
REFERENCES AND
FURTHER READINGS
1.Elshin, O. and Tronin, A.A.
(2020) Global Earthquake Prediction
Systems. Open Journal of
Earthquake Research, 9, 170-180.
https://arxiv.org/abs/2003.07593
2.Earthquake-resistant buildings: the
vulnerability of Italy’s infrastructure
https://www.webuildvalue.com/en/
infrastructure-news/earth-quakeresistant-buildings.html
3.2016 Central Italy earthquakes
cost an estimated 208 million euros:
PERILS
https://www.canadianunderwriter.
ca/claims/2016-central-italy-
earthquakes-cost-estimated-
208-million-euros-perils-
1004122686/#:~:text=The%20
Italian%20Civil%20Protection%20
Agency,insured%20loss%20of%20
the%20Aug.
KEYWORDS
Global earthquake prediction;
Big Data and novel technologies;
Earthquakes; Remote sensing;
Terra Seismic
ABSTRACT
Terra Seismic can predict most
major earthquakes (M6.2 or greater)
at least 2 - 5 months before
they will strike.
AUTHOR
Oleg Elshin
oleg.elshin@terraseismic.com
President at Terra Seismic
Alicante, Spain /
Baar, Switzerland
8 GEOmedia n°3-2020
Via Balilla 192
Canosa di Puglia (BT)
76012
FOCUS
tel. 0883 887466
mob. +39 347 4810454
info@archimeter.it
AMBIENTE
ARCHEOLOGIA
ARCHITETTURA
INFRASTRUTTURE
REALTA’ VIRTUALE
GEOmedia n°3-2020 9
FOCUS
Fusing Earth Observation, Volunteered
Geographic Information and Artificial
Intelligence for improved Land Management
by Vyron Antoniou, Flavio Lupia
Earth Observation data deluge is
calling for Artificial Intelligence
methods to support geomatics in
producing valuable information
for land management.
Open-source data, software
and services and volunteered
geographic information will be
relevant contributors.
Existing and future developments
in Earth Observation
The last few years we have witnessed
a proliferation of Earth
Observation (EO) systems with
improved sensing capabilities
and shorter revisiting periods.
Perhaps one of the most successful
paradigms of freely available
EO data is those provided
by the European Commission
(EC) Copernicus program
through the Sentinel constellation.
However, broad EO data
availability was unknown until
recently. At the beginning,
high resolution imagery was a
sole privilege of governments
or robust private companies,
while later, broadly available
imagery was of medium resolution
and long revisiting
times (e.g. through the Landsat
program). Today though, initiatives
like Sentinel provide
free imagery of up to 10m
resolution and of 5-day revisiting
period. Taking advantage
of these developments, many
stakeholders turn to the pu-
10 GEOmedia n°3-2020
FOCUS
mes, in or outside Data Cubes,
still remains a challenge. To
this end, an interesting development
comes from advances
in Artificial Intelligence
(AI), Machine Learning (ML)
and Deep Learning (DL).
Important breakthroughs that
took place during the last
few years have contributed to
their proliferation. First, it is
the improvements of the AI/
ML/DL field itself. New algorithms,
improved models and
better processes allow AI/ML/
DL to excel in long standing
problems and challenges compared
to existing solutions and
show the potential of the field
in the future. A second factor is
the open approach that many
stakeholders hold towards AI
issues. Partially from concerns
that have to do with the power
and the control that AI models
can have over important decisions
and partially inspired
by the principles set by opensource
software and wiki-based
projects, AI models, training
datasets and other helpful material
are freely accessible onliblicly
available data to cover
their needs as high quality
and timely imagery is easily
accessible from individuals
and researchers up to start-up
companies. As a consequence,
the private sector today needs
to offer imagery well below the
thresholds set by freely available
data pushing the spacebased
EO in a virtuous cycle.
A similar positive momentum
exists for the global co-ordination
of EO sensors. Examples
can be found in initiatives such
as the GEO (Group on Earth
Observations), an international
organization consisting of
more than 200 governments
and organizations. Its mission
is to implement GEOSS
(Global Earth Observation
System of Systems) which
is a set of interacting earth
observation, information and
processing systems aiming to
provide access to information
to a broad range of users and
purposes. GEOSS links these
systems, facilitates the sharing
of environmental data and information,
ensures that these
data are accessible and assures
their quality, provenance and
interoperability. More than
150 data providers contribute
to GEOSS and in total, there
are around 200 million datasets
available. A direct result of these
developments is the creation
of huge volumes of data, on
top of the already produced
ones. It is expected that more
than 8500 smallsats (i.e., less
than 500 Kg) will be launched
in the next decade alone, at an
average of more than 800 satellites
per year, and the constellations
will account for 83%
of the satellites to be launched
by 2028 (Euroconsult, 2019),
many of which will be for EO
purposes.
New Challenges – New
Solutions
All these create new challenges
when it comes to efficiently
storing, managing, processing
and analysing EO imagery.
Moreover, there is increased
need for automation and
end-to-end methodologies for
image analysis in order to take
advantage of the wealth of data
generated. An interesting way
forward is paved by the progress
in satellite imagery Data
Cubes. Data Cubes are novel
approaches for storing, organizing,
viewing and analyzing
large volumes of imagery and
thus, enable more efficient
management and analysis
methods. They allow a homogenized
way of storing timerepeating
imagery for a defined
area. This creates a virtual cube
of data over a specific area
where the z-axis corresponds to
time. Data Cubes ensure high
quality and consistency of the
stored data while they provide
the necessary infrastructure,
tools and services. However,
processing of large data volu-
Fig. 1 - An example of artificial neural network with a hidden layer (Source: https://commons.wikimedia.org/wiki/File:Artificial_neural_network.svg)
GEOmedia n°3-2020 11
FOCUS
ne which lower the entry bar
of an individual to this field.
Moreover, big companies offer
for free the necessary computational
power so that anyone
can experiment and progress
into the AI domain (see for
example Google’s Colab -
https://colab.research.google.
com/).
Machine Learning in
Geomatics
In general, ML/DL is revolutionizing
how massive data
volumes are analysed. In the
Geomatics domain, ML/DL
allows the development of
geospatial applications that,
a few years ago, were beyond
reach in terms of efficiency and
processing capacity. Examples
can be found in satellite image
artefact reduction (Wegner et
al., 2018); image denoising
(Huang et al., 2019); pansharpening
(Yang et al., 2017)
or super resolution (Huang et
al., 2015) to name a few. Of
course, the ML/DL field is not
without challenges. One of
the most puzzling ones is the
stability of the results. Gilmer
et al. (2018) illuminates the
problem and explains how easy
it is for deep neural networks
(DNN), which are highly accurate
on benchmark datasets,
to be confused and perform
poorly when they have to work
with real-life adversarial cases.
For example, Hendrycks et al.
(2019) show that with a set
of adversarial images a DNN
achieved an accuracy of approximately
2%, which was a
drop of approximately 90%
compared to its accuracy with
the benchmark IMAGENET
dataset. However, ML/DL is
constantly gaining momentum
and the user and developer
pool is getting bigger and more
active in all domains, including
Geomatics. This trend is also
seconded by multiple virtual
places where engineers meet
and compete to produce novel
or more efficient AI models.
For example, the Kaggle platform
(https://www.kaggle.
com/) hosts open competitions
Fig. 2 - A filter in the first layer of a convolutional artificial neural network interpreting an image
(Source: https://commons.wikimedia.org/wiki/File:Convolutional_Neural_Network_Neural-
NetworkFilter.gif).
that challenge researchers and
developers to present models
that are capable of accurately
evaluating benchmark datasets.
Similar is the concept behind
the DigitalGlobe challenge
(https://spacenetchallenge.
github.io/) which focus
exclusively in remote sensing
application, the Crowd AI
mapping challenge (https://
www.crowdai.org/challenges/
mapping-challenge) which
focuses on building detection
for humanitarian response in
areas with poor mapping coverage,
and the Defense Science
and Technology Laboratory
(Dstl) challenge, which focus
on natural or manmade features,
such as waterways and
buildings from multispectral
satellite imagery.
Volunteered Geographic
Information in the service of
Machine Learning
One important factor that
affects the progress of ML/
DL is the availability of training
datasets. In Geomatics,
the solution can be found in
the growth of Volunteered
Geographic Information
(VGI). For more than a decade
now, VGI is spearheading
the creation of freely available
data. OSM, the flagship of
VGI, provides global coverage
with free data where someone
can find vectors that outline
natural and man-made features
including land use and land
cover data. The geometry of
the features, along with their
imagery counterpart, can form
rich sources of training datasets
that can be used to train ML/
DL models in order to perform
complex processes such as automatic
road network extraction,
object detection or land
classification (Antoniou and
Potsiou 2020).
12 GEOmedia n°3-2020
FOCUS
Agriculture and Earth
Observation
It is widely recognized that EO
and geospatial data of high quality,
frequency and with wider
accessibility can enable and fully
support global, regional and
country initiatives and regulations.
New data-driven approaches
and Big Data Analytics
provide unique opportunities
to track and monitor human
actions toward sustainability as
required by Agenda 2030 in a
really consistent and comparable
manner.
At EU level, environmental and
agricultural sector will benefit
for the deluge of data from EO
(e.g. Copernicus Programme)
and other sources (in-situ/proximal/ground
sensors) helping
to support the European Green
Deal - the roadmap for addressing
climate change issues making
the EU economy
sustainable and the new
Common Agricultural Policy
(CAP).
CAP is already exploiting
Copernicus satellite data to
generate several products: land
use/land cover and crop type
maps, land take, crop conditions,
soil moisture, high nature
value farmland, and landscape
fragmentation. In addition,
CAP subsidies to farmers will
take advantage of the EO data
to perform the full monitor of
the farmers compliance and to
dramatically reduce the sample
field checks.
In this arena, managing petabytes
of data from EO and other
sources data to be synergistically
integrated will be the challenge
and new tools, such as AI, will
be pivotal in extracting actionable
geospatial information. To
this end, EU is moving toward
the development of cutting-edge,
ethical and secure AI trough
a coordinated effort and cooperation
among Member States,
as stated by the Coordinated
Plan on Artificial Intelligence
(European Commission, 2018).
Agriculture and Machine
Learning
The growing use of ICT in agriculture
and precision farming
have opened up the Digital
Agriculture era where a large
amount of data coming from
a variety of sensors will enable
data-driven precise farming strategies.
The final goal is always
to handle a complex system of
systems, where several components
(soil, weather, crops and
farm management) interact at
different spatial and temporal
scales, in search of sustainability
of farm inputs and growth of
product quality and economic
performances.
ML/DL techniques have already
been proven as a powerful
tool to unravel the complexities
of the agricultural ecosystem.
Liakos et al. (2018), in their review
found the following as the
most promising applications:
crop management (yield estimates,
diseases and weeds detection,
crop quality and identification),
livestock management
(animal welfare and production),
water and soil management.
ML/DL models dominate
in the field of crop management
where there is a consolidated
use of imagery that can be used
directly, often without the need
of data fusion from different
sources. ML applications are less
common when data recorded
from different sensors need to
be integrated into big datasets
thus, requiring a lot of effort
to be managed (e.g. livestock
management). Literature reports
Artificial Neural Networks
(ANNs) and Support Vector
Machines (SVMs) as the most
widespread models used in agriculture.
Despite the difficulties to
compare the experimental
conditions of the literature,
Kamilaris & Prenafeta-Boldú
(2018) in their review found
that DL-based technics (mainly
Convolutional Neural Networks
- CNNs) have always better performances
when compared with
classical state-of-the-art approaches
using EO and Unmanned
Aerial Vehicle data in various
agricultural areas (leaf classification,
leaf and plant disease
detection, plant recognition and
fruit counting). Moreover, several
papers reported advantages
of DL in terms of reduced effort
in feature engineering where
manual identification of specific
components is always challenging
and time consuming.
Other advantages are the good
performance in generalization
and the robustness in difficult
conditions (such as illumination,
complex background,
different resolution, size and
orientation of the images).
What lies ahead
In general, ML/DL approaches
seem very promising for addressing
the complexity of the agricultural
domain by providing
the ingredients to move towards
a knowledge-based agriculture.
In Geomatics, the need for large
annotation datasets, as training
inputs, can be supported by
VGI which offer large volumes
of free data. However, at the
same time, several weaknesses
need to be addressed such as the
limitation to generalize beyond
the boundaries of benchmark
datasets, time-consuming preprocessing
and safeguarding the
consistency of the results in order
to further accelerate the use
of AI/ML/DL. Finally, we stress
the need to orchestrate these
promising solutions dealing
with specific aspects of agriculture
within a wider decisionmaking
environment.
GEOmedia n°3-2020 13
FOCUS
REFERENCES
Antoniou, V., & Potsiou, C. (2020). A Deep Learning
Method to Accelerate the Disaster Response Process.
Remote Sensing, 12(3), 544.
Euroconsult, 2019. Smallsat Market to Nearly Quadruple
over Next Decade. Available at http://www.
euroconsult-ec.com/5_August_2019
European Commission, 2018. Coordinated Plan on Artificial
Intelligence. Available at https://eur-lex.europa.
eu/legal-content/EN/TXT/?uri=COM:2018:795:FIN
Gilmer, J.; Adams, R.P.; Goodfellow, I.; Andersen,
D.; Dahl, G.E. Motivating the Rules of the Game
for Adversarial Example Research. arXiv 2018, ar-
Xiv:1807.06732.
Hendrycks, D., Zhao, K., Basart, S., Steinhardt, J., &
Song, D. 2019. Natural adversarial examples. arXiv
preprint arXiv:1907.07174.
Huang, W., Xiao, L., Wei, Z., Liu, H., & Tang, S.,
2015. A new pan-sharpening method with deep neural
networks. IEEE Geoscience and Remote Sensing Letters,
12(5), 1037-1041.
Huang, Z., Zhang, Y., Li, Q., Li, Z., Zhang, T., Sang,
N., & Xiong, S., 2019. Unidirectional variation
and deep CNN denoiser priors for simultaneously
destriping and denoising optical remote sensing images.
International Journal of Remote Sensing, 40(15),
5737-5748.
Kamilaris, A., & Prenafeta-Boldú, F. X. (2018). Deep
learning in agriculture: A survey. Computers and electronics
in agriculture, 147, 70-90.
Liakos, K. G., Busato, P., Moshou, D., Pearson, S., &
Bochtis, D. (2018). Machine learning in agriculture: A
review. Sensors, 18(8), 2674.
Wegner, J.D., Roscher, R., Volpi, M. and Veronesi,
F., 2018. Foreword to the Special Issue on Machine
Learning for Geospatial Data Analysis.
Yang, J., Fu, X., Hu, Y., Huang, Y., Ding, X., & Paisley,
J., 2017. PanNet: A deep network architecture for pansharpening.
In Proceedings of the IEEE International
Conference on Computer Vision (pp. 5449-5457).
KEYWORDS
Earth observation; VGI; machine learning;
deep learning; digital agriculture, land management
ABSTRACT
The ever-growing availability of Earth Observation (EO)
data is demonstrating a wide range of potential applications
in the realm of land management. On the other hand, large
volumes of data need to be handled and analysed to extract
meaningful information and Geomatics coupled with new
approaches such as Artificial Intelligence (AI) and Machine
Learning (AI) will play a pivotal role in the years to come.
Training datasets need to be developed to use these new
models and Volunteered Geographic Information can be
one of the promising sources for EO processing. Among
the various applications, agriculture may benefit from the
large dataset availability and AI processing. However, several
issues remain unsolved and further steps should be taken in
the near future by researchers and policy makers.
AUTHOR
Vyron Antoniou
Multi-National Geospatial Support Group
Frauenberger Str. 250, 53879, Euskirchen,
Germany
v.antoniou@ucl.ac.uk
Flavio Lupia
flavio.lupia@crea.gov.it
CREA Council for Agricultural
Research and Economics
Via Po, 14 00198, Rome, Italy
14 GEOmedia n°3-2020
FOCUS
in collaborazione con
Il Servizio Pubblico della distribuzione
in relazione ai cambiamenti
Modelli di prevenzione Piani d’azione Sviluppo sostenibile
28 e 29 OTTOBRE
Presso Piave Servizi - Codognè (TV)
USO VERTICALE
Per programma & iscrizioni
Non è una fiera e neppure un convegno, ma una nuova formula di incontro e comunicazione che, pur tenendo
conto delle dinamiche tradizionali, non manca di rispondere a quelle che sono le legittime esigenze
delle aziende: far conoscere i propri prodotti e tecnologie suscitando interesse; e quelle dei gestori: essere
aggiornati su tutte le novità e tecnologie innovative di un mercato in continuo fermento.
In questo modo chi deve vendere, e chi deve acquistare, si troveranno faccia a faccia in un reciproco scambio
di opinioni, informazioni, esigenze.
Attraverso la formula dello speech, si potrà assistere ai vari interventi di presentazione anche in maniera discontinua,
senza l’obbligo di rimanere incollati alla sedia trascurando le indispensabili pubbliche relazioni
che sono il vero focus di ogni incontro.
CON IL PATROCINIO DI
ASSOCIAZIONE REGIONALE CONSORZI GESTIONE
E TUTELA DEL TERRITORIO E ACQUE IRRIGUE
CONSIGLIO DI BACINO
L.R. del Veneto n. 17 del 27 april
MEDIA PARTNER
Organizzato da
Servizi a rete - Via delle Foppette, 6 - 20144 Milano (MI) - T +39 02 36517115 - F +39 02 36517116
marketing@tecneditedizioni.it - www.serviziarete.it
GEOmedia n°3-2020 15
REPORT
Positioning, Navigation and Timing
for Planetary Exploration and
Colonization: to the Moon and Beyond
by Marco Lisi
Despite the coronavirus pandemic,
the worldwide economic crisis and
the general slow-down of space
activities, the temperature is high
about the NASA Artemis program,
meant to land in 2024, 52 years after
the last Apollo mission and 20 years
of confinement in low Earth orbit,
human beings on the Moon.
To justify this maintained
focus, during a recent
press conference, NASA
Administrator Jim Bridenstine
said bold aspirations are needed
now more than ever, given the
coronavirus pandemic: “We
need to give people hope, we
need to give them something
that they can look up to, dream
about, something that will inspire
not just the nation but the
entire world”.
With the Artemis program,
NASA plan to collaborate with
commercial and international
partners to establish a permanent
“base camp” and a sustainable
exploration of the Moon
by the end of the decade. The
ultimate goal is to use what will
be learned on and around the
Moon to take the next giant
leap: sending astronauts to
Mars.
Challenges ahead are numerous:
as a matter of example, studies
performed at ESA and NASA
determined that local materials
and 3D printing technologies
would be the best for constructing
buildings and other structures,
which means no need for
transporting resources from the
Earth at an astronomical cost.
But the problems to be solved
for the realization of a stable
manned infrastructure on the
Moon (a true follow-on of the
International Space Station) involve
much more than just building
technologies. The Moon
“base camp” will have to meet
very stringent requirements in
terms of operations, logistics,
and safety of life. From an
architectural viewpoint, the
“Moon base” will have to be
expandable and “open” to the
integration with other systems,
hence integrability and expandability
will be key issues. But
first and above all, a permanent
base on the Moon will have to
be affordable and sustainable,
i.e., its cost will need to be assessed
over its life-cycle, under a
long term technical, economic,
and political perspective.
The exploration of the Moon
with human and robotic missions
and its colonization,
through the establishment of
a permanent base, will require
many vital supporting infrastructures,
such as communication
networks and positioning,
navigation, and timing (PNT)
systems.
All architectural approaches
considered so far by NASA and
ESA to develop communications
and PNT infrastructures
on the Moon can be divided
into two main categories:
• Comprehensive, well-structured
and forward-looking (but
costly) architectures, based on
constellations of orbiters and
relay satellites;
16 GEOmedia n°3-2020
REPORT
• “ad hoc”, flexible, expandable
architectures, based on a fusion
of all available resources
and commercial technologies.
The second approach looks like
a more promising, affordable,
and sustainable solution.
A Lunar Communication
Network
The Moon communication
infrastructure shall be able to
provide several capabilities, that
can be summarized in two main
categories: users/applications
that need low data rate and
very reliable links, and those
that require high data rate links.
The first category includes
monitoring and control of the
base camp systems/payloads
and essential audio, video, and
file transfer among users. Links
for these applications shall have
high service availability (for
instance 99.99%) also in case
of emergencies and (lunar) disasters,
regardless of Moon phases,
Earth position, terrestrial
weather conditions, etc. The
second category instead includes
HTTP surfing, high quality,
Audio/Video communications,
video streaming, HD television,
file sharing, cloud computing,
etc. These applications will be
provided with a service availability
lower than the first category
(for instance 98%).
A pragmatic answer to these
requirements might consist in a
scalable network that relies on
terrestrial, wireless technologies,
such as 4G and 5G, intending
to limit the effort of designing
and developing dedicated
technologies for the Moon
“base camp” (fig. 1).
Consequently, the design of the
lunar communication network
will be mainly devoted to the
definition of its cell distribution
on the lunar surface. The
cell distribution will strongly
depend on the network (performance,
functional, and operational)
requirements, the lunar
site location, and the selected
air interface.
Starting from these inputs, a
possible strategy for defining
the cell distribution is summarized
in Fig.2 and described as
follows. The “Moon Base” requirements
and the, e.g., 5G air
interface definition are inputs
for the definition of the link
budgets, in particular for the
transmitting and the receiving
chains, to derive the maximum
attainable path loss. At the same
time, the base camp location
physical and environmental
properties are a starting point
for the definition of a path
loss model, that can be derived
through analysis based on the
already available information
and, in the future, from testing
in specific environmental conditions.
Once that path loss
model and link budgets are
completed and consolidated,
the coverage distribution of a
single cell can be determined.
The coverage will depend on
its location (latitude, longitude,
height from the surface), the
adopted antennas, and the surrounding
infrastructure: notice
that all these parameters can
be elaborated from software
Fig. 2 - Logical steps for the design of the lunar cellular network
Fig. 1 - Modular, Expandable Moon Navigation & Communications
Infrastructure
tools and the coverage pattern
computed for several positions.
This allows deriving a first iteration
of the cell distribution,
and thus of the lunar cellular
network, by dovetailing several
cells on the selected site and
verifying that the total coverage
meets the initial requirements.
An important component in
the Moon Base communication
network is the backhauling link
with Earth, which allows 5G
communication terminals to access
all services in the terrestrial
network (e.g. a Skype© call
from a Lunar operator inside
the habitat with its family on
Earth).
The backhauling link will be
designed to provide an ultrahigh
data rate and high-availa-
GEOmedia n°3-2020 17
REPORT
Positioning, Navigation and
Timing on the Moon
Fig. 3 - Example of possible 5G communication network with backhauling to Earth realized using Moon
orbiter satellites
bility link. Candidate technologies
for backhauling are both
microwave and optical communications,
each of them with
advantages and disadvantages
in terms of data rates, weather
sensitivity, and pointing accuracy
An example of backhauling
configuration is the one shown
in fig. 3 where orbiters are in
stable orbits around the Moon
and relay all the traffic from the
Earth directly to Moon ground
stations.
Alternatively, the backhauling
could be realized through a
direct link Moon-Earth. A possible
configuration is depicted
in Fig.4, where 5G stations are
wired to optical backhauling
stations that communicate directly
with Earth.
Fig. 4 - Example of possible 5G communication network with backhauling to Earth realized through
direct-to-Earth optical link.
Lunar positioning
Since 2001, the Aurora space
exploration program has led
the European activities towards
the potential deployment of
human bases on Mars and the
Moon. Within this framework,
two feasibility studies of a reduced
planetary navigation and
communications system were
performed. Both studies concluded
that COTS equipment,
based on IEEE 802.16 WiMAX
standard, could be used to fulfill
the mission requirements for
short-range activities (i.e., link
distance below 8 km), but longrange
activities were not foreseen
to be covered only with an
infrastructure on the planetary
surface. Future 5G technology
is expected to overcome these
challenges and to provide the
necessary coverage, flexibility,
and performance required by a
permanent base.
The 5G standard looks like a
promising standard to support
communication and positioning
capabilities for a wide range
of applications, such as massive
Internet of Things (IoT),
mission-critical control, and
enhanced mobile broadband.
For this purpose, advanced
wireless technologies, such as
massive MIMO antennas and
wideband millimeter-wave links
are foreseen. Similarly to the
4G LTE standard, 5G multicarrier
waveforms will allow the
flexible allocation of data, as
well as dedicated pilot signals
for positioning purposes. These
pilot signals can be used to perform
ranging measurements for
time-of-arrival (ToA) location
methods, and multi-antenna
techniques can enable angle-ofarrival
(AoA) localization.
The 5G networks for the Moon
Base mission are designed ac-
18 GEOmedia n°3-2020
REPORT
cording to the requirements for
potential manned and robotic
activities. The main design
parameters are the cell site location,
cell coverage, and signal
bandwidth. These parameters
define the achievable communication
and positioning capabilities.
The configuration of
multiple cell sites over a certain
area, i.e., the geometry of cell
sites with respect to the receiver,
determines the dilution of
precision (DOP) of ToA and
AoA methods. The cell coverage
mainly depends on the height
of the cell mast, transmit power,
antenna pattern, and propagation
conditions. For instance,
on the Moon, a cell tower of 10
meters above the surface is required
to achieve a line-of-sight
(LoS) distance to the horizon of
almost 6 km, but this distance
may be limited by the irregular
topography of the surface. Last,
the spectrum allocation of the
positioning resources (i.e., pilot
signals) determines the ranging
accuracy, as well as the data
rate. Design procedures developed
for 5G terrestrial networks
could be adapted to the conditions
on the Moon. In some
situations, the ToA estimates
will need to be combined with
data from inertial measurement
units. Furthermore, in mesh or
ad hoc networks, such as device-to-device
(D2D) communications,
cooperative positioning
between wireless sensors or sites
may provide additional location
solutions.
Precise synchronization of lunar
stations
5G systems on Earth rely on
GNSS signals for precise synchronization.
GNSS receivers
are used to provide precise
timing in different parts of
the 4G LTE ground network,
which requires within 3 to
10 microseconds accuracy,
Fig. 5 - GNSS space antenna developed for GEO orbit.
depending on the application
and the standard adopted. On
Earth, such accuracies are easily
achievable by a professional
GNSS timing receiver, which
has an accuracy in the order of
tens of nanoseconds. This same
approach could be adopted for
Moon-based 5G gateway stations.
Clearly, on the Moon, the
conditions are significantly
different with respect to the
Earth surface. The use of GNSS
(such as GPS or Galileo) signals
in the Moon environment has
been studied in past ESA contracts.
The major challenges to
be considered are:
• Signal power: in addition
to the higher free-space loss,
the majority of the received
signals come from the GNSS
transmitter antennas’ sidelobes
(with considerably lower
gains). Additionally, stronger
signals may interfere with the
correct acquisition and tracking
of weaker signals (nearfar
effect), with a consequent
impact on receiver sensitivity
and robustness;
• Dynamics: high ranges for
Doppler and Doppler rates
hinder acquisition and impose
additional stress on the
tracking loops, also making it
more difficult to process weak
signals;
• Geometry: the geometry of
the usable satellites is considerably
worse than for terrestrial
applications. Additionally,
occultation by the Earth and
Moon and receiver sensitivity
(minimum C/N0 required
to acquire and track GNSS
signals) may also have an impact
on the dilution of precision
(DOP).
The studies however showed
that GNSS could be used for
MTO (Moon transfer orbit),
LLO (Lunar Low Orbit), D&L
(Lunar Descent and Landing)
and, with strong limitations, for
Lunar Surface real-time positioning.
The accurate synchronization
of the 5G base stations on the
Moon surface can be achieved
using a professional high sensitivity
timing GNSS receiver
equipped with a directional
high gain antenna (fig. 5), kept
pointing to the Earth.
The receiver will be configured
in timing mode, i.e., it will
GEOmedia n°3-2020 19
REPORT
compute only a precise time
solution, by assuming a precise
knowledge of the antenna
location (better, of its phasecenter),
assessed at least once
through non-GNSS methods.
Such information can be kept
in the receiver, which will then
only work as a timing receiver.
The need for long coherent
integration and the high dynamics,
as well as the need for a
reliable back-up, will suggest
the use of miniaturized atomic
clocks to avoid degradation of
the performances during the
integration (COTS miniaturized
atomic clocks are already
available in the market and
currently used in professional
ground equipment).
Conclusion
The exploration of the Moon
with human and robotic missions
and its colonization,
through the establishment of
permanent bases, will require
planetary communications
and navigation infrastructures.
An affordable, no-nonsense
approach might rely on the
use of COTS components,
presently deployed on Earth
in LTE and 5G networks, for
communication and navigation
on the Moon surface.
This approach largely satisfies
the requirements of performance,
reliability, affordability,
and sustainability, as based on
commercial technology and
being incrementally expandable
over time.
ABSTRACT
With the Artemis program, NASA plans to
collaborate with commercial and international
partners to land in 2024 human beings
on the Moon and then to establish a
permanent “base camp” by the end of the
decade.
Challenges ahead are numerous: the Moon
“base camp” will have to meet very stringent
requirements in terms of operations,
logistics, and safety of life; moreover, a permanent
base on the Moon will have to be
affordable and sustainable, i.e., its cost will
need to be assessed over its life-cycle, under a
long term technical, economic, and political
perspective.
The exploration of the Moon with human
and robotic missions and its colonization,
through the establishment of a permanent
base, will require many vital supporting
infrastructures, such as communication
networks and positioning, navigation, and
timing (PNT) systems.
KEY WORDS
Positioning; navigation; timing; GNSS;
Moon; infrastructure; network; communication;
IoT; 5G
AUTHOR
Dr. Ing. Marco Lisi
ingmarcolisi@gmail.com
Independent Consultant
Aerospace & Defence
20 GEOmedia n°3-2020
REPORT
GEOmedia n°3-2020 21
SPACE AND EARTH
May 30, 2020: US astronauts reach
space with a national, commercial
space vehicle
by Marco Lisi
Fig. 1 - SpaceX Crew Dragon capsule, ready for launch
In the middle of the worldwide
Coronavirus pandemic,
after nine years from the Space
Shuttle Atlantis's final flight on
July 2021, US astronauts reach
space with a national, commercial
space vehicle.
May 30, 2020, a historic day
for the US and Space exploration
at large: a SpaceX Falcon
9 rocket carrying the company's
Crew Dragon spacecraft
is launched from NASA’s
Kennedy Space Center in
Florida, with NASA astronauts
Robert Behnken and Douglas
Hurley onboard (fig. 1).
For the first time in history
and after nine years from the
Space Shuttle Atlantis's final
flight on July 2021 (thirteen
years from the Columbia’s
tragedy in 2003), NASA astronauts
have launched from
American soil in a commercially
built and operated American
crew spacecraft on its way to
the International Space Station.
The day after, May 31, the
Crew Dragon capsule, named
Endeavour, successfully docked
with the International Space
Station, bringing the company’s
first crew to the only
mankind’s orbiting outpost
(fig. 2).
The Crew Dragon’s docking
validated one of the most innovative
features of SpaceX’s
vehicle: its automated docking
system. The capsule is designed
to autonomously approach the
ISS and latch on to a docking
port, based on a standardized
interface, needing no intervention
from its human passengers.
The Crew Dragon mission
success is at the same time a
reason for hope in the future
of Space exploration, in particular,
the planned mission
to the Moon, and, which is
even more important, a confirmation
of the effectiveness
of the NewSpace paradigm. As
pointed out by the Washington
Post web site (June 22, 2020):
“the contract that resulted in
the Dragon crewed spacecraft
was issued by NASA in 2014.
Six years and $3 billion later, it
has flown astronauts into orbit.
What SpaceX did was show
that a well-led entrepreneurial
team can achieve results that
were previously thought to
require the efforts of superpowers,
and in a small fraction of
the time and cost, and even —
as demonstrated by its reusable
Falcon launch vehicles — do
things deemed impossible altogether.
This is a revolution.”.
Crew Dragon belongs to the
Dragon 2 class of reusable
22 GEOmedia n°3-2020
SPACE AND EARTH
spacecraft developed and
manufactured by American
aerospace manufacturer
SpaceX. Dragon 2 includes
two versions: Crew Dragon
(fig. 3), a capsule qualified
for manned missions, capable
of carrying up to seven
to 7 passengers to and
from Low Earth Orbit, and
Cargo Dragon, a robotic
vehicle that can bring more
than 3,000 kilograms to
the ISS.
The per-seat cost that
NASA will pay for
SpaceX's Crew Dragon
capsule is around $55
million, to be compared
with the about $86 million
currently paid for each
seat aboard Russia's threeperson
Soyuz spacecraft,
which has been astronauts'
only ride to and from the
ISS since NASA's space
shuttle fleet was grounded
in July 2011. With the
first commercial orbital
flight with crew on board,
and if the per-seat price is
further reduced, another
dream of NewSpace might
realize: that of commercial
space tourism. As a matter
of fact, SpaceX and Space
Adventures have already signed
a deal to launch up to
four passengers into Earth
orbit on a Crew Dragon
spacecraft by 2021.
Fig. 2 - SpaceX Crew Dragon automated docking with the ISS.
Author
Dr. Ing. Marco Lisi
ingmarcolisi@gmail.com
Independent Consultant
Aerospace & Defence
Fig. 3 - Crew Dragon physical dimensions
GEOmedia n°3-2020 23
MERCATO
24 GEOmedia n°1/2-2020
NEWS
ESA - Gulf of Kutch, India
September 06 2020
The Copernicus Sentinel-2 mission takes us over the Gulf
of Kutch – also known as the Gulf of Kachchh – an inlet of the
Arabian Sea, along the west coast of India. The Gulf of Kutch divides the
Kutch and the Kathiawar peninsula regions in the state of Gujarat. Reaching
eastward for around 150 km, the gulf varies in width from approximately 15 to 65
km. The area is renowned for extreme daily tides which often cover the lower lying areas
– comprising networks of creeks, wetlands and alluvial tidal flats in the interior region.
Gujarat is the largest salt producing state in India. Some of the white rectangles dotted around
the image are salt evaporation ponds which are often found in major salt-producing areas.
The arid climate in the region favours the evaporation of water from the salt ponds. Just north
of the area pictured here, lies the Great Rann of Kutch, a seasonal salt marsh located in the Thar
desert. The Rann is considered the largest salt desert in the world. The Gulf of Kutch has several
ports including Okha (at the entrance of the gulf), Mandvi, Bedi, and Kandla. Kandla, visible on
the northern peninsula in the left of the image, is one of the largest ports in India by volume of cargo
handled. The gulf is rich in marine biodiversity. Part of the southern coast of the Gulf of Kutch was
declared Marine Sanctuary and Marine National Park in 1980 and 1982 respectively – the first
marine conservatory established in India. The park covers an area of around 270 sq km, from Okha
in the south (not visible) to Jodiya. There are hundreds of species of coral in the park, as well as
algae, sponges and mangroves.
Copernicus Sentinel-2 is a two-satellite mission. Each satellite carries a high-resolution camera
that images Earth’s surface in 13 spectral bands. The mission’s frequent revisits over
the same area and high spatial resolution allow changes in water bodies to be closely
monitored.
This image was acquired on 4 April 2020.
Credits: European Space Agency
GEOmedia n°1/2-2020 25
REPORT
Disaster risk reduction and
reconstruction in Indonesia
with Earth Observation
by Vincenzo Massimi
Fig. 1 – Sulawesi Earthquake (Credits EU Civil Protection)
On September 28, 2018, a 7.5 magnitude earthquake struck the
island of Sulawesi, Indonesia. The epicentre was the provincial
capital of Palu, located on a bay on the island’s northwest
coast. The quake triggered a tsunami that swept 10-meter tall
waves of seawater and swamped the city. The combination
of the earthquake, tsunami, soil liquefaction and landslides
claimed well over 2000 lives, destroyed homes, buildings,
infrastructures and farmland in several districts.
Recognizing the need to relocate settlements from the
liquefaction-prone areas, the Indonesian government
developed the Master Plan for Recovery and Reconstruction for
Central Sulawesi through the EARR and SWIP projects.
Indra and Planetek Italia
contributed to the implementation
of this plan with a
batch of EO-based services. The
main information provided was
related to terrain deformation
mapping (before the earthquake)
followed by the update of
terrain information mapping
(in the months immediately
after the earthquake) and reconstruction
monitoring with Very
High Resolution images. The
collaboration went on with a
capacity-building workshop and
a knowledge transfer activity held
in Jakarta in June 2019 regarding
the technical aspects of the delivered
products and training sessions
for local users to teach them to
use the Geohazards Exploitation
Platform (GEP) of ESA.
The main purpose of the delivery
of the information products was
to help the local authorities better
understand the hazards associated
with seismic activity, flooding and
landslides, so they can make more
informed decisions in elaborating
a redevelopment master plan.
As noted during the workshop,
the terrain deformation maps
are helping the authorities in the
evaluation of the effects caused
by the disaster on the land surface
stability.
These activities were carried
out in the context of the
European Space Agency funded
project EO4SD DRR (EO for
Sustainable Development –
Disaster Risk Reduction). The
project was led by Indra, with
26 GEOmedia n°3-2020
REPORT
Planetek Italia, ZAMG, BRGM,
Gisat, Argans and Nazka as subcontractors.
All activites were carried out
in cooperation with the Asian
Development Bank and the
Indonesian National Institute of
Aeronautics and Space and involved
representatives from numerous
Indonesian institutions.
Supporting the disaster risk management
over the area affected
by the 2018 Sulawesi earthquake
with PS InSAR analysis
Planetek Italia provided the millimetric
measurements derived
from Synthetic Aperture Radar
(SAR) through the Persistent
Scatterers Interferometry (PSI)
technique. The PSI technique
exploits the SAR satellite images
to generate as output the ground
motion maps related to the periods
before and after the event of
2018.
Two different pre and post
event maps have been delivered
through the extremely intuitive
Business Intelligence visualization
tools of the Rheticus®
platform, to support the decision
makers that are involved in the
reconstruction activities in Palu.
Rheticus® is a geospatial platform
for massive Earth observation
data processing owned and operated
by Planetek Italia.
The two delivered maps are the
“ground motion” map and the
“buildings motion” map, and are
described in the following.
1) The pre- and post-earthquake
ground motion maps have
been delivered over wide spatial
areas covering the liquefaction
and landslides areas. The map
provides the movements – even
as small as few millimeters – of
each measured point (Persistent
Scatterers / Distributed
Scatterers) located on buildings
and infrastructure elements in the
urban and peri-urban zones as
shown in figure 3:
For each measured point (PS/
Fig. 2 - Palu, Indonesia. Map of the ground motion during the six months following the event.
DS), the web interface provides
a pop-up window (figure 4) that
shows the displacement detailed
information.
2) The “building motion” map
provides the level of concern on
each monitored element such as
buildings, roads and other infrastructures
on a monthly basis,
based on the ground motion map
(see figure 5). The map integrates
the ground/building motion
measurements described above
with the VHR images to monitor
the reconstruction stages. Doing
so, the Rheticus® platform delivered
regular monitoring of the
reconstruction status based on
the Very-High Resolution optical
satellite images and the classes of
motion of each single monitored
element (e.g. buildings) based on
the measurements of displacement
of the monitored elements
itself and their nearby areas. The
integrated information has been
delivered over the Palu area allowing
the characterization of the
movements of the wide areas and
of each single building based on
the PSI ground motion map and
to retrieve the reconstruction and
rehabilitation statistics based on
the interpretation of the VHR
satellite images.
In addition to these information
products, the project also
included a week-long course in
Jakarta organised by the Asian
Development Bank and the
Fig. 3 - Ground motion maps in Palu (pre vs post-earthquake 28/09/2018).
GEOmedia n°3-2020 27
REPORT
Fig. 4 - Example of one PS displacement (mm) over time computed through the PSI over Palu
area after the earthquake. In this figure it is possible to see all the geo-analytics and filtering
tools for the exploitation of the ground motion map.
Indonesian National Institute of
Aeronautics and Space. Attended
by more than 60 representatives
from numerous Indonesian institutions,
experts from Indra,
Planetek and BRGM explained
technical details, methodologies
and usage of these satellite data
products.
Representatives from the Asian
Development Bank noted: “Users
explained that they are particularly
interested in the ground deformation
maps – they offer great insight
into how the land surface has changed
and are essential for Indonesia
to redevelop effectively.”
The ground motion analysis
was performed through the
Rheticus® cloud platform, which
implements the SPINUA Multi-
28 GEOmedia n°3-2020
Fig. 5 - Palu® reconstruction monitoring service user interface with the integrated reconstruction
status and displacement information.
Temporal Interferometry algorithm
for SAR data processing.
The SPINUA processing chain
is developed by GAP srl, a spinoff
company of Politecnico di
Bari, Italy, in order to generate
ground motion maps. SPINUA
algorithm has been extensively
tested and validated in the past
20 years with long stacks of SAR
data (acquired in L, C and X
bands) with particular attention
to research activities aimed at
improving the state of the art of
SAR techniques. These activities
are carried out in collaboration
with academic and research
institutions. As documented in
the scientific literature, SPINUA
represents one of the first and
effective solutions for multitemporal
SAR interferometry.
SPINUA is based on Persistent
Scatterers and Distributed
Scatterers Interferometry relying
on the identification and monitoring
of single objects (PS) or areas
(DS) that remain highly coherent
through time.
The Rheticus platform is a multitenant
high level performing
cloud-computing platform for
the automatic massive processing
of long-time series satellite
data, retrieved directly thanks
to the API connection to the
satellite providers (e.g. ESA API
Hub Access). The high level of
automation along with a dedicated
detailed logging and alert
system allows an easy monitoring
of the processing chain status.
Rheticus output is also available
in Machine to Machine mode
(M2M) via standard exchange
protocols (e.g. WMS), making
the platform an information hub
that delivers content to other
online systems. Export capabilities
of data and information are
also available, allowing users to
download products in standard
formats, and facilitating their
exploitation in other external application
environments.
KEYWORDS
earthquake; risk; EO based services; monitoring; rheticus;
cloud-computing; automatic processing; data satellite
ABSTRACT
On September 28,2018, a 7.5 magnitude earthquakestruckthe
island of Sulawesi, Indonesia. The epicentre was the provincial
capital of Palu, located on a bay on the island’s northwest coast. The
quake triggered a tsunami that swept 10-meter tallwavesof seawater
and swamped the city. The combination of the earthquake,
tsunami, soil liquefaction and landslides claimed well over 2000
lives, destroyed homes, buildings, infrastructuresand farmland
in several districts.Recognizing the need to relocate settlements
from the liquefaction-prone areas, the Indonesiangovernment
developed the Master Plan for Recovery and Reconstruction for
Central Sulawesi through the EARR and SWIP projects.
Indra and Planetek Italia contributed to the implementation of
this plan with a batch of EO-based services. The main information
provided was related toterrain deformation mapping (before
the earthquake)followed by the update of terrain information
mapping (in the months immediately after the earthquake)and
reconstruction monitoring with Very High Resolution images.
The collaboration went onwith a capacity-building workshop
and aknowledge transfer activity held in Jakarta in June 2019
regarding the technical aspects of the delivered products andtraining
sessionsfor local users to teach them to use the Geohazards
Exploitation Platform (GEP) of ESA.
AUTHOR
Vincenzo Massimi
RheticusTechnicalSpecialist
vincenzo.massimi@planetekitalia.it
Planetek Italia
Angelo Amodio (Planetek Italia) Angel Utanda,
Alberto Alonso (Indra Sistemas), Philippe Bally (ESA),
Paolo Manunta (ESA/ADB),
Davide Nitti, Raffaele Nutricato (GAP)
REPORT
BIM PER LE INFRASTRUTTURE
Reinventa le Infrastructure
▸ Reality Capture e modellazione contestuale
▸ Design automation e Collaborazione
▸ Progettazione virtuale e costruzioni
Inizia il tuo viaggio BIM:
www.autodesk.it/solutions/bim/explore-civil-infrastructure
Autodesk, the Autodesk logo, AutoCAD, Civil 3D, InfraWorks, and Revit are registered trademarks or trademarks of Autodesk, Inc., and/or its subsidiaries
and/or affiliates in the USA and/or other countries. All other brand names, product names, or trademarks belong to their respective holders. Autodesk
reserves the right to alter product and services offerings, and specifications and pricing at any time without notice, and is notresponsible GEOmedia for n°3-2020 typographical 29
or graphical errors that may appear in this document. ©2020 Autodesk, Inc. All rights reserved.
AUGMENTED REALITY
GARTNER CONFIRMS THE AUGMENTED REALITY
IN THE TOP TEN OF THE MAIN TECHNOLOGICAL
TRENDS, WHILE THE INTERACTIVE HOLOGRAPHIC
VISUALIZATION TECHNIQUE BEGINS TO
EXPERIMENT WITH INNOVATIVE AND INTERESTING
IMPLEMENTATION PROCEDURES.
XR 2020:
News & Events
by Tiziana Primavera
Innovative Tech
Evangelist - AR/VR
senior expert
To date, the market for interactive
visual technologies
is certainly rapidly growing, a
decade has passed since the first
curves of Hype (The Hype Cycle
model is a methodology developed
by Gartner, an information
technology consultancy, research
and analysis firm, to graphically
represent the maturity, adoption
and application of specific
technologies.), which described
the likely trend of the technologies,
at the pioneering and progressive
times (Fig. 1).
Undoubtedly confirming what
he had described, currently in
his Top Ten, concerning upcoming
trends in the technology
sector, Gartner outlines an evolutionary
overview of possible
scenarios and includes an interesting
development that specifically
characterizes augmented
reality.
In fact, this technology, today
definitely matured from the
point of view of hardware and
software, is used in many sectors,
to induce a sensory overcoming
- from this specific point of view,
it is possible to make a classification
of contemporary technologies
covering the following
categories:sensory (hearing,
vision, perception); (exoskeletons,
prostheses); (implants for
the treatment of seizures); gene
therapy and cell therapy - expanding,
improving experiences of
a human or physical cognitive
nature.
Its recent and possible integration
with artificial intelligence,
also makes it ready for a considerable
overcoming of the current
limits currently experienced, to
project itself towards new interesting
and sophisticated application
frontiers (Fig. 2).
The possible impacts in the
production sectors and social
life, the possible behavioral repercussions
in daily life or in the
business sectors make augmented
reality as one of the top 10
technological trends identified
by therefore mentioned consultancy/analysis
for the next 5-10
years.
Today, major international players
are aiming for a progressive
and growing democratization of
AR (AR stands for “augmented
reality) technology, simplifying
and not only significantly improving
development and implementation
procedures and tools
for developers or end users.
In fact, we are witnessing the
recent phenomenon of the integration
of AR systems, also of
the "easy to use" type, all within
socially well-known applications,
(e.g. Instagram, Snapchat) or
Fig. 1 – A) Schematization of the Hype Cycle, which characterizes the main stages of evolution of each technology. B) Interesting to observe that in 2009 augmented
reality began its rise progressively, and was classified as one of those technologies destined to become mainstream over a period of about 5-10 years.
30 GEOmedia n°3-2020
AUGMENTED REALITY
basic applications dedicated to
productivity, such as Teamviewer
pilot, which, relying on its own
relevant global market of about 2
billion installations, has therefore
distorted the concept of remote
assistance, ensuring a highly progressive
image in line with new
functional needs.
Using SLAM, Simultaneous
Localization and Mapping
technology, the application allows
spatial reconstruction of
the surrounding environment
to allow you to locate the objects
placed in it.
This allows operators no longer
only mirroring video streams,
but also the ability to highlight
objects and/or supersede indicative
arrows, to facilitate the
understanding of the maintenance
procedure for those who are
carrying out the assistance work.
All this is easy without having
special programming skills or relevant
to the sector (Figg. 3-4).
But if you turn your attention
to the most complex functional
scenarios, you can in a custom
taylor perspective, witness
countless more articulate and
complex augmented reality applications,
designed to increase
safety or productivity in different
industries, to improve the ability
to make decisions in a reduced
time with the help of information
related to the context of use.
In fact, there are many AR/VR
systems developed internationally
in professional fields in the
health sectors - with diagnostic
imaging it is possible to reconstruct
the physiological anatomy
of sick organs of a single patient
e.g. eyeball / brain / spine etc..),
and thanks to the over-imposition
of such three-dimensional
data in Mixed Reality during the
intervention, with an accurate
real-virtual collimation, it is
possible to proceed with surgeries
with special awareness and
operational precision. In some
Fig. 2 - Real-time detection, vision systems able to "detect" thefruits and understand the degree of maturity in order
to be collected, even in environmental contexts in rather complex and artificial environments.
areas, the surgery is even assigned
to robotic-guided femtosecond
lasers, able to recognize
the characteristics and be able to
proceed to the custom surgery.
(surgical optics) - AEC, Cultural
Heritage, marketing/ADV or
training contexts, just to name a
few or to improve learning and
considerably improve cognitive
processes in the areas of training
and/or training on the job.
One aspect that concerns this
progressive and utilitarian mainstream
adoption is that it inevitably
has several implications of a
not only cultural but also ethical
nature.
On the other hand, it is clear
that research, innovation has
Figg. 3-4 Land images show the ability to communicate interactively with maintenance staff by marking points of
interest or inserting explanatory arrows remotely (Teamviewer pilot).
GEOmedia n°3-2020 31
AUGMENTED REALITY
considerably faster times than
governments in legislating in
this regard, and international
alignment is desirable in order
to balance development opportunities
and side risks inherently
associated with the social introduction
of each new technology.
Sensitive issues recently discussed
by the CEO of Google in
Brussels.
Next-generation interactive
holograms open new paths to
visual research
Alongside an advanced stage
inherent in the Mixed Reality
sector, it is interesting at the
same time to observe the first
steps of extremely innovative
research, aimed at pursuing
the perceptual increase of reality,
thanks to the creation of
three-dimensional interactive
holograms generated with an
innovative calculation procedure,
extremely faster and manageable
with not particularly powerful
hardware.
The new algorithms make it possible
to significantly reduce the
processing of three-dimensional
data, paving the way for nextgeneration
augmented reality
devices.
The academic research team
(Takashi Nishitsuji, Tomoyoshi
Shimobaba, Takashi Kakue e
Tomoyoshi Itoha) found that
a complete rendering of 3D
polygons for all applications was
unnecessary, and focused exclusively
on the three-dimensional
representation of the edges, it
was able to significantly reduce
the computational load of hologram
calculations (Holography is
an optical technology of storing
visual information in the form
of a very fine interweaving of
interference fringes with the use
of coherent, properly projected
laser light; the image created by
the interference fringes is characterized
by an illusion of threedimensionality).
The method is extremely fast,
56 times faster than conventional
algorithms, but above all it
significantly lowers the computational
load and does not require
a responsible graphics processing
unit (GPU).
Essentially, faster calculations on
simpler cores translate into the
possibility of using lighter, more
compact and, above all, energyefficient
devices, which for these
specificities can be used in a wider
range of applications.
It is therefore hypothesized versatile
heads-up display (HUD)
on the windshields of cars/aircraft/ships
in support of their
driving or new near-eye devices
(NED)capable of transmitting
instructions on technical procedures.
This is a first step in the frontier
of traditional holographic
research to support AR, reminiscent
of the first wireframe
export trials of digital artifacts
in AR more than a decade ago,
but certainly these new technologies
of classical holography
will also evolve and contribute
to characterize new perceptual
modes of the space around us,
which will be permeated by new
interpretative semantics or new
features, certainly different and
broader in its experiential meanings
from how we have perceived
it to date.
32 GEOmedia n°3-2020
GeoMax Zenith35 Tilt & Go
GNSS Receiver
Tilt & Go
For decades, GNSS users have been
constrained by keeping their pole
strictly vertical. A corner of a building
or even a gully under a parked car?
With the new GeoMax Zenith35 Tilt
& Go, you can measure points where
satellite signals are blocked by eaves
or canopies. Enjoy the flexibility of
Zenith35 GNSS with unique Tilt & Go
functionality with up to 30° tilt.
30°
START TODAY
Contact us and learn more
about the Zenith35 TAG.
www.geomax-positioning.us
works when you do
REPORT
Control and monitoring of the
Znosko Glacier in Antarctica
by Fabian Brondi Rueda, Gabriele Garnero, Giovanni Righetti, Stefano Serafini
Fig. 1 - Location of the area (j=62° 06’ S, l= 58° 28’ W)
Since the 1990s, Peru’s IGN (Instituto Geográfico Nacional)
has carried out intensive documentation and monitoring
activities in the Antarctic territories. During the last few years,
these activities have focused on the Znosko glacier.
The importance of this project is based on the generation of
correct digital elevation models (DEM).
In fact, a correct geodesic setting allows to obtain high
resolution geospatial products. These inputs represent the
fundamental support for the study of the glacial mass balance
by institutions such as ANA (Autoridad Nacional del Agua) and
INAIGEN (Instituto Nacional de Investigación en Glaciares y
Ecosistemas de Montaña).
This paper clarifies survey activities carried out so far, analysis
and results achieved, and perspectives for next missions.
Monitoring activities were carried out in an international
cooperation context, involving the Instituto Geográfico
Nacional (PE) and MEDS AMSTERDAM BV Society (NE) under
the scientific supervision of Politecnico di Torino (ITA).
The Instituto Geográfico
Nacional activity in Antarctica
The Instituto Geografico Nacional,
as head of geospatial information
in Peru, collaborated
with the other participating institutions,
providing them technical-cartographic
support during
the development of research
projects. During this collaboration,
topographic maps were
generated in the areas adjacent
to the Machu Picchu Science
Station.
The missions covered various
scientific aspects, such as:
4environmental factors regulating
the distribution of bentonite
organisms;
4sampling of ice coring for the
measurement of environmental
isotopes;
4study of the potential of Antarctic
lichens as indicators of
climate change;
4geomorphology and glacial
assessment of Punta Crepín;
4macro-algae acquisition and
their dehydration.
34 GEOmedia n°3-2020
REPORT
Fig. 2 - The environment
of Znosko Glacier.
Fig. 3 - Passive geodesic network of the IGN in Antarctica.
Area
Sup. ha
Znosko 900
Langer 400
Wiracocha 1000
Monte Flora 200
Petrel gigante 135
Tab. 1 – Survey areas and extensions
The ongoing climate changes
have pushed research groups,
such as ANA and the Servicio
Nacional de Meteorología and
Hidrología del Perú; to generate
geospatial information on the
Znosko glacier.
Znosko Glacier
Znosko glacier is located in the
southern Shetland Islands, in
territories claimed by Argentina,
Chile and UK.
Located at an average altitude
of 22 m above sea level, the terrain
around the glacier is hilly:
highest nearby point is Admiral
Peak, 305 meters above sea level,
located 1.3 kilometers south the
glacier.
This territory is not anthropized,
in fact the nearest inhabited locality
is the Brazilian station
Commandante Ferraz, about
5 kilometers east of the glacier,
and the Peruvian station Machu
Picchu.
Gen-19 Feb-20 Difference Displacement
ELEV.
ELEV.
ELEV.
NAME East North
GEOID East North
GEOID East North
GEOID DIST. DIREC.
ANTAR XXVI 1 423421.479 3116628.701 4.098 423421.485 3116628.684 4.092 -0.006 0.017 0.006 0.018 SE
ANTAR XXVI 2 425890.704 3117550.113 10.061 425890.700 3117550.118 10.102 0.004 -0.005 -0.041 0.006 NW
ANTAR XXVI 3 425656.967 3115914.359 40.038 425656.967 3115914.351 40.032 0.000 0.008 0.006 0.008 S
ANTAR XXVI 4 430017.689 3116142.604 17.882 430017.693 3116142.609 17.898 -0.004 -0.005 -0.016 0.006 NE
ANTAR XXVI 5 431716.898 3116130.278 2.504 431716.882 3116130.282 2.503 0.016 -0.004 0.001 0.016 NE
ANTAR XXVI 6 430628.472 3113947.196 11.212 430628.470 3113947.203 11.213 0.002 -0.007 -0.001 0.007 NW
ANTAR XXVI 7 427494.726 3110835.728 37.729 427494.739 3110835.725 37.734 -0.013 0.003 -0.005 0.013 SE
ANTAR XXVI 8 422688.250 3110417.789 9.988 422688.264 3110417.784 9.981 -0.014 0.005 0.007 0.018 SE
TUM01 423494.774 3113442.19 41.393 423494.698 3113442.2 41.47 0.076 -0.007 -0.077 0.076 NW
Tab. 2 – The IGN passive network
GEOmedia n°3-2020 35
REPORT
the order of 2.5-3 hours each,
useful for evaluating the overall
stability of the area and the tectonic
movements of these plates.
Interpretation of data in this
table, currently drafted in UTM
SIRGAS-ROU98 zone 21E coordinates,
reveals a significant
movement of all points; among
these, the TUM01 summit in
particular has a translation of
over 7 cm in one year only.
For example, Italy has a global
movement of the order of 3 cm/
year in the direction N-NE,
which decreases to 2-3 mm/year
if assessed with European references,
with different orientations
depending on the tectonic
micro-plates.
The interest so far aroused by the
evidence of these movements
suggests rescheduling the execution
of the measures for the next
five years, in order to evaluate
with increased accuracy detected
data. Eventually new coordinates
will be included into the
global reference system IGS14.
Fig. 4 – RTK Survey Antar XXVII - Training set (green dots, 70%) and Test set (red triangles, 30%).
Monitoring of the Znosko glacier:
Missions XXVI and XXVII
Missions XXVI and XXVII were
carried out respectively in January
2019 and February 2020.
They involved, in addition to
the Znosko glacier, also other areas
subject to photogrammetric
survey to create a digital model
and orthoimages (Table 1).
Overall stability check
In the last 2 years, a passive
monitoring network has been
set up covering 9 points, among
which were measured with static
geodetic measurements some
baselines with observations of
Glaciers geometries evaluation
To evaluate the geometry of the
glacier and therefore estimate the
involved volumes, it was considered
appropriate to use only the
basic data obtained from GNSS
measurements in RTK mode.
In fact, there are reliability problems,
in using autocorrelation of
images mostly occupied by ice,
and therefore devoid of recognizable
textures and elements.
Altitude profiles with an average
wheelbase of around seventy
meters were used, these were
obtained in the 2019 (Antar
XXVI) and 2020 (Antar XXVII)
campaigns.
Differential corrections were
performed, using a pair of
points near the detection area,
resting on the ASTA reference
vertex positioned near the flagpole
of the Machu Picchu base.
Fig. 5 - Digital model and altimetric contour lines variations between the XXVI and XXVII campaigns.
36 GEOmedia n°3-2020
REPORT
Fig. 6 - Comparisons between the situations 2019 (A) and 2020 (B).
Interpolator model estimating
In order to identify the optimal
interpolator model based on distribution
of points and conformation
of soil, it was decided to
proceed with an estimate of the
residues derived from the application
of different interpolating
models, based on previous research
experiences.
A subset of data training (70%
of the total) -only for the dataset
constituted by RTK points,
obtained in February 2020 for
a total of 1406- was selected,
while the remaining part was
considered as a test.
The models used were the following:
4IDW with exponent 2;
4Kriging with spherical semivariogram;
4Spline with smoothing of
both the surface and the first
derivative, all with a minimum
number of 12 points.
Synthetic results are reported
in Table 3.
Fig. 7 - Comparisons between the situations 2019 (A) and 2020 (B) for the NE zone of Figure 6.
GEOmedia n°3-2020 37
REPORT
IDW Kriging Spline
Media -0.291 -0.135 0.048
Varianza 2.530 0.459 0.632
Max_Ass 3.032 1.065 5.464
Tab. 3 – Residuals on the different interpolator models.
Based on the evaluated residues,
it was preferred to operate
using the Kriging algorithm
on all available datasets.
Ablation analysis
(2020 vs 2019)
The altimetric differences estimation,
highlights a discrete
variability of the snow surface.
This variable becomes
important if assessed in relation
to the short period of time
elapsed between the two findings
(13 months). The ablation
is significant on the whole area
subject to RTK investigations,
with average values in the order
of 4-5 meters.
Significant area variations were
also found.
Fig. 6 shows the variation between
the ortho-image of the
2019 and 2020 campaigns:
In this, the digitization performed
on the basis of the orthophoto
of the year 2020 (B),
is compared with the orthophoto
of the year 2019 (A).
This simple analysis highlights
the retreat of the ice (the mixed
land-ice areas are highlighted
with a dotted background).
The difference mentioned
above, in linear terms, in various
cases reaches hundreds of
meters.
When considering the uncovered
terrain, less significant
differences are observed, especially
when compared with
the phenomenon previously
described.
An interesting detail is easily
appreciated in the North-West
area (Fig. 7), in this, the limits
of the frozen area, (highlighted
by the arrow), show an advance
of the surface towards
the sea, a sign of an evident
spillage phenomenon.
This collapse affects a large
area with an advancement of
the front of about 70 m.
Future projections
This surfaces study, highlights
a huge decrease in the ice mass
during the year 2020 compared
to the year 2019, and in
the same period a significant
process of the transfer into the
sea, probable consequence of a
glacial collapse.
As mentioned above, given
the obvious limitations of the
DEM models derived from
photogrammetry, only the
RTK survey was used for model
generation.
While representing a robust
methodology, going through
glaciers by foot with geodesic
tools has at least three critical
issues:
4not adequate for the analysis
of large extensions;
4difficult to repeat due to the
hostility of the surrounding
environment;
4high risk for the safety of the
personnel involved in the execution
of the survey.
The hope is to overcome the
limitations and problems mentioned
above in the coming
campaigns, through the integration
of LiDAR systems to
be used in the analysis of larger
surfaces.
Acknowledgments
The authors thank General de
Brigada Fernando PORTILLO
ROMERO, Jefe of the Instituto
Geográfico Nacional of Peru.
REFERENCES
GARNERO, G.; GODONE, D.
(2013) Comparisons between different
interpolation techniques, The International
Archives of the Photogrammetry,
Remote Sensing and Spatial Information
Sciences, Volume XL-5/W3 (ISSN: 2194-
9034), Pagg. 139-144 [DOI: 10.5194/
isprsarchives-XL-5-W3-139-2013,
WOS:000358309600021, SCOPUS:
2-s2.0-84924290459].
MOTTA, M.; DIOLAIUTI, G.; VAS-
SENA, G.; SMIRAGLIA, C. (2003) Mass
balance and Energy balance at Strandline
Glacier (Terra Nova Bay, Antarctica):
Methods and preliminary results, Proceedings
of the 4th Meeting on Italian Antarctic
Glaciology, Terra Antarctica reports n.8,
Editors: Massimo Frezzotti & Valter Maggi,
pp. 21-28, Siena.
WEBGRAPHY
https://www.enea.it/it/seguici/pubblicazioni/pdf-volumi/2019/xxxiv_spedizione_
antartide.pdf
https://elcomercio.pe/tecnologia/ciencias/
comercio-antartida-retroceso-glaciarznosko-noticia-611907-noticia/
https://www.cnbc.com/2020/04/30/
climate-change-antarctica-greenland-ice-
melt-raised-sea-levels-by-half-inch-in-last-
16-years.html
https://www.theguardian.com/environment/2020/mar/11/polar-ice-caps-meltingsix-times-faster-than-in-1990s
https://www.scientificamerican.com/article/
heres-how-much-ice-antarctica-is-losingmdash-its-a-lot1/
https://climate.nasa.gov/vital-signs/icesheets/
KEYWORDS
Antarctica; survey; geodesic network;
geospatial; DEM; glacial mass balance
ABSTRACT
The study and analysis of climate change
is a global challenge against which environmental,
but also economic and social
changes, will be measured.
This memorandum illustrates the recent
activities carried out by the IGN Peru in
collaboration with European institutions.
AUTHOR
Fabian Brondi Rueda
fabianbrondi@hotmail.com
IGN - Instituto Geográfico Nacional,
Lima (PE)
Gabriele Garnero
gabriele.garnero@unito.it
DIST – Politecnico e Università degli
Studi di Torino (ITA)
Giovanni Righetti
g.righetti@medsamsterdam.eu
Stefano Serafini
s.serafini@medsamsterdam.eu
MEDS BV – Hengelo (NL)
38 GEOmedia n°3-2020
REPORT
Blending the Science of Geography
and Technology of GIS
www.esriitalia.it
GEOmedia n°3-2020 39
MERCATO
CELEBRATING
100 YEARS
SOKKIA.COM
40 GEOmedia n°1/2-2020
MAKING AQUACULTURE
MORE SUSTAINABLE AND
EFFICIENT WITH RHETICUS
AQUACULTURE
Is there a connection between aquaculture,
climate change and satellite Earth
Observation?
Fish and seafood play a significant role
in the human diet and represent a very
important source of protein. About
20% of the world’s population takes at
least 20% of animal protein from fish.
According to the FAO, human population
growth is expected to rise fish consumption
by around 1.2% per year over
the next ten years. By 2030, the production
of fish and seafood products is expected
to exceed 200 million tons compared
to the current world catch fishing
production of around 90-95 million
tons per year. In addition, today about
a third of fish resources are exposed to
excessive exploitation, and this lead to
the definition of the United Nations
2030 Agenda – Goal 14 “Conserve and
sustainably use the oceans, seas and marine
resources”.
Aquaculture represents the optimal solution
to ensure the production of fish
and shellfish necessary to meet global
needs. However, effective and sustainable
management of aquaculture sites
requires improvement of technologies
and production processes. Nonetheless,
fish and shellfish farms need to adapt
their farming techniques to the environmental
context, the habitat in which
animals live. Temperature, chlorophyll
and turbidity of marine waters significantly
affect the growth rate and health
of animals.
Climate changes have led to changes in
the sea temperature and in the quantities
of phytoplankton, factors that affect
the growth rates and mortality of animals
and, therefore, the productivity of
farms and the quality of products.
It is clear that a deeper knowledge of
these variables is fundamental for achieving
an optimized farm management.
An extraordinary source of information
comes, today, from Earth observation
satellites. Their data allow to carefully
estimate multiple parameters such as
sea temperature, chlorophyll concentration
(proxy of the presence of phytoplankton)
and water turbidity (proxy of
water quality).
Over the last 25 years, Planetek Italia has
gained great expertise in this field thanks
toseveral European Space Agency (ESA)
and European Commission research
programs, such as “Integrated Coastal
Water Management for MED (ICWM
for MED)”, “SAtellite Near Real Time
Monitoring Network (SAIMON)” and
“Marine-EO” projects, to name the latest.
As part of the European project “User
uptake activities Copernicus Marine
Environment Service (CMEMS) –
Promoting demonstrations of CMEMS
downstream services.”, coordinated by
Mercator Ocean, Planetek has furthermore
enhanced Copernicus CMEMS
data and services, creating an innovative
platform called Rheticus® providing ondemand
geoanalytics services specifically
designed for Environmental Reporting,
Maritime Engineering, as well as fishing
and aquaculture activities.
All these experiences have contributed
to the development of Rheticus®
Aquaculture service, specifically designed
for the management of mussel farming
sites. The service was developed
by Planetek Italia in partnership with
Bluefarm s.r.l. to provide mussel farmers
with a weekly digital bulletin of updated
information on trends of sea temperature
and chlorophyll, on growth rate
of molluscs, as well as growth trends
compared with past ones. The service
also provides an estimate of the optimal
harvesting time and expected volume of
productions.
Thanks to an agreement with the
Mediterranean Aquaculture Association
(AMA), 23 aquaculture sites distributed
along Italian coasts are using Rheticus®
Aquaculture to support the operational
management of mussel farms. The first
results of the initiative were presented in
a workshop organized last 20 February
2020 during the Aquafarm fair in
Pordenone.
The workshop confirmed a great interest
of farmers to receive constantly
updated information, useful for the
optimal management of their sites in a
typical Industry 4.0 logic suited to the
aquaculture sector. Among many emerged
ideas, there was a growing interest
in extending the service to other species
such as oysters, which are finding widespread
use in Italian seas.
https://www.geoforall.it/kfy88
TELERILEVAMENTO
NEWS
THE NEW FACE OF THE RHETICUS
NETWORK ALERT EDITION 2020 IS UP!
We are excited to announce the launch of the new
Rheticus® Network Alert version, designed to enhance
your browsing experience, with brand new tools helping
users to prioritize inspection activities.
Rheticus® Network Alert is a turnkey vertical web service
for the continuous monitoring of instability phenomena
affecting pipeline networks (water and sewage) in urban
areas, caused by ground displacement. The service helps
to highlight problems before they become critical by
pointing out locations of concern.
The information is updated and delivered to utility
companies with extremely intuitive Business Intelligence
tools to add dynamic analysis and new features to their
planning, management and maintenance activities.
The Rheticus® Network Alert 2020 user interface is the
result of a design process, which includes the user interface
experience and the analysis of specific information
needs of Rheticus clients around the globe, and notably
of multi-utility pipeline maintenance managers.
The new tools allow users to Identify scores (segments)
with highest likelihood of failure in order to prioritize
inspection activities before major events occur.
With the new “Inspection Priority Score” tool, each segment
of the network has an Inspection Priority Score,
ranging between 0 and 1. The greater Inspection Priority
Score, the greater level of concern. Through a dynamic
window, it is possible to select a particular range of
Inspection Priority Score and, consequently, the related
segments having a score belonging to the selected range.
Further clicking over each segment, a pop-up window
shows all information related to the selected segment:
4Segment ID;
4Address and geographic coordinates (latitude, longitude);
4Segment Status;
4Velocity (mm/year);
4Acceleration (mm/year2);
4Distance of the critical PS2 from the segment (m);
4Inspection Priority Score.
Finally, in order to get all the information in more details,
the new Rheticus® Network Alert edition also offers a detailed
report that is available on the table at the bottom
left-side of the web interface. The table provides users
with the following information: Segment ID, Address,
Segment Status, Velocity (mm/year), Acceleration (mm/
year2), Inspection Priority Score, Zoom-to-Feature tool,
sorted by Network Status.
https://www.geoforall.it/kfy8q
MONITORAGGIO 3D
GIS E WEBGIS
www.gter.it
info@gter.it
GNSS
FORMAZIONE
GEOmedia n°1/2-2020 41
RICERCA E INNOVAZIONE
AEROFOTOTECA
L’AEROFOTOTECA
NAZIONALE
RACCONTA....
The Role of the Air
Photographic Archive at the
ICCD in Interpreting the
Archaeology of the Tiber Delta
and the Isola Sacra
by Kristian Strutt
Between 1998 and 2012, the
Portus Project investigated the
archaeology of Rome’s Imperial
port and its surrounding
area through archaeological
fieldwork. The project, directed
by Prof. Simon Keay at the
Department of Archaeology,
University of Southampton,
was a collaborative effort involving
the Universities of
Southampton and Cambridge,
the British School at Rome and
the Parco Archeologico di Ostia
Antica together with other organisations.
A significant portion
of the project work in the field
consisted of non-intrusive archaeological
survey, comprising
geophysical survey (Fig. 1),
fieldwalking and topographic
survey (Fig.2). The first years
of the project (1998-2004)
consisted of geophysical survey
and fieldwalking around Portus
and the environs of the Imperial
port (the results of which are
published in Keay et al. 2005).
Subsequent survey (2008-2012)
was also conducted in the area
between Portus and Ostia
Antica, the Isola Sacra, to investigate
the nature and extent of
the archaeological remains linking
Portus to the city of Ostia
(results of the Isola Sacra survey
are due for publication this
summer in Keay et al. forthcoming).
The project covered
much of the overall landscape
with geophysical survey (Fig.
3), and the work provided an
opportunity for utilising an integrated
approach to landscape
Fig. 1 - Fluxgate gradiometer magnetometry being carried out on the Isola Sacra (photo:
K. Strutt).
archaeology, drawing not only
on the main field methods used
in the profession, but using
other datasets available from archive
sources, including satellite
imagery, LiDAR and archaeological
database entries, work
which also formed the basis of
the author’s doctoral research
(Strutt 2019). Use of archive
data also provided the opportunity
to access and analyse the air
photographs held by the ICCD,
providing the most useful dataset
for the archive-based analytical
work, and results crucial to
the full interpretation of the
archaeology between Portus and
Ostia.
Previous Use of Air Photos in
the Tiber Delta
The use of air photographic
images for archaeology is not
Fig. 2 - Topographic survey being conducted using a GPS with base station and rover (photo:
K. Strutt).
42 GEOmedia n°3-2020
AEROFOTOTECA
new, with pioneering work
being conducted in the first
years of the 20 th century in
particular (Crawford 1928;
Crawford and Keiller 1928;
Guaitoli 2003), and a balloon
flight forming the basis of
early aerial photographs of the
ancient city of Ostia in 1911
(Shepherd 2006). The nature
of the development of aerial
photography, and in particular
the advent of the technique for
military use, meant significant
developments in the technology.
The intense action in the
Mediterranean during World
War II also meant that a large
number of photographs were taken
by different air forces, principally
the Luftwaffe, the Royal
Air Force and US Airforce
(Shepherd 2013; 2013a).
The location of the Tiber delta
and Portus means that the area
formed the focus of intensive
reconnaissance photography
during WWII, much of which
has been deposited at the
ICCD. The photographs were
taken from different altitudes,
under different lighting conditions,
and at different times of
the year, allowing the researcher
to analyse material under varying
ground conditions, where
sub-surface archaeology may
show up only in certain seasons
or under particular crops.
These air photographs in the
area of the Tiber delta formed
the focus in some of Bradford’s
(1957) work, demonstrating the
form of the Trajanic Harbour
at Portus and the associated
Claudian Canal. The approach
devised by the Portus Project in
reassessing this landscape also
provided an opportunity to
integrate the air photographic
records held at the ICCD.
The Portus Project and the
Survey of the Isola Sacra
The primary use of the air photographs
from the Aerofototeca
at the ICCD was to secure
high and low altitude photographs
for the area surrounding
Portus. Different swathes of
photography, digitised in the
archive, were geo-referenced
using ArcGIS software, to form
a background of air photos for
the project (Fig. 4). Many of
the archaeological features in
the vicinity of Portus showed
in these images, in which the
RAF photos were used. Features
showing in the photographs
were digitised, allowing the
overlay of these features with
our geophysical survey interpretations.
These, together
with the interpretations of
satellite imagery, overlaid with
data from the archaeological
gazetteer, formed the basis of
the analysis and interpretation
of the landscape (Keay et al.
2005; Keay et al. 2014; 2014a;
Keay et al. forthcoming; Strutt
2019).
While this methodology provided
contextual information on
a number of sites and features
in this landscape, many showed
both in the results of the geophysical
survey and in the air
photographs. One particular
Fig. 3 - Coverage of geophysics for the area of Portus and the
Isola Sacra, showing the magnetometry and the large-scale
landscape approach taken by the research.
example illustrates the absolute
necessity of integrating the historic
air photographs with the
project survey data. Our survey
of the Isola Sacra had provided
Fig. 4 - A composite of RAF air photographs from the Aerofototeca of the ICCD.
GEOmedia n°3-2020 43
AEROFOTOTECA
evidence of a possible ancient
canal crossing the area between
Portus and Ostia (Keay et al.
2011). As the survey progressed
it was not always possible to
gain access to survey particular
areas of the landscape. Analysis
of modern satellite imagery
proved that much of the survey
area had been built on in the
latter part of the 20th century.
It was to the historic air photographs
that the project team
turned in an effort to glean as
much evidence of the archaeology
as possible. The RAF
photographs showed very little
on the Isola Sacra, in direct
contrast to the area around
Portus. However, investigation
of the photographs taken by
Fig. 5 - Photograph taken by the Aeronautica Militare (AM_1957_149_1_23_62640_0 a) showing
Portus, Ostia and the Isola Sacra. It is these photos that show, faintly, the line of the Roman canal
across the Isola Sacra.
Fig. 6 - Composite image with the results of the magnetometry overlaid on the
Aeronautica Militare air photo, showing the coverage of the geophysics, and how
the tracing of the east side of the canal would not have been possible without integrating
methods.
the Aeronautica Militare in
1957 revealed photographs that
indicated a faint linear feature
across the study area (Fig. 5).
As the survey progressed on the
ground, the results of the magnetometry
were integrated in
our GIS with the images taken
by the Aeronautica Militare,
showing that the feature marked
the eastern side of an ancient
Roman canal, traversing the
Isola Sacra from Portus to the
bank of the Tiber opposite
Ostia. Varying access to land
meant that much of this area
could not be surveyed, and thus
the air photographs formed
a critical component of the
analysis and interpretation for
the archaeology of the area (Fig.
6).
The archives of the Aerofototeca
at the ICCD proved crucial to
the full analysis of this important
archaeological landscape,
and the combination of different
techniques provided a
strong methodological approach
to the study of the area.
44 GEOmedia n°3-2020
AEROFOTOTECA
REFERENCES
Bradford, J.S.P. (1957), Ancient Landscapes: Studies in Field Archaeology. London; G. Bell and Sons.
Crawford, O. G. S. (1928) Air Survey and Archaeology. Norwich: Ordnance Survey.
Crawford, O. G. S. and Keiller, A. (1928) Wessex from the Air. Oxford: Clarendon Press.
Guaitoli, M. (2003) Lo sguardo di Icaro. Le collezioni dell’Aerofototeca Nazionale per la conoscenza del territorio. Roma: Campisano.
Keay, S., Millett, M., Paroli, L. and Strutt, K. (2005) Portus. London: The British School at Rome and Soprintendenza Archeologica di Ostia.
Keay, S., Millett, M. and Strutt, K. (2014) ‘The canal system and Tiber delta at Portus.
Assessing the nature of man-made waterways and their relationship with the natural environment’, Water History, 6(1), 11–30.
Keay, S., Parcak, S. and Strutt, K. (2014a) ‘High resolution space and ground-based remote sensing and implications for landscape archaeology: the case from
Portus, Italy’, Journal of Archaeological Science, 52, 277–292.
Shepherd, E. J. (2006) ‘Il “Rilievo Topofotografico di Ostia dal Pallone” (1911)’, Archeologia Aerea 2,15–38.
Shepherd, E. J., Leone, G., Negri, A. and Palazzi, D. (2013) La collezione aerofotografica British School at Rome (BSR) conservata in ICCD-Aerofototeca
Nazionale (AFN). Report 2013 sullo stato di avanzamento delle attività. Rome.Ministero dei Beni e delle Attività Culturali e del Turismo.
Shepherd, E. J., Palazzi, D. S., Leone, G. and Mavica, M. M. M. (2013a) ‘La collezione c . d . USAAF dell’ Aerofototeca Nazionale. Lavori in corso’, Archeologia
Aerea, 6,13–32.
Strutt, Kristian, David (2019) Settlement and land use in the Tiber Delta and its environs 3000 BC – AD 300. University of Southampton, Doctoral Thesis.
https://eprints.soton.ac.uk/433953/
ABSTRACT
The air photographic archive of the ICCD provides an essential resource for archaeological research in Italy and the Mediterranean.
This paper reviews the use of archive material for the Portus Project, and its role in interpreting the ancient landscape of Portus
and Ostia at the mouth of the river Tiber, where analysis of air photos was integrated with geophysical survey and archaeological
fieldwork.
KEYWORDS
Archaeology; Geophysics; Portus; Maritime Archaeology; Roman; Landscapes; Magnetometry; Air Photographs; ICCD
AUTHOR
Kristian Strutt
kds@soton.ac.uk
Department of Archaeology, University of Southampton
Highfield, Southampton, SO17 1BF
a DEEPER understanding
innovative 3D ground penetrating radar
The step-frequency
technology − applied to
GPR − enables high-density
high speed 3D data capture,
with unique combination
of deep subsurface
penetration coupled to high
resolution.
CODEVINTEC
www.codevintec.it/3d-radar-geoscope-it
Rental available
AGENDA
17-18 Settembre 2020
Milano
DRONITALY
www.geoforall.it/kfrpc
27-30 september 2021
Poznan (Poland)
GIScience 2020
www.geoforall.it/kfy44
14 - 17 october 2020
Bologna
SAIE
www.geoforall.it/kfr6q
19-20 may 2021
London (UK)
GEO Business 2020
www.geoforall.it/kf4yh
23 - 25 september 2020
Ferrara
REMTECH EXPO
http://www.geoforall.it/
kfqdy
13-15 October 2020
Berlin (Germany)
INTERGEO 2020
www.geoforall.it/kfqyu
1 - 3 december 2020
Amsterdam
Commercial UAV Expo
Europe 2020
www.geoforall.it/kfr6f
19 - 23 july 2021
Firenze
30th International
Cartographic Conference
www.geoforall.it/kfurw
Teorema has been working
alongside professionists proving
the most innovative topographic
technology, the best technical
training and accurate after-sales
assistance since 1986,
in order to make your work more
reliable and productive.
leica BlK360°
The imaging laser scanner simplifies
the way spaces are measured, designed
and documented .
New dimension in measurements technology
❚❚Leica BLK360° captures the world around you with full-colour panoramic images overlaid on a
high-accuracy point cloud.
❚❚Simple to use with just the single push of one button, the BLK360 is the smallest and lightest of its kind.
❚❚Anyone who can operate an iPad can now capture the world around them with high resolution 3D
panoramic images.
❚❚Using the ReCap Pro mobile app, the BLK360° streams image and point cloud data to iPad. The app
filters and registers scan data in real time.
❚❚After capture, ReCap Pro enables point cloud data transfer to a number of CAD, BIM, VR and AR
applications.
❚❚Teorema Milano can offer you a solution “all-inclusive” that includes: BLK360° with software ReCap
Pro, Ipad Pro 12,9”, training courses with specialist.
Contact us, you will discover much more.
www.geomatica.it • www.disto.it • www.termocamere.com
Via A. Romilli, 20/8 20139 Milano Italy • Tel. +39 02 5398739 • teorema@geomatica.it
Hall: 25
Booth: C25.68
S980
IMU | E-BUBBLE
EXTERNAL ANTENNA
5 WATT RADIO | IP67
S990A
IMU | 800 CH.
DOUBLE FREQ. RADIO
MIL-STD-810H | IP67
S900
New
| S900A
IMU | E-BUBBLE
4G | BLUETOOTH | WIFI
WEB-UI | TWO BATTERIES
IP67 | DOUBLE FREQUENCY RADIO
New
S700A
TWO VERSIONS
4G | BLUETOOTH | WIFI
WEB-UI | IP67
S850A
E-BUBBLE
4G | BLUETOOTH | WIFI
WEB-UI | IP67
www.stonex.it