FP50 Rev. RANKiNg commissioN Rev. mutuAl FuNd Rev. secuRities Rev. stocK Rev. boNd Rev. etF Rev. 2012 2011 comPANy $000s % chANge $000s % chANge $000s % chANge $000s $000s $000s 1 2 3 5 6 14 17 7 4 15 11 20 8 22 18 10 26 21 13 12 16 9 27 19 25 24 23 28 30 33 36 34 32 31 45 29 35 40 38 47 37 44 39 42 50 41 46 48 43 49 1 LPL <strong>Financial</strong> 1,637,471 12.7 445,841 8.2 171,167 8.9 94,498 76,669 2 Ameriprise <strong>Financial</strong> Services 1,335,713 12.7 593,314 5.6 3 Raymond James <strong>Financial</strong> Services 553,134 7.6 273,197 7.6 115,144 2.2 90,843 24,301 5 AXA Advisors 472,600 5.3 55,500 (6.3) 6,000 1.7 4,200 1,800 6 MetLife Securities 469,431 18.9 35,075 (7.4) 3,456 3.9 2,691 371 394 14 MML Investors Services 261,976 4.9 96,641 6.9 5,173 32.3 2,571 2,601 25 ING <strong>Financial</strong> Partners 255,635 69.2 68,007 49.4 6,699 10.4 5,706 993 8 Northwestern Mutual 235,539 3.7 120,066 3.2 4,731 4.0 4,510 221 4 Commonwealth <strong>Financial</strong> Network 235,126 9.4 79,674 0.7 15,686 (5.2) 7,046 5,345 3,295 15 National <strong>Planning</strong> 233,052 7.9 57,115 0.3 5,589 (9.5) 3,297 1,464 828 10 NFP Advisor Services Group (and affiliates) 223,874 1.9 36,479 6.7 4,116 (32.8) 2,570 1,545 18 John Hancock <strong>Financial</strong> Network 222,902 (11.6) 36,024 8.3 660 (28.4) 660 7 Securities America 222,400 (9.8) 135,300 (4.1) 11,500 (16.3) 9,400 2,100 20 Woodbury <strong>Financial</strong> Services 221,775 6.0 35,535 (4.8) 2,770 2,699 72 17 Securian <strong>Financial</strong> Services 214,918 (5.7) 34,127 4.2 1,187 (6.1) 1,187 12 Royal Alliance Associates 204,411 15.3 78,432 15.6 9,469 (6.8) 7,481 1,989 26 Princor <strong>Financial</strong> Services 201,539 10.7 132,379 7.3 2,808 (2.3) 2,527 281 23 New England Securities 195,522 25.9 30,134 0.6 2,328 13.0 1,711 386 232 13 <strong>Financial</strong> Network Investment 190,231 2.5 86,077 (73.6) 10,546 7,015 2,553 978 9 Wells Fargo Advisors <strong>Financial</strong> Network 186,861 13.5 63,013 13.1 61,686 13.9 38,019 23,667 16 Waddell & Reed 185,870 1.6 124,142 6.4 1,097 46.3 848 141 108 11 Cambridge Investment Research 163,348 16.4 52,696 5.5 11,124 10.1 5,734 1,748 3,643 27 Invest <strong>Financial</strong> 159,570 13.9 39,113 11.5 9,377 (7.5) 5,853 2,890 634 21 FSC Securities 150,102 14.9 51,968 10.4 7,355 19.6 5,904 1,451 24 SagePoint <strong>Financial</strong> 149,674 12.5 53,954 9.9 7,214 (10.6) 6,646 568 22 First Allied Securities 145,961 3.3 26,290 1.6 33,243 (13.1) 27,111 6,132 19 H.D. Vest <strong>Financial</strong> Services 136,373 4.6 72,502 4.9 8,918 16.6 7,252 1,666 29 PrimeVest <strong>Financial</strong> Services 134,466 (15.2) 36,392 (77.0) 17,489 7,965 4,676 4,848 28 Transamerica <strong>Financial</strong> Advisors 121,936 (2.4) 43,124 (65.5) CUNA Brokerage Services 119,390 17,200 1,800 1,500 300 35 M Holdings Securities 112,072 4.6 5,168 13.0 6,071 196.6 5,766 305 33 Cadaret Grant 103,107 9.4 46,409 5.9 8,281 5.6 6,050 1,117 1,114 34 Park Avenue Securities 103,102 14.6 22,561 1.4 2,041 5.3 1,893 148 32 SII Investments 103,007 13.5 22,007 6.6 2,409 8.2 1,620 449 340 41 Allstate <strong>Financial</strong> Services 96,308 6.1 16,099 7.1 446 (33.4) 399 47 30 Multi-<strong>Financial</strong> Securities 96,122 (32.4) 27,393 (80.7) 7,434 3,320 2,492 1,622 31 Next <strong>Financial</strong> Group 88,781 (11.5) 23,203 (3.4) 10,570 (19.5) 7,561 3,009 40 CUSO <strong>Financial</strong> Services 88,131 5.1 25,611 (69.5) 4,057 1,763 2,295 36 Ameritas Investment 87,550 11.3 22,364 5.3 6,859 (6.5) 1,806 5,053 44 Centaurus <strong>Financial</strong> 80,287 9.7 8,394 (5.9) 1,576 16.3 441 207 928 39 American Portfolios <strong>Financial</strong> Services 79,647 14.5 26,613 6.7 10,608 6.6 7,995 1,862 751 45 CFG/H. Beck 79,018 20.0 26,279 8.7 4,114 8.8 2,567 1,548 37 Walnut Street Securities 78,237 5.2 30,644 (0.2) 2,718 (20.4) 1,912 423 383 43 ProEquities 77,668 18.5 34,552 18.5 6,036 15.6 1,622 4,414 48 Investment Centers of America 62,516 8.0 18,092 4.8 4,577 3.3 3,091 1,225 261 38 Genworth <strong>Financial</strong> Securities 58,296 (0.5) 36,395 5.8 1,589 (9.7) 1,476 113 46 VSR <strong>Financial</strong> Services 58,050 17.0 10,862 9.7 5,288 (16.2) 3,966 1,216 106 47 Securities Service Network 52,457 16.2 14,678 16.2 3,965 1.7 1,479 791 1,695 42 Triad Advisors 52,330 13.9 12,684 6.3 5,317 43.9 2,907 2,409 49 Geneos Wealth Management 30,809 34.0 9,691 72.6 2,353 8.9 1,467 886 Broker-Dealer Guide / SourceMedia Marketing Solutions Group 24
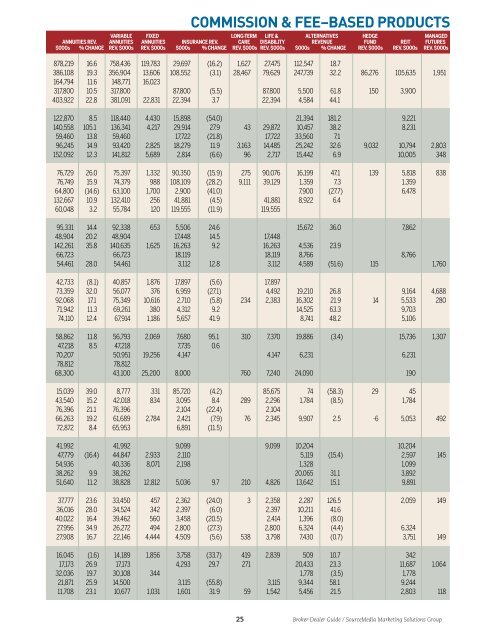
COMMiSSiOn & FEE–BASED PRODUCTS vARiAble Fixed loNg-teRm liFe & AlteRNAtives hedge mANAged ANNuities Rev. ANNuities ANNuities iNsuRANce Rev. cARe disAbility ReveNue FuNd Reit FutuRes $000s % chANge Rev. $000s Rev. $000s $000s % chANge Rev. $000s Rev. $000s $000s % chANge Rev. $000s Rev. $000s Rev. $000s 878,219 16.6 758,436 119,783 29,697 (16.2) 1,627 27,475 112,547 18.7 386,108 19.3 356,904 13,606 108,552 (3.1) 28,467 79,629 247,739 32.2 86,276 105,635 1,951 164,794 11.6 148,771 16,023 317,800 10.5 317,800 87,800 (5.5) 87,800 5,500 61.8 150 3,900 403,922 22.8 381,091 22,831 22,394 3.7 22,394 4,584 44.1 122,870 8.5 118,440 4,430 15,898 (54.0) 21,394 181.2 9,221 140,558 105.1 136,341 4,217 29,914 27.9 43 29,872 10,457 38.2 8,231 59,460 13.8 59,460 17,722 (21.8) 17,722 33,560 7.1 96,245 14.9 93,420 2,825 18,279 11.9 3,163 14,485 25,242 32.6 9,032 10,794 2,803 152,092 12.3 141,812 5,689 2,814 (6.6) 96 2,717 15,442 6.9 10,005 348 76,729 26.0 75,397 1,332 90,350 (15.9) 275 90,076 16,199 47.1 139 5,818 838 76,749 15.9 74,379 988 108,109 (28.2) 9,111 39,129 1,359 7.3 1,359 64,800 (14.6) 63,100 1,700 2,900 (41.0) 7,900 (27.7) 6,478 132,667 10.9 132,410 256 41,881 (4.5) 41,881 8,922 6.4 60,048 3.2 55,784 120 119,555 (11.9) 119,555 95,331 14.4 92,338 653 5,506 24.6 15,672 36.0 7,862 48,904 20.2 48,904 17,448 14.5 17,448 142,261 35.8 140,635 1,625 16,263 9.2 16,263 4,536 23.9 66,723 66,723 18,119 18,119 8,766 8,766 54,461 28.0 54,461 3,112 12.8 3,112 4,589 (51.6) 115 1,760 42,733 (8.1) 40,857 1,876 17,897 (5.6) 17,897 73,359 32.0 56,077 376 6,959 (27.1) 4,492 19,210 26.8 9,164 4,688 92,068 17.1 75,349 10,616 2,710 (5.8) 234 2,383 16,302 21.9 14 5,533 280 71,942 11.3 69,261 380 4,312 9.2 14,525 63.3 9,703 74,110 12.4 67,914 1,186 5,657 41.9 8,741 48.2 5,106 58,862 11.8 56,793 2,069 7,680 95.1 310 7,370 19,886 (3.4) 15,736 1,307 47,218 8.5 47,218 7,735 0.6 70,207 50,951 19,256 4,147 4,147 6,231 6,231 78,812 78,812 68,300 43,100 25,200 8,000 760 7,240 24,090 190 15,039 39.0 8,777 331 85,720 (4.2) 85,675 74 (58.3) 29 45 43,540 15.2 42,018 834 3,095 8.4 289 2,296 1,784 (8.5) 1,784 76,396 21.1 76,396 2,104 (22.4) 2,104 66,263 19.2 61,689 2,784 2,421 (7.9) 76 2,345 9,907 2.5 -6 5,053 492 72,872 8.4 65,953 6,891 (11.5) 41,992 41,992 9,099 9,099 10,204 10,204 47,779 (16.4) 44,847 2,933 2,110 5,119 (15.4) 2,597 145 54,936 40,336 8,071 2,198 1,328 1,099 38,262 9.9 38,262 20,065 31.1 3,892 51,640 11.2 38,828 12,812 5,036 9.7 210 4,826 13,642 15.1 9,891 37,777 23.6 33,450 457 2,362 (24.0) 3 2,358 2,287 126.5 2,059 149 36,016 28.0 34,524 342 2,397 (6.0) 2,397 10,211 41.6 40,022 16.4 39,462 560 3,458 (20.5) 2,414 1,396 (8.0) 27,956 34.9 26,272 494 2,800 (27.3) 2,800 6,324 (4.4) 6,324 27,908 16.7 22,146 4,444 4,509 (5.6) 538 3,798 7,430 (0.7) 3,751 149 16,045 (1.6) 14,189 1,856 3,758 (33.7) 419 2,839 509 10.7 342 17,173 26.9 17,173 4,293 29.7 271 20,433 23.3 11,687 1,064 32,036 19.7 30,108 344 1,778 (3.5) 1,778 21,871 25.9 14,500 3,115 (55.8) 3,115 9,344 58.1 9,244 11,708 23.1 10,677 1,031 1,601 31.9 59 1,542 5,456 21.5 2,803 118 25 Broker-Dealer Guide / SourceMedia Marketing Solutions Group