Bürklin Elektronik Quarterly # 04/2021 Englisch
Bürklin Quaterly is a Bürklin Elektronik magazine published four times a year with profound information on services, products and manufacturers.
Bürklin Quaterly is a Bürklin Elektronik magazine published four times a year with profound information on services, products and manufacturers.

You also want an ePaper? Increase the reach of your titles
YUMPU automatically turns print PDFs into web optimized ePapers that Google loves.
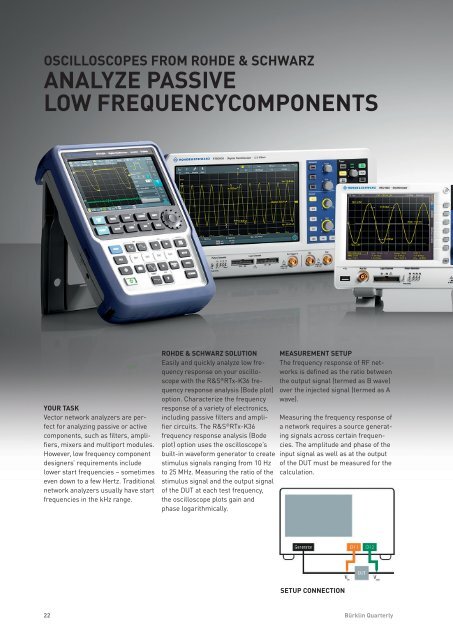
OSCILLOSCOPES FROM ROHDE & SCHWARZ<br />
ANALYZE PASSIVE<br />
LOW FREQUENCYCOMPONENTS<br />
YOUR TASK<br />
Vector network analyzers are perfect<br />
for analyzing passive or active<br />
components, such as filters, amplifiers,<br />
mixers and multiport modules.<br />
However, low frequency component<br />
designers’ requirements include<br />
lower start frequencies – sometimes<br />
even down to a few Hertz. Traditional<br />
network analyzers usually have start<br />
frequencies in the kHz range.<br />
ROHDE & SCHWARZ SOLUTION<br />
Easily and quickly analyze low frequency<br />
response on your oscilloscope<br />
with the R&S ® RTx-K36 frequency<br />
response analysis (Bode plot)<br />
option. Characterize the frequency<br />
response of a variety of electronics,<br />
including passive filters and amplifier<br />
circuits. The R&S ® RTx-K36<br />
frequency response analysis (Bode<br />
plot) option uses the oscilloscope’s<br />
built-in waveform generator to create<br />
stimulus signals ranging from 10 Hz<br />
to 25 MHz. Measuring the ratio of the<br />
stimulus signal and the output signal<br />
of the DUT at each test frequency,<br />
the oscilloscope plots gain and<br />
phase logarithmically.<br />
MEASUREMENT SETUP<br />
The frequency response of RF networks<br />
is defined as the ratio between<br />
the output signal (termed as B wave)<br />
over the injected signal (termed as A<br />
wave).<br />
Measuring the frequency response of<br />
a network requires a source generating<br />
signals across certain frequencies.<br />
The amplitude and phase of the<br />
input signal as well as at the output<br />
of the DUT must be measured for the<br />
calculation.<br />
Use the Bode plot application to turn<br />
your Rohde & Schwarz oscilloscope<br />
into a frequency response analyzer.<br />
DEVICE SETUP<br />
Connect the oscilloscope’s generator<br />
and one oscilloscope channel to the<br />
DUT input, and another oscilloscope<br />
channel to the DUT output. Start the<br />
application:<br />
- Set start and stop frequency<br />
between 10 Hz and 25 MHz<br />
and determine the generator<br />
utput level.<br />
- Set the points per decade to<br />
improve and modify the resolution<br />
of your acquisition. The oscilloscope<br />
supports up to 500 points<br />
per decade.<br />
- For analyzing the phase and gain<br />
shift of digital filters, the<br />
R&S ® RTx-K36 option allows you<br />
to set an additional hold off time<br />
before each decade step.<br />
- Press run to start your measurement.<br />
The measurement results<br />
are plotted as gain/phase over<br />
frequency. Set your markers<br />
to your point of interest.<br />
MEASUREMENT RESULTS<br />
Gain and phase waveforms displayed<br />
in the Bode plots represent the<br />
transmission function of the DUT.<br />
Gain shows the amplitude frequency<br />
response frequency range in dB. The<br />
phase waveform displays the phase<br />
characteristics over frequency, measured<br />
in degrees.<br />
Drag markers to the desired positions<br />
directly on the plotted trace. A<br />
legend displays the coordinates of<br />
the markers. To determine the cutoff<br />
frequency of a low pass filter, activate<br />
two markers. The cutoff frequency is<br />
defined as the frequency for which<br />
the output of the circuit is 3 dB below<br />
the nominal passband value.<br />
SUMMARY<br />
Engineers use oscilloscopes as a<br />
primary measurement tool. Equip<br />
your oscilloscope with a Bode analysis<br />
option to determine the frequency<br />
response of passive components. The<br />
R&S ® RTx-K36 frequency response<br />
analysis (Bode plot) option for the<br />
R&S ® RTB2000, R&S ® RTM3000 and<br />
R&S ® RTA4000 oscilloscopes provides<br />
a low-cost alternative to low<br />
frequency network analyzers or<br />
dedicated standalone frequency<br />
analyzers. With their 10-bit ADC,<br />
low noise and 25 MHz generator,<br />
the R&S ® RTB2000, R&S ® RTM3000<br />
and R&S ® RTA4000 oscilloscopes ideally<br />
meet the high dynamic range<br />
requirements of this measurement<br />
task.<br />
SETUP CONNECTION<br />
22 Bürklin <strong>Quarterly</strong><br />
www.buerklin.com<br />
23