2005 Annual Report Julius Baer Holding Ltd. - GAM Holding AG
2005 Annual Report Julius Baer Holding Ltd. - GAM Holding AG
2005 Annual Report Julius Baer Holding Ltd. - GAM Holding AG

Create successful ePaper yourself
Turn your PDF publications into a flip-book with our unique Google optimized e-Paper software.
Private Banking<br />
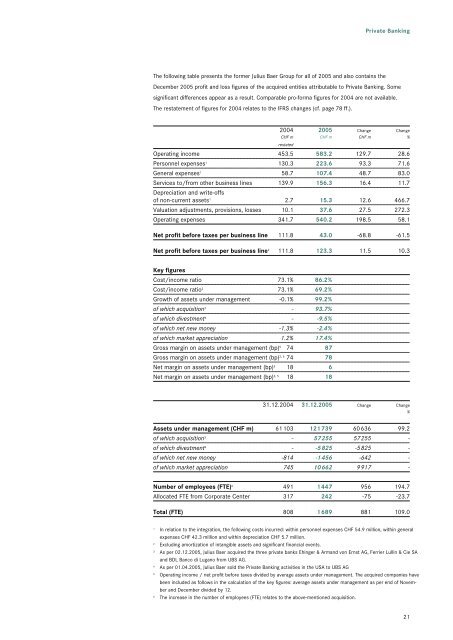
The following table presents the former <strong>Julius</strong> <strong>Baer</strong> Group for all of <strong>2005</strong> and also contains the<br />
December <strong>2005</strong> profit and loss figures of the acquired entities attributable to Private Banking. Some<br />
significant differences appear as a result. Comparable pro-forma figures for 2004 are not available.<br />
The restatement of figures for 2004 relates to the IFRS changes (cf. page 78 ff.).<br />
2004 <strong>2005</strong> Change Change<br />
CHF m<br />
restated<br />
CHF m CHF m %<br />
Operating income 453.5 583.2 129.7 28.6<br />
Personnel expenses 1 130.3 223.6 93.3 71.6<br />
General expenses 1 58.7 107.4 48.7 83.0<br />
Services to/from other business lines 139.9 156.3 16.4 11.7<br />
Depreciation and write-offs<br />
of non-current assets 1 2.7 15.3 12.6 466.7<br />
Valuation adjustments, provisions, losses 10.1 37.6 27.5 272.3<br />
Operating expenses 341.7 540.2 198.5 58.1<br />
Net profit before taxes per business line 111.8 43.0 -68.8 -61.5<br />
Net profit before taxes per business line 2 111.8 123.3 11.5 10.3<br />
Key figures<br />
Cost/income ratio 73.1% 86.2%<br />
Cost/income ratio 2 73.1% 69.2%<br />
Growth of assets under management -0.1% 99.2%<br />
of which acquisition 3 - 93.7%<br />
of which divestment 4 - -9.5%<br />
of which net new money -1.3% -2.4%<br />
of which market appreciation 1.2% 17.4%<br />
Gross margin on assets under management (bp) 5 74 87<br />
Gross margin on assets under management (bp) 2, 5 74 78<br />
Net margin on assets under management (bp) 5 18 6<br />
Net margin on assets under management (bp) 2, 5 18 18<br />
31.12.2004 31.12.<strong>2005</strong> Change Change<br />
%<br />
Assets under management (CHF m) 61103 121739 60636 99.2<br />
of which acquisition 3 - 57255 57255 -<br />
of which divestment 4 - -5825 -5825 -<br />
of which net new money -814 -1456 -642 -<br />
of which market appreciation 745 10662 9917 -<br />
Number of employees (FTE) 6 491 1447 956 194.7<br />
Allocated FTE from Corporate Center 317 242 -75 -23.7<br />
Total (FTE) 808 1689 881 109.0<br />
1 In relation to the integration, the following costs incurred: within personnel expenses CHF 54.9 million, within general<br />
expenses CHF 42.3 million and within depreciation CHF 5.7 million.<br />
2 Excluding amortization of intangible assets and significant financial events.<br />
3 As per 02.12.<strong>2005</strong>, <strong>Julius</strong> <strong>Baer</strong> acquired the three private banks Ehinger & Armand von Ernst <strong>AG</strong>, Ferrier Lullin & Cie SA<br />
and BDL Banco di Lugano from UBS <strong>AG</strong>.<br />
4 As per 01.04.<strong>2005</strong>, <strong>Julius</strong> <strong>Baer</strong> sold the Private Banking activities in the USA to UBS <strong>AG</strong><br />
5 Operating income / net profit before taxes divided by average assets under management. The acquired companies have<br />
been included as follows in the calculation of the key figures: average assets under management as per end of November<br />
and December divided by 12.<br />
6 The increase in the number of employees (FTE) relates to the above-mentioned acquisition.<br />
21