Annual Comprehensive Financial Report 2021

Create successful ePaper yourself
Turn your PDF publications into a flip-book with our unique Google optimized e-Paper software.
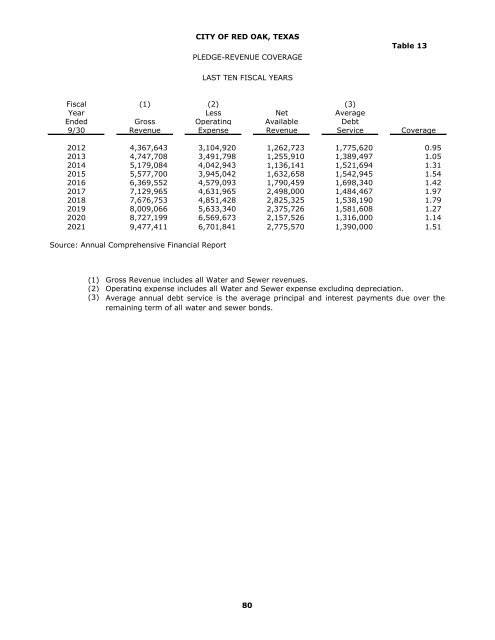
CITY OF RED OAK, TEXAS<br />
PLEDGE-REVENUE COVERAGE<br />
Table 13<br />
LAST TEN FISCAL YEARS<br />
Fiscal (1) (2) (3)<br />
Year Less Net Average<br />
Ended Gross Operating Available Debt<br />
9/30 Revenue Expense Revenue Service Coverage<br />
2012 4,367,643 3,104,920 1,262,723 1,775,620 0.95<br />
2013 4,747,708 3,491,798 1,255,910 1,389,497 1.05<br />
2014 5,179,084 4,042,943 1,136,141 1,521,694 1.31<br />
2015 5,577,700 3,945,042 1,632,658 1,542,945 1.54<br />
2016 6,369,552 4,579,093 1,790,459 1,698,340 1.42<br />
2017 7,129,965 4,631,965 2,498,000 1,484,467 1.97<br />
2018 7,676,753 4,851,428 2,825,325 1,538,190 1.79<br />
2019 8,009,066 5,633,340 2,375,726 1,581,608 1.27<br />
2020 8,727,199 6,569,673 2,157,526 1,316,000 1.14<br />
<strong>2021</strong> 9,477,411 6,701,841 2,775,570 1,390,000 1.51<br />
Source: <strong>Annual</strong> <strong>Comprehensive</strong> <strong>Financial</strong> <strong>Report</strong><br />
(1) Gross Revenue includes all Water and Sewer revenues.<br />
(2) Operating expense includes all Water and Sewer expense excluding depreciation.<br />
(3) Average annual debt service is the average principal and interest payments due over the<br />
remaining term of all water and sewer bonds.<br />
80