Annual Comprehensive Financial Report 2021

Create successful ePaper yourself
Turn your PDF publications into a flip-book with our unique Google optimized e-Paper software.
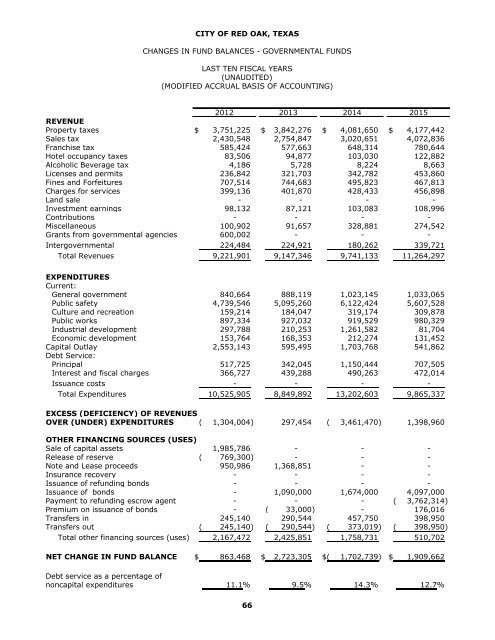
CITY OF RED OAK, TEXAS<br />
CHANGES IN FUND BALANCES - GOVERNMENTAL FUNDS<br />
LAST TEN FISCAL YEARS<br />
(UNAUDITED)<br />
(MODIFIED ACCRUAL BASIS OF ACCOUNTING)<br />
2012 2013 2014 2015<br />
REVENUE<br />
Property taxes $ 3,751,225 $ 3,842,276 $ 4,081,650 $ 4,177,442<br />
Sales tax 2,430,548 2,754,847 3,020,651 4,072,836<br />
Franchise tax 585,424 577,663 648,314 780,644<br />
Hotel occupancy taxes 83,506 94,877 103,030 122,882<br />
Alcoholic Beverage tax 4,186 5,728 8,224 8,663<br />
Licenses and permits 236,842 321,703 342,782 453,860<br />
Fines and Forfeitures 707,514 744,683 495,823 467,813<br />
Charges for services 399,136 401,870 428,433 456,898<br />
Land sale - - - -<br />
Investment earnings 98,132 87,121 103,083 108,996<br />
Contributions - - - -<br />
Miscellaneous 100,902 91,657 328,881 274,542<br />
Grants from governmental agencies 600,002 - - -<br />
Intergovernmental 224,484 224,921 180,262 339,721<br />
Total Revenues 9,221,901 9,147,346 9,741,133 11,264,297<br />
EXPENDITURES<br />
Current:<br />
General government 840,664 888,119 1,023,145 1,033,065<br />
Public safety 4,739,546 5,095,260 6,122,424 5,607,528<br />
Culture and recreation 159,214 184,047 319,174 309,878<br />
Public works 897,334 927,032 919,529 980,329<br />
Industrial development 297,788 210,253 1,261,582 81,704<br />
Economic development 153,764 168,353 212,274 131,452<br />
Capital Outlay 2,553,143 595,495 1,703,768 541,862<br />
Debt Service:<br />
Principal 517,725 342,045 1,150,444 707,505<br />
Interest and fiscal charges 366,727 439,288 490,263 472,014<br />
Issuance costs - - - -<br />
Total Expenditures 10,525,905 8,849,892 13,202,603 9,865,337<br />
EXCESS (DEFICIENCY) OF REVENUES<br />
OVER (UNDER) EXPENDITURES ( 1,304,004) 297,454 ( 3,461,470) 1,398,960<br />
OTHER FINANCING SOURCES (USES)<br />
Sale of capital assets 1,985,786 - - -<br />
Release of reserve ( 769,300)<br />
- - -<br />
Note and Lease proceeds 950,986 1,368,851 - -<br />
Insurance recovery - - - -<br />
Issuance of refunding bonds - - - -<br />
Issuance of bonds - 1,090,000 1,674,000 4,097,000<br />
Payment to refunding escrow agent - - - ( 3,762,314)<br />
Premium on issuance of bonds - ( 33,000)<br />
- 176,016<br />
Transfers in 245,140 290,544 457,750 398,950<br />
Transfers out ( 245,140) ( 290,544) ( 373,019) ( 398,950)<br />
Total other financing sources (uses) 2,167,472 2,425,851 1,758,731 510,702<br />
NET CHANGE IN FUND BALANCE $ 863,468 $ 2,723,305 $( 1,702,739) $ 1,909,662<br />
Debt service as a percentage of<br />
noncapital expenditures 11.1% 9.5% 14.3% 12.7%<br />
66