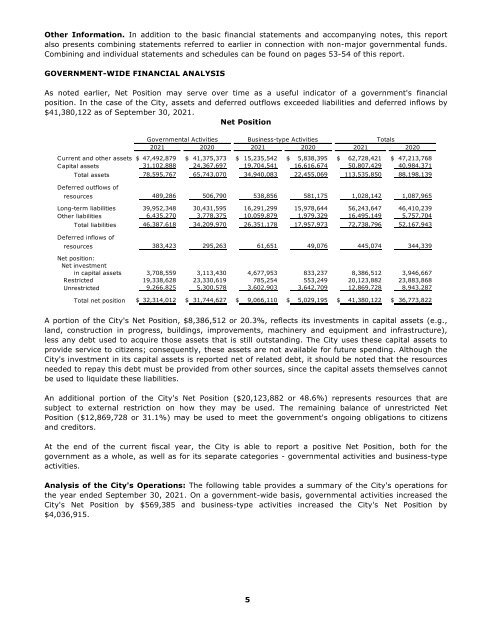
Other Information. In addition to the basic financial statements and accompanying notes, this report also presents combining statements referred to earlier in connection with non-major governmental funds. Combining and individual statements and schedules can be found on pages 53-54 of this report. GOVERNMENT-WIDE FINANCIAL ANALYSIS As noted earlier, Net Position may serve over time as a useful indicator of a government's financial position. In the case of the City, assets and deferred outflows exceeded liabilities and deferred inflows by $41,380,122 as of September 30, <strong>2021</strong>. Net Position Governmental Activities Business-type Activities Totals <strong>2021</strong> 2020 <strong>2021</strong> 2020 <strong>2021</strong> 2020 Current and other assets $ 47,492,879 $ 41,375,373 $ 15,235,542 $ 5,838,395 $ 62,728,421 $ 47,213,768 Capital assets 31,102,888 24,367,697 19,704,541 16,616,674 50,807,429 40,984,371 Total assets 78,595,767 65,743,070 34,940,083 22,455,069 113,535,850 88,198,139 Deferred outflows of resources 489,286 506,790 538,856 581,175 1,028,142 1,087,965 Long-term liabilities 39,952,348 30,431,595 16,291,299 15,978,644 56,243,647 46,410,239 Other liabilities 6,435,270 3,778,375 10,059,879 1,979,329 16,495,149 5,757,704 Total liabilities 46,387,618 34,209,970 26,351,178 17,957,973 72,738,796 52,167,943 Deferred inflows of resources 383,423 295,263 61,651 49,076 445,074 344,339 Net position: Net investment in capital assets 3,708,559 3,113,430 4,677,953 833,237 8,386,512 3,946,667 Restricted 19,338,628 23,330,619 785,254 553,249 20,123,882 23,883,868 Unrestricted 9,266,825 5,300,578 3,602,903 3,642,709 12,869,728 8,943,287 Total net position $ 32,314,012 $ 31,744,627 $ 9,066,110 $ 5,029,195 $ 41,380,122 $ 36,773,822 A portion of the City's Net Position, $8,386,512 or 20.3%, reflects its investments in capital assets (e.g., land, construction in progress, buildings, improvements, machinery and equipment and infrastructure), less any debt used to acquire those assets that is still outstanding. The City uses these capital assets to provide service to citizens; consequently, these assets are not available for future spending. Although the City's investment in its capital assets is reported net of related debt, it should be noted that the resources needed to repay this debt must be provided from other sources, since the capital assets themselves cannot be used to liquidate these liabilities. An additional portion of the City's Net Position ($20,123,882 or 48.6%) represents resources that are subject to external restriction on how they may be used. The remaining balance of unrestricted Net Position ($12,869,728 or 31.1%) may be used to meet the government's ongoing obligations to citizens and creditors. At the end of the current fiscal year, the City is able to report a positive Net Position, both for the government as a whole, as well as for its separate categories - governmental activities and business-type activities. Analysis of the City's Operations: The following table provides a summary of the City's operations for the year ended September 30, <strong>2021</strong>. On a government-wide basis, governmental activities increased the City's Net Position by $569,385 and business-type activities increased the City's Net Position by $4,036,915. 5
Changes in Net Position Governmental Activities Business-type Activities Totals <strong>2021</strong> 2020 <strong>2021</strong> 2020 <strong>2021</strong> 2020 Revenues: Program revenues: Charges for services $ 4,167,321 $ 9,851,729 $ 9,477,411 $ 8,715,261 $ 13,644,732 $ 18,566,990 Operating grants and contributions 1,293,401 1,372,677 - - 1,293,401 1,372,677 Capital grants and contributions 2,485,606 3,519,935 2,705,020 1,104,544 5,190,626 4,624,479 General revenues: Property tax 8,571,758 8,000,818 - - 8,571,758 8,000,818 Sales tax 6,343,642 5,584,807 - - 5,584,807 Franchise tax 728,690 742,438 - - 728,690 742,438 Hotel occupancy tax 317,525 162,389 - - 317,525 162,389 Alcoholic beverage tax 11,185 9,878 - - 11,185 9,878 Investment earnings 52,373 332,046 12,498 8,215 64,871 340,261 Miscellaneous 45,403 56,382 - - 45,403 56,382 Gain on sale of assets - - - 108,436 - 108,436 Total revenues 24,016,904 29,633,099 12,194,929 9,936,456 36,211,833 39,569,555 Expenses: General government 1,931,114 1,876,147 - - 1,931,114 1,876,147 Public safety 8,910,297 8,680,540 - - 8,910,297 8,680,540 Culture and recreation 1,051,184 848,530 - - 1,051,184 848,530 Public works 2,895,417 2,774,598 - - 2,895,417 2,774,598 Industrial development 5,596,763 1,104,636 - - 5,596,763 1,104,636 Economic development 209,880 58,940 - - 209,880 58,940 Interest on long-term debt 2,259,864 1,550,846 - - 2,259,864 1,550,846 Utility - - 8,525,891 8,488,858 8,525,891 8,488,858 Storm water - - 225,123 323,665 225,123 323,665 Total expenses 22,854,519 16,894,237 8,751,014 8,812,523 31,605,533 25,706,760 Transfers ( 593,000) - 593,000 - - - Change in net position 569,385 12,738,862 4,036,915 1,123,933 4,606,300 13,862,795 Net position, beginning 31,744,627 19,005,765 5,029,195 3,905,262 36,773,822 22,911,027 Net position, ending $ 32,314,012 $ 31,744,627 $ 9,066,110 $ 5,029,195 $ 41,380,122 $ 36,773,822 FINANCIAL ANALYSIS OF THE GOVERNMENT'S FUNDS Governmental Funds: The focus of the City's governmental funds is to provide information on near-term inflows, outflows, and balances of spendable resources. Such information is useful in assessing the City's financing requirements. In particular, unreserved fund balance may serve as a useful measure of a government's net resources available for spending at the end of the fiscal year. As of the end of the current fiscal year, the City's governmental funds reported combined ending fund balances of $43,396,048. Approximately 9.1% of this total amount, $3,962,045 is unassigned fund balance. The remainder of the fund balance is not available for new spending because it has already been restricted or assigned for other purposes. The General Fund is the chief operating fund of the City. At the end of the current fiscal year, unassigned fund balance of the General Fund was $3,962,045, while total fund balance reached $5,496,240. As a measure of the General Fund's liquidity, it may be useful to compare both unassigned fund balance and total fund balance to total fund expenditures. Unassigned fund balance represents 27.0% of total General Fund expenditures, while total fund balance represents 37.5% of that same amount. The fund balance of the City's General Fund has a net increase of $541,211 during the current fiscal year adjustment. The increase is attributable to increases in property taxes, sales taxes, and licenses in permits. Property taxes and sales tax increased $1.3 million despite economic shutdowns caused by the COVID-19 pandemic. Expenditures in the general fund increased $1.76 million, offsetting some of the increases in revenues. Increases in expenditures were mainly caused by an increase to Culture and recreation expenses of $150,000 due to the addition of the Parks Department including personnel, benefits, general supplies and maintenance costs, an increase to Public Works and Engineering expenses in contractual services, and increases to capital expenses of $1.1 million. 6
- Page 1: City of Red Oak, Texas Annual Compr
- Page 4 and 5: Required Supplementary Information
- Page 6 and 7: THIS PAGE LEFT BLANK INTENTIONALLY
- Page 8 and 9: THIS PAGE LEFT BLANK INTENTIONALLY
- Page 10 and 11: THE CITY The City of Red Oak (the
- Page 12 and 13: at the intersection of State Highwa
- Page 14 and 15: OTHER INFORMATION Independent Audit
- Page 16: CITIZENS City Attorney Robert Hager
- Page 19 and 20: THIS PAGE LEFT BLANK INTENTIONALLY
- Page 21 and 22: THIS PAGE LEFT BLANK INTENTIONALLY
- Page 23 and 24: Other Matters Required Supplementar
- Page 25: Both of the government-wide financi
- Page 29 and 30: Governmental Activities Business-ty
- Page 31 and 32: This requirement was met, and excee
- Page 33 and 34: THIS PAGE LEFT BLANK INTENTIONALLY
- Page 35 and 36: CITY OF RED OAK, TEXAS STATEMENT OF
- Page 37 and 38: CITY OF RED OAK, TEXAS BALANCE SHEE
- Page 39 and 40: THIS PAGE LEFT BLANK INTENTIONALLY
- Page 41 and 42: CITY OF RED OAK, TEXAS STATEMENT OF
- Page 43 and 44: CITY OF RED OAK, TEXAS RECONCILIATI
- Page 45 and 46: THIS PAGE LEFT BLANK INTENTIONALLY
- Page 47 and 48: CITY OF RED OAK, TEXAS STATEMENT OF
- Page 49 and 50: THIS PAGE LEFT BLANK INTENTIONALLY
- Page 51 and 52: Governmental fund financial stateme
- Page 53 and 54: The costs of normal maintenance and
- Page 55 and 56: In the fund financial statements, g
- Page 57 and 58: IV. RECEIVABLES The City’s receiv
- Page 59 and 60: Bond Reserve Fund For the Industria
- Page 61 and 62: Annual debt service requirements fo
- Page 63 and 64: A summary of plan provisions for th
- Page 65 and 66: The City’s net pension liability
- Page 67 and 68: Discount Rate The SDBF program is t
- Page 69 and 70: XII. TAX ABATEMENTS The city enters
- Page 71 and 72: THIS PAGE LEFT BLANK INTENTIONALLY
- Page 73 and 74: CITY OF RED OAK, TEXAS SCHEDULE OF
- Page 75 and 76: CITY OF RED OAK, TEXAS SCHEDULE OF
- Page 77 and 78:
CITY OF RED OAK, TEXAS SCHEDULE OF
- Page 79 and 80:
CITY OF RED OAK, TEXAS SCHEDULE OF
- Page 81 and 82:
CITY OF RED OAK, TEXAS COMBINING BA
- Page 83 and 84:
CITY OF RED OAK, TEXAS COMBINING ST
- Page 85 and 86:
CITY OF RED OAK, TEXAS SCHEDULE OF
- Page 87 and 88:
THIS PAGE LEFT BLANK INTENTIONALLY
- Page 89 and 90:
THIS PAGE LEFT BLANK INTENTIONALLY
- Page 91 and 92:
CITY OF RED OAK, TEXAS NET POSITION
- Page 93 and 94:
CITY OF RED OAK, TEXAS CHANGES IN N
- Page 95 and 96:
CITY OF RED OAK, TEXAS CHANGES IN N
- Page 97 and 98:
CITY OF RED OAK, TEXAS FUND BALANCE
- Page 99 and 100:
CITY OF RED OAK, TEXAS CHANGES IN F
- Page 101 and 102:
CITY OF RED OAK, TEXAS ASSESSED VAL
- Page 103 and 104:
CITY OF RED OAK, TEXAS DIRECT AND O
- Page 105 and 106:
THIS PAGE LEFT BLANK INTENTIONALLY
- Page 107 and 108:
CITY OF RED OAK, TEXAS RATIOS OF GE
- Page 109 and 110:
THIS PAGE LEFT BLANK INTENTIONALLY
- Page 111 and 112:
CITY OF RED OAK, TEXAS RATIOS OF GE
- Page 113 and 114:
CITY OF RED OAK, TEXAS DIRECT AND O
- Page 115 and 116:
CITY OF RED OAK, TEXAS PLEDGE-REVEN
- Page 117 and 118:
THIS PAGE LEFT BLANK INTENTIONALLY
- Page 119 and 120:
CITY OF RED OAK, TEXAS FULL-TIME EQ
- Page 121 and 122:
CITY OF RED OAK, TEXAS OPERATING IN
- Page 123 and 124:
CITY OF RED OAK, TEXAS CAPITAL ASSE
- Page 125 and 126:
THIS PAGE LEFT BLANK INTENTIONALLY
- Page 127 and 128:
Compliance and Other Matters As par
- Page 129:
THIS PAGE LEFT BLANK INTENTIONALLY