Annual Comprehensive Financial Report 2021

You also want an ePaper? Increase the reach of your titles
YUMPU automatically turns print PDFs into web optimized ePapers that Google loves.
The actuarial assumptions were developed primarily from the actuarial investigation of the experience<br />
of TMRS over the four-year period from December 31, 2014 to December 31, 2018. They were adopted<br />
in 2019 and first used in the December 31, 2019 actuarial valuation. The post-retirement mortality<br />
assumption for Annuity Purchase Rates (APRs) is based on the Mortality Experience Investigation Study<br />
covering 2009 through 2011 and dated December 31, 2013. Plan assets are managed on a total return<br />
basis with an emphasis on both capital appreciation as well as the production of income in order to<br />
satisfy the short-term and long-term funding needs of TMRS.<br />
The long-term expected rate of return on pension plan investments was determined using a buildingblock<br />
method in which best estimate ranges of expected future real rates of return (expected returns,<br />
net of pension plan investment expenses and inflation) are developed for each major asset class. These<br />
ranges are combined to produce the long-term expected rate of return by weighting the expected future<br />
real rates of return by the target asset allocation percentage and by adding expected inflation. In<br />
determining their best estimate of a recommended investment return assumption under the various<br />
alternative asset allocation portfolios, GRS focused on the area between (1) arithmetic mean<br />
(aggressive) without an adjustment for time (conservative) and (2) the geometric mean (conservative)<br />
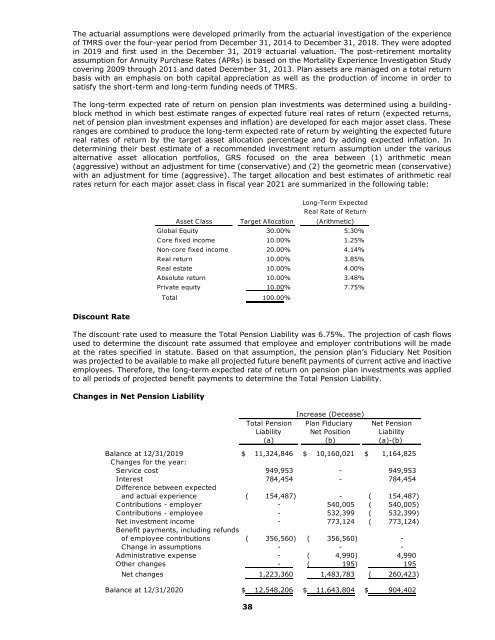
with an adjustment for time (aggressive). The target allocation and best estimates of arithmetic real<br />
rates return for each major asset class in fiscal year <strong>2021</strong> are summarized in the following table:<br />
Long-Term Expected<br />
Real Rate of Return<br />
Asset Class Target Allocation (Arithmetic)<br />
Global Equity 30.00% 5.30%<br />
Core fixed income 10.00% 1.25%<br />
Non-core fixed income 20.00% 4.14%<br />
Real return 10.00% 3.85%<br />
Real estate 10.00% 4.00%<br />
Absolute return 10.00% 3.48%<br />
Private equity 10.00% 7.75%<br />
Total 100.00%<br />
Discount Rate<br />
The discount rate used to measure the Total Pension Liability was 6.75%. The projection of cash flows<br />
used to determine the discount rate assumed that employee and employer contributions will be made<br />
at the rates specified in statute. Based on that assumption, the pension plan’s Fiduciary Net Position<br />
was projected to be available to make all projected future benefit payments of current active and inactive<br />
employees. Therefore, the long-term expected rate of return on pension plan investments was applied<br />
to all periods of projected benefit payments to determine the Total Pension Liability.<br />
Changes in Net Pension Liability<br />
Increase (Decease)<br />
Total Pension Plan Fiduciary Net Pension<br />
Liability Net Position Liability<br />
(a) (b) (a)-(b)<br />
Balance at 12/31/2019 $ 11,324,846 $ 10,160,021 $ 1,164,825<br />
Changes for the year:<br />
Service cost 949,953 - 949,953<br />
Interest 784,454 - 784,454<br />
Difference between expected<br />
and actual experience ( 154,487)<br />
- ( 154,487)<br />
Contributions - employer - 540,005 ( 540,005)<br />
Contributions - employee - 532,399 ( 532,399)<br />
Net investment income - 773,124 ( 773,124)<br />
Benefit payments, including refunds<br />
of employee contributions ( 356,560) ( 356,560)<br />
-<br />
Change in assumptions - - -<br />
Administrative expense - ( 4,990)<br />
4,990<br />
Other changes - ( 195)<br />
195<br />
Net changes 1,223,360 1,483,783 ( 260,423)<br />
Balance at 12/31/2020 $ 12,548,206 $ 11,643,804 $ 904,402<br />
38