Proc. Neutrino Astrophysics - MPP Theory Group
Proc. Neutrino Astrophysics - MPP Theory Group
Proc. Neutrino Astrophysics - MPP Theory Group

You also want an ePaper? Increase the reach of your titles
YUMPU automatically turns print PDFs into web optimized ePapers that Google loves.
The combined result of all 65 Gallex solar runs is 76.4 ± 6.3 +4.5<br />
−4.9 SNU. We note, however,<br />
that for the Gallex-IV period pulse shape information is used only for K-peak signals. The<br />
present result from Sage, 74 +11<br />
−10 +5<br />
−7 SNU [7], is in perfect agreement with Gallex.<br />
The overall results from both experiments are only about 60% of the predictions from solar<br />
model calculations, which constitutes an indication for non-standard neutrino properties, even<br />
without considering the results from other solar neutrino experiments.<br />
The 51 Cr neutrino source experiments<br />
In order to validate this conclusion and check the reliability and efficiency of their detectors,<br />
both collaborations have prepared intense (≈ 2MCi (Gallex) and 517kCi (Sage)) 51 Cr<br />
neutrino sources by neutron irradiating isotopically enriched Cr [3]. 51 Cr decays by EC and<br />
emits neutrinos of energy 750keV (decay to g.s., 90%) and 430keV (decay to 320keV excited<br />
level, 10%), nicely accommodating the neutrino energies of the solar 7 Be branch.<br />
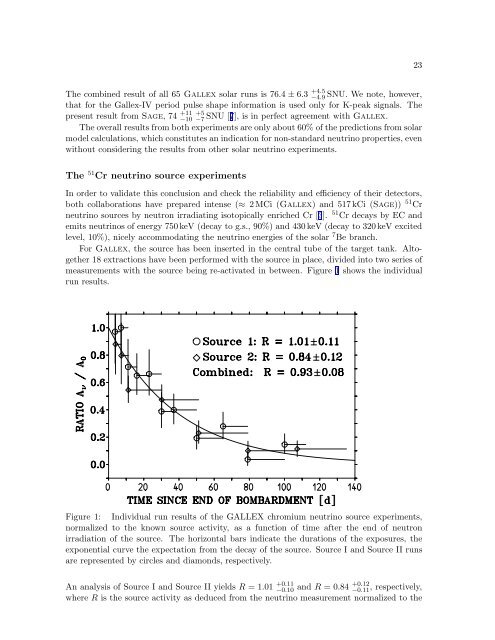
For Gallex, the source has been inserted in the central tube of the target tank. Altogether<br />
18 extractions have been performed with the source in place, divided into two series of<br />
measurements with the source being re-activated in between. Figure 1 shows the individual<br />
run results.<br />
Figure 1: Individual run results of the GALLEX chromium neutrino source experiments,<br />
normalized to the known source activity, as a function of time after the end of neutron<br />
irradiation of the source. The horizontal bars indicate the durations of the exposures, the<br />
exponential curve the expectation from the decay of the source. Source I and Source II runs<br />
are represented by circles and diamonds, respectively.<br />
An analysis of Source I and Source II yields R = 1.01 +0.11<br />
+0.12<br />
−0.10 and R = 0.84 −0.11 , respectively,<br />
where R is the source activity as deduced from the neutrino measurement normalized to the<br />
23