Capturing CO2 from ambient air - David Keith
Capturing CO2 from ambient air - David Keith
Capturing CO2 from ambient air - David Keith

You also want an ePaper? Increase the reach of your titles
YUMPU automatically turns print PDFs into web optimized ePapers that Google loves.
average surface area [m 2 -spray / m 3 reactor]<br />
6<br />
5.5<br />
5<br />
4.5<br />
4<br />
3.5<br />
3<br />
2.5<br />
2<br />
1.5<br />
1<br />
0.5<br />
no-coalescence prediction<br />
coalescence model<br />
0 0.1 0.2 0.3 0.4 0.5<br />
spray flow rate [L-solution / (s · m 2 0<br />
cross-section)]<br />
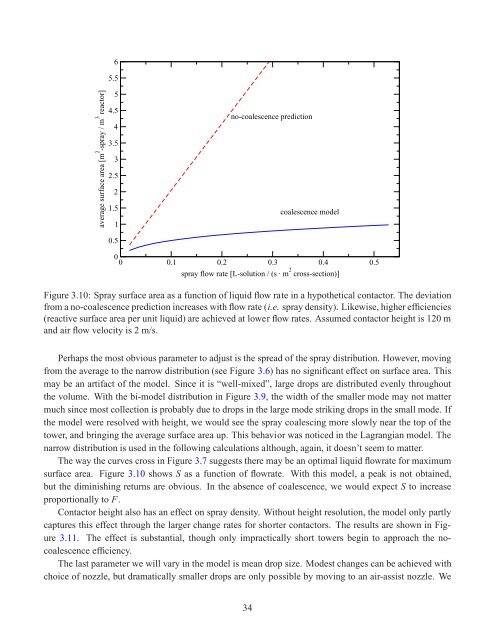
Figure 3.10: Spray surface area as a function of liquid flow rate in a hypothetical contactor. The deviation<br />
<strong>from</strong> a no-coalescence prediction increases with flow rate (i.e. spray density). Likewise, higher efficiencies<br />
(reactive surface area per unit liquid) are achieved at lower flow rates. Assumed contactor height is 120 m<br />
and <strong>air</strong> flow velocity is 2 m/s.<br />
Perhaps the most obvious parameter to adjust is the spread of the spray distribution. However, moving<br />
<strong>from</strong> the average to the narrow distribution (see Figure 3.6) has no significant effect on surface area. This<br />
may be an artifact of the model. Since it is “well-mixed”, large drops are distributed evenly throughout<br />
the volume. With the bi-model distribution in Figure 3.9, the width of the smaller mode may not matter<br />
much since most collection is probably due to drops in the large mode striking drops in the small mode. If<br />
the model were resolved with height, we would see the spray coalescing more slowly near the top of the<br />
tower, and bringing the average surface area up. This behavior was noticed in the Lagrangian model. The<br />
narrow distribution is used in the following calculations although, again, it doesn’t seem to matter.<br />
The way the curves cross in Figure 3.7 suggests there may be an optimal liquid flowrate for maximum<br />
surface area. Figure 3.10 shows S as a function of flowrate. With this model, a peak is not obtained,<br />
but the diminishing returns are obvious. In the absence of coalescence, we would expect S to increase<br />
proportionally to F.<br />
Contactor height also has an effect on spray density. Without height resolution, the model only partly<br />
captures this effect through the larger change rates for shorter contactors. The results are shown in Figure<br />
3.11. The effect is substantial, though only impractically short towers begin to approach the nocoalescence<br />
efficiency.<br />
The last parameter we will vary in the model is mean drop size. Modest changes can be achieved with<br />
choice of nozzle, but dramatically smaller drops are only possible by moving to an <strong>air</strong>-assist nozzle. We<br />
34