

Visualizing ArcGIS Data with Graphs, Animations, and Reporting Tools
Visualizing ArcGIS Data with Graphs, Animations, and Reporting Tools
Visualizing ArcGIS Data with Graphs, Animations, and Reporting Tools
SHOW LESS

You also want an ePaper? Increase the reach of your titles
YUMPU automatically turns print PDFs into web optimized ePapers that Google loves.
10<br />
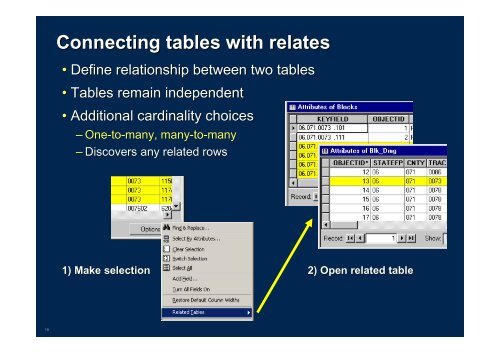
Connecting tables <strong>with</strong> relates<br />
• Define relationship between two tables<br />
• Tables remain independent<br />
• Additional cardinality choices<br />
– One-to One to-many, many, many-to many to-many many<br />
– Discovers any related rows<br />
1) Make selection<br />
2) Open related table