

Visualizing ArcGIS Data with Graphs, Animations, and Reporting Tools
Visualizing ArcGIS Data with Graphs, Animations, and Reporting Tools
Visualizing ArcGIS Data with Graphs, Animations, and Reporting Tools
SHOW LESS

You also want an ePaper? Increase the reach of your titles
YUMPU automatically turns print PDFs into web optimized ePapers that Google loves.
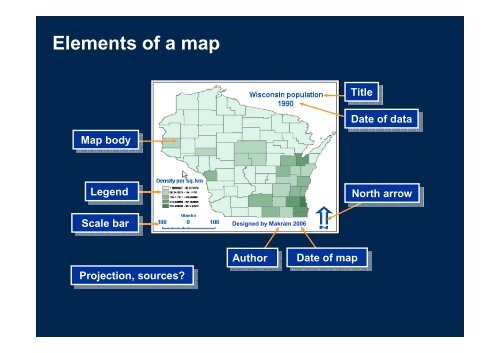
Elements of a map<br />
Map Map body body<br />
Legend<br />
Scale Scale bar bar<br />
Projection, sources?<br />
Designed by Makram 2006<br />
Author Author Date Date of of map map<br />
Title Title<br />
Date Date of of data data<br />
North North arrow<br />
arrow