

Visualizing ArcGIS Data with Graphs, Animations, and Reporting Tools
Visualizing ArcGIS Data with Graphs, Animations, and Reporting Tools
Visualizing ArcGIS Data with Graphs, Animations, and Reporting Tools

You also want an ePaper? Increase the reach of your titles
YUMPU automatically turns print PDFs into web optimized ePapers that Google loves.
6<br />
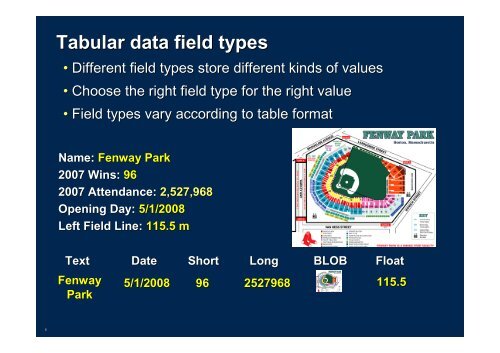
Tabular data field types<br />
• Different field types store different kinds of values<br />
• Choose the right field type for the right value<br />
• Field types vary according to table format<br />
Name: Fenway Park<br />
2007 Wins: 96<br />
2007 Attendance: 2,527,968<br />
Opening Day: 5/1/2008<br />
Left Field Line: 115.5 m<br />
Text Date Short Long BLOB Float<br />
Fenway<br />
Park<br />
5/1/2008 96 2527968 115.5