

Visualizing ArcGIS Data with Graphs, Animations, and Reporting Tools
Visualizing ArcGIS Data with Graphs, Animations, and Reporting Tools
Visualizing ArcGIS Data with Graphs, Animations, and Reporting Tools
SHOW LESS

Create successful ePaper yourself
Turn your PDF publications into a flip-book with our unique Google optimized e-Paper software.
46<br />
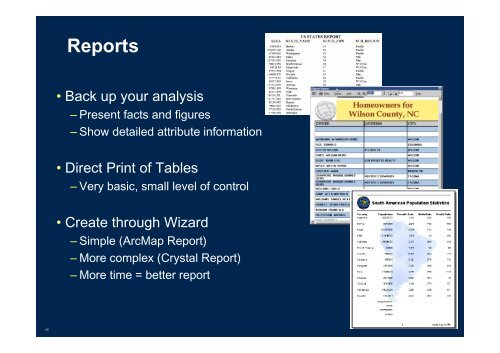
Reports<br />
• Back up your analysis<br />
– Present facts <strong>and</strong> figures<br />
– Show detailed attribute information<br />
• Direct Print of Tables<br />
– Very basic, small level of control<br />
• Create through Wizard<br />
– Simple (ArcMap Report)<br />
– More complex (Crystal Report)<br />
– More time = better report