

Visualizing ArcGIS Data with Graphs, Animations, and Reporting Tools
Visualizing ArcGIS Data with Graphs, Animations, and Reporting Tools
Visualizing ArcGIS Data with Graphs, Animations, and Reporting Tools
SHOW LESS

Create successful ePaper yourself
Turn your PDF publications into a flip-book with our unique Google optimized e-Paper software.
20<br />
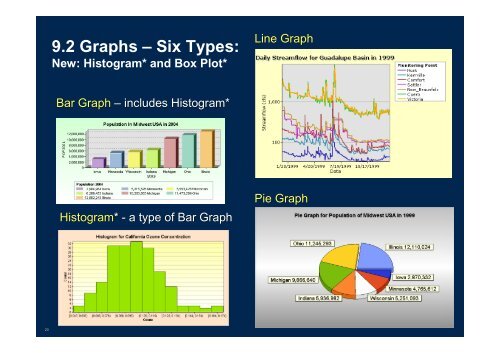
9.2 <strong>Graphs</strong> – Six Types:<br />
New: Histogram* <strong>and</strong> Box Plot*<br />
Bar Graph – includes Histogram*<br />
Histogram* Histogram*<br />
- a type of Bar Graph<br />
Line Graph<br />
Pie Graph