

Visualizing ArcGIS Data with Graphs, Animations, and Reporting Tools
Visualizing ArcGIS Data with Graphs, Animations, and Reporting Tools
Visualizing ArcGIS Data with Graphs, Animations, and Reporting Tools
SHOW LESS

You also want an ePaper? Increase the reach of your titles
YUMPU automatically turns print PDFs into web optimized ePapers that Google loves.
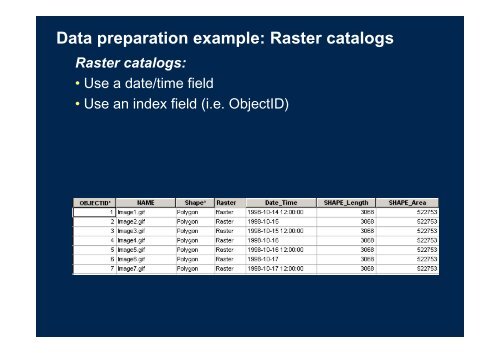
<strong>Data</strong> preparation example: Raster catalogs<br />
Raster catalogs:<br />
• Use a date/time field<br />
• Use an index field (i.e. ObjectID)