

Visualizing ArcGIS Data with Graphs, Animations, and Reporting Tools
Visualizing ArcGIS Data with Graphs, Animations, and Reporting Tools
Visualizing ArcGIS Data with Graphs, Animations, and Reporting Tools

You also want an ePaper? Increase the reach of your titles
YUMPU automatically turns print PDFs into web optimized ePapers that Google loves.
12<br />
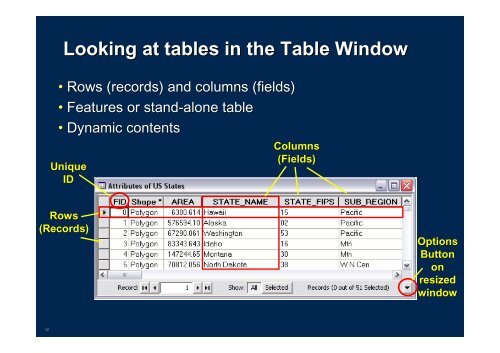
Looking Looking at at tables tables in in the the Table Table Window<br />
Window<br />
• Rows Rows (records) (records) <strong>and</strong> <strong>and</strong> columns columns (fields)<br />
(fields)<br />
• Features Features or or st<strong>and</strong>-alone st<strong>and</strong> alone table<br />
• Dynamic Dynamic contents<br />
contents<br />
Unique<br />
ID<br />
Rows<br />
(Records)<br />
Columns<br />
(Fields)<br />
Options<br />
Button<br />
on<br />
resized<br />
window