

Visualizing ArcGIS Data with Graphs, Animations, and Reporting Tools
Visualizing ArcGIS Data with Graphs, Animations, and Reporting Tools
Visualizing ArcGIS Data with Graphs, Animations, and Reporting Tools
SHOW LESS

Create successful ePaper yourself
Turn your PDF publications into a flip-book with our unique Google optimized e-Paper software.
26<br />
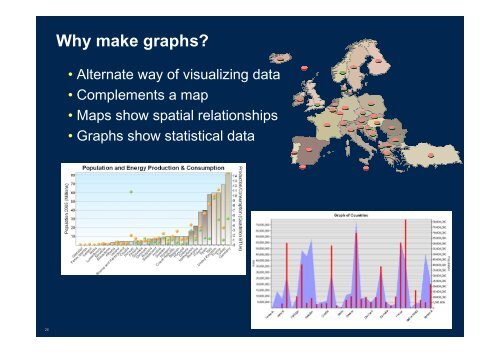
Why make graphs?<br />
• Alternate way of visualizing data<br />
• Complements a map<br />
• Maps show spatial relationships<br />
• <strong>Graphs</strong> show statistical data