

Visualizing ArcGIS Data with Graphs, Animations, and Reporting Tools
Visualizing ArcGIS Data with Graphs, Animations, and Reporting Tools
Visualizing ArcGIS Data with Graphs, Animations, and Reporting Tools
SHOW LESS

You also want an ePaper? Increase the reach of your titles
YUMPU automatically turns print PDFs into web optimized ePapers that Google loves.
18<br />
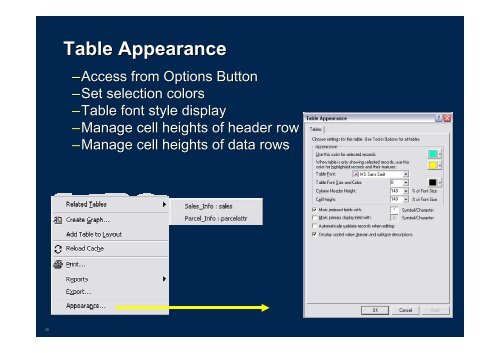
Table Table Appearance<br />
Appearance<br />
–Access Access from Options Button<br />
–Set Set selection colors<br />
–Table Table font style display<br />
–Manage Manage cell heights of header row<br />
–Manage Manage cell heights of data rows