

Visualizing ArcGIS Data with Graphs, Animations, and Reporting Tools
Visualizing ArcGIS Data with Graphs, Animations, and Reporting Tools
Visualizing ArcGIS Data with Graphs, Animations, and Reporting Tools
SHOW LESS

You also want an ePaper? Increase the reach of your titles
YUMPU automatically turns print PDFs into web optimized ePapers that Google loves.
16<br />
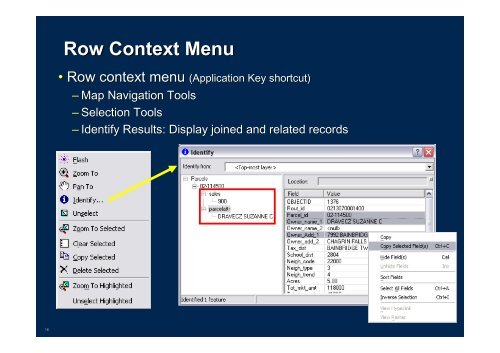
Row Row Context Context Menu<br />
Menu<br />
• Row Row context context menu menu (Application Key shortcut)<br />
– Map Navigation <strong>Tools</strong><br />
– Selection <strong>Tools</strong><br />
– Identify Results: Display joined <strong>and</strong> related records