

Visualizing ArcGIS Data with Graphs, Animations, and Reporting Tools
Visualizing ArcGIS Data with Graphs, Animations, and Reporting Tools
Visualizing ArcGIS Data with Graphs, Animations, and Reporting Tools
SHOW LESS

You also want an ePaper? Increase the reach of your titles
YUMPU automatically turns print PDFs into web optimized ePapers that Google loves.
24<br />
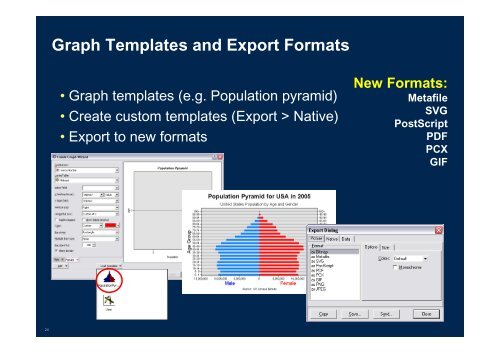
Graph Templates <strong>and</strong> Export Formats<br />
• Graph templates (e.g. Population pyramid)<br />
• Create custom templates (Export > Native)<br />
• Export to new formats<br />
New Formats:<br />
Metafile<br />
SVG<br />
PostScript<br />
PDF<br />
PCX<br />
GIF