Report and Accounts 2011 | 1 - Efacec
Report and Accounts 2011 | 1 - Efacec
Report and Accounts 2011 | 1 - Efacec

Create successful ePaper yourself
Turn your PDF publications into a flip-book with our unique Google optimized e-Paper software.
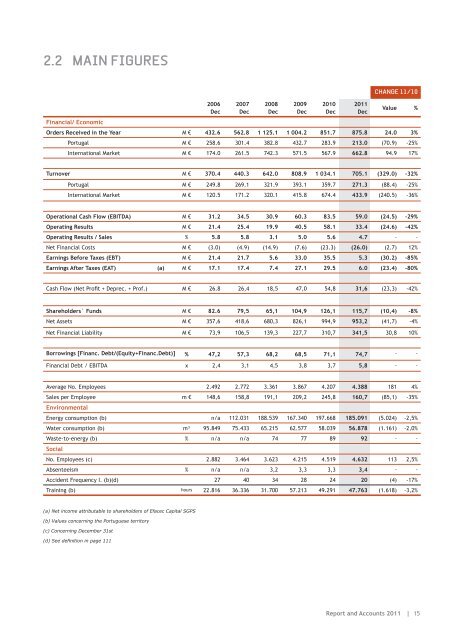
2.2 MAIN FIGURES<br />
Financial/ Economic<br />
2006<br />
Dec<br />
2007<br />
Dec<br />
2008<br />
Dec<br />
2009<br />
Dec<br />
2010<br />
Dec<br />
<strong>2011</strong><br />
Dec<br />
CHANGE 11/10<br />
Value %<br />
Orders Received in the Year M € 432.6 562.8 1 125.1 1 004.2 851.7 875.8 24.0 3%<br />
Portugal M € 258.6 301.4 382.8 432.7 283.9 213.0 (70.9) -25%<br />
International Market M € 174.0 261.5 742.3 571.5 567.9 662.8 94.9 17%<br />
Turnover M € 370.4 440.3 642.0 808.9 1 034.1 705.1 (329.0) -32%<br />
Portugal M € 249.8 269.1 321.9 393.1 359.7 271.3 (88.4) -25%<br />
International Market M € 120.5 171.2 320.1 415.8 674.4 433.9 (240.5) -36%<br />
Operational Cash Flow (EBITDA) M € 31.2 34.5 30.9 60.3 83.5 59.0 (24.5) -29%<br />
Operating Results M € 21.4 25.4 19.9 40.5 58.1 33.4 (24.6) -42%<br />
Operating Results / Sales % 5.8 5.8 3.1 5.0 5.6 4.7 - -<br />
Net Financial Costs M € (3.0) (4.9) (14.9) (7.6) (23.3) (26.0) (2.7) 12%<br />
Earnings Before Taxes (EBT) M € 21.4 21.7 5.6 33.0 35.5 5.3 (30.2) -85%<br />
Earnings After Taxes (EAT) (a) M € 17.1 17.4 7.4 27.1 29.5 6.0 (23.4) -80%<br />
��������������������������������������� M € 26.8 26,4 18,5 47,0 54,8 31,6 (23,3) -42%<br />
Shareholders` Funds M € 82.6 79,5 65,1 104,9 126,1 115,7 (10,4) -8%<br />
Net Assets M € 357,6 418,6 680,3 826,1 994,9 953,2 (41,7) -4%<br />
����������������������� M € 73,9 106,5 139,3 227,7 310,7 341,5 30,8 10%<br />
Borrowings [Financ. Debt/(Equity+Financ.Debt)] % 47,2 57,3 68,2 68,5 71,1 74,7 - -<br />
Financial Debt / EBITDA x 2,4 3,1 4,5 3,8 3,7 5,8 - -<br />
Average No. Employees 2.492 2.772 3.361 3.867 4.207 4.388 181 4%<br />
Sales per Employee m € 148,6 158,8 191,1 209,2 245,8 160,7 (85,1) -35%<br />
Environmental<br />
Energy consumption (b) n/a 112.031 188.539 167.340 197.668 185.091 (5.024) -2,5%<br />
Water consumption (b) m³ 95.849 75.433 65.215 62.577 58.039 56.878 (1.161) -2,0%<br />
Waste-to-energy (b) % n/a n/a 74 77 89 92 - -<br />
Social<br />
No. Employees (c) 2.882 3.464 3.623 4.215 4.519 4.632 113 2,5%<br />
Absenteeism % n/a n/a 3,2 3,3 3,3 3,4 - -<br />
Accident Frequency I. (b)(d) 27 40 34 28 24 20 (4) -17%<br />
Training (b) hours 22.816 36.336 31.700 57.213 49.291 47.763 (1.618) -3,2%<br />
(a) Net income attributable to shareholders of <strong>Efacec</strong> Capital SGPS<br />
(b) Values concerning the Portuguese territory<br />
(c) Concerning December 31st<br />
�����������������������������<br />
<strong>Report</strong> <strong>and</strong> <strong>Accounts</strong> <strong>2011</strong> | 15