- Page 1 and 2:
Methods in Molecular BiologyTM Biol
- Page 3 and 4:
M E T H O D S I N M O L E C U L A R
- Page 5 and 6:
© 2002 Humana Press Inc. 999 River
- Page 8 and 9:
Preface Calcium plays an important
- Page 10 and 11:
Contents Dedication ...............
- Page 12:
Contents xi 26 Enzymatic Assays to
- Page 15 and 16:
xiv Contents of Companion Volume 15
- Page 17 and 18:
xvi Contributors LESLIE D. HICKS
- Page 19 and 20:
20 Dean, Kelsey, and Re
- Page 21 and 22:
2 Yazawa
- Page 23 and 24:
4 Yazawa Fig. 1. Schematic represen
- Page 25 and 26:
6 Yazawa Fig. 2. Shop drawing for t
- Page 27 and 28:
8 Yazawa DuPont-NEN and the molar c
- Page 29 and 30:
10 Yazawa Fig. 4. Examples of the C
- Page 31 and 32:
12 Yazawa 5. Plot the calculated Ca
- Page 33 and 34:
14 Yazawa 12. Starovasnik, M. A., D
- Page 35 and 36:
16 Fig. 1. Molecular structures and
- Page 37 and 38:
18 Linse 7. 0.1 M EDTA. Dissolve 37
- Page 39 and 40:
20 Linse iterate the other paramete
- Page 41 and 42:
22 Linse tive to small alterations
- Page 43 and 44:
24 Linse References 1. Tsien, R. Y.
- Page 45 and 46:
26 Haiech and Kilhoffer to use the
- Page 47 and 48:
28 Haiech and Kilhoffer where γ is
- Page 49 and 50:
30 Haiech and Kilhoffer reporter gr
- Page 51 and 52:
32 Haiech and Kilhoffer tein with i
- Page 53 and 54:
34 Haiech and Kilhoffer Calmodulin
- Page 55 and 56:
36 Haiech and Kilhoffer Fig. 3. Mec
- Page 57 and 58:
38 Haiech and Kilhoffer We may sugg
- Page 59 and 60:
40 Haiech and Kilhoffer 29. Stewart
- Page 61 and 62:
42 Haiech and Kilhoffer 62. Becking
- Page 63 and 64:
44 Martin and Bayley Fig. 1. Absorp
- Page 65 and 66:
46 Martin and Bayley evaporation. C
- Page 67 and 68:
48 Martin and Bayley 4. Set the tem
- Page 69 and 70:
50 Martin and Bayley Fig. 2. Near-U
- Page 71 and 72:
52 Martin and Bayley discussed by M
- Page 73 and 74:
54 Martin and Bayley References 1.
- Page 75 and 76:
20 Dean, Kelsey, and Reik
- Page 77 and 78:
58 Fabian and Vogel are equipped wi
- Page 79 and 80:
60 Fabian and Vogel The penetration
- Page 81 and 82:
62 Fabian and Vogel perature, ionic
- Page 83 and 84:
64 Fabian and Vogel Fig. 3. IR spec
- Page 85 and 86:
66 Fabian and Vogel Fig. 4. Lower t
- Page 87 and 88:
68 Fabian and Vogel These correlati
- Page 89 and 90:
70 Fabian and Vogel Fig. 5. Amide I
- Page 91 and 92:
72 Fabian and Vogel 4. ATR-FTIR spe
- Page 93 and 94:
74 Fabian and Vogel 25. Georg, H.,
- Page 95 and 96:
76 Weljie and Vogel Fig. 1. Simplif
- Page 97 and 98:
78 Weljie and Vogel Fig. 3. Steady-
- Page 99 and 100:
80 Weljie and Vogel VIS spectrophot
- Page 101 and 102:
82 Weljie and Vogel 4. A series of
- Page 103 and 104:
84 Table 1 Advanced Fluorescence Me
- Page 105 and 106:
86 Weljie and Vogel References 1. L
- Page 107 and 108:
20 Dean, Kelsey, and Reik
- Page 109 and 110:
90 Johnson and Tikunova is removed
- Page 111 and 112:
92 Johnson and Tikunova function of
- Page 113 and 114:
94 Johnson and Tikunova Fig. 2. Rat
- Page 115 and 116:
96 Johnson and Tikunova Fig. 3. Rat
- Page 117 and 118:
98 Johnson and Tikunova Fig. 4. Ca
- Page 119 and 120:
100 Johnson and Tikunova cence inte
- Page 121 and 122:
102 Johnson and Tikunova 6. Johnson
- Page 123 and 124:
104 Julenius Fig. 1. Under conditio
- Page 125 and 126:
106 Julenius 3. Mix 50 µL of NHS s
- Page 127 and 128:
108 Julenius Fig. 3. A typical sens
- Page 129 and 130:
110 Julenius (2), is used in the Ia
- Page 131 and 132:
20 Dean, Kelsey, and Reik
- Page 133 and 134:
114 Lopez and Makhatadze Fig. 1. Th
- Page 135 and 136:
116 Lopez and Makhatadze 6. Buffers
- Page 137 and 138:
118 Lopez and Makhatadze The excess
- Page 139 and 140:
20 Dean, Kelsey, and Reik
- Page 141 and 142:
122 Lopez and Makhatadze Fig. 1. Is
- Page 143 and 144:
124 Lopez and Makhatadze 2.5 mL are
- Page 145 and 146:
126 Lopez and Makhatadze pendence o
- Page 147 and 148:
128 Hicks et al. equipped with a pu
- Page 149 and 150:
130 Hicks et al. Fig. 2. Debye plot
- Page 151 and 152:
132 Hicks et al. and 1.0 mg/mL for
- Page 153 and 154:
134 Hicks et al. Fig. 3. Sedimentat
- Page 155 and 156:
136 Hicks et al. 5. Hayes, D. B. (M
- Page 157 and 158:
138 Trewhella and Krueger This chap
- Page 159 and 160:
140 Trewhella and Krueger of the sc
- Page 161 and 162:
142 Trewhella and Krueger Table 1 C
- Page 163 and 164:
144 Trewhella and Krueger beam, or
- Page 165 and 166:
146 Trewhella and Krueger At very l
- Page 167 and 168:
148 Trewhella and Krueger analytica
- Page 169 and 170:
150 Trewhella and Krueger collapsed
- Page 171 and 172:
152 Trewhella and Krueger P(r) func
- Page 173 and 174:
154 Trewhella and Krueger Fig. 3. S
- Page 175 and 176:
156 Trewhella and Krueger concentra
- Page 177 and 178:
158 Trewhella and Krueger by a Nati
- Page 179 and 180:
20 Dean, Kelsey, and Reik
- Page 181 and 182:
162 Doherty-Kirby and Lajoie metal
- Page 183 and 184:
164 Doherty-Kirby and Lajoie two Ca
- Page 185 and 186:
166 Doherty-Kirby and Lajoie 7. Pep
- Page 187 and 188:
168 Doherty-Kirby and Lajoie Fig. 1
- Page 189 and 190:
170 Doherty-Kirby and Lajoie Fig. 2
- Page 191 and 192:
172 Doherty-Kirby and Lajoie 5. Alt
- Page 193 and 194:
174 Doherty-Kirby and Lajoie phosph
- Page 195 and 196:
176 Shaw Fig. 1. Ribbon drawing of
- Page 197 and 198:
178 Shaw 2.3. Other 1. Chemicals fo
- Page 199 and 200:
180 Shaw 3.3.3. Purification 1. Con
- Page 201 and 202:
182 Shaw 10. Hodges, R. S., Semchuk
- Page 203 and 204:
184 Brokx and Vogel Table 1 An Over
- Page 205 and 206:
186 Brokx and Vogel Fig. 1. UV abso
- Page 207 and 208:
188 Brokx and Vogel Fig. 2. 20% SDS
- Page 209 and 210:
190 Brokx and Vogel it through an a
- Page 211 and 212:
192 Brokx and Vogel 8. Weljie, A. M
- Page 213 and 214:
20 Dean, Kelsey, and Reik
- Page 215 and 216:
196 Berliner Fig. 1. Aqueous X-band
- Page 217 and 218:
198 Berliner in the Bruker instrume
- Page 219 and 220:
200 Berliner Fig. 3. ESR spectra of
- Page 221 and 222:
202 Berliner Fig. 5. Low-temperatur
- Page 223 and 224:
204 Berliner 14. Musci, G., Reed, G
- Page 225 and 226:
206 Clarke and Vogel cal calcium-bi
- Page 227 and 228:
208 Clarke and Vogel Fig. 1. 113 Cd
- Page 229 and 230:
210 Clarke and Vogel Fig. 3. 113 Cd
- Page 231 and 232:
212 Clarke and Vogel Fig. 5. 113 Cd
- Page 233 and 234:
214 Clarke and Vogel The linewidth
- Page 235 and 236:
20 Dean, Kelsey, and Reik
- Page 237 and 238:
218 Drakenberg sands, of Hertz broa
- Page 239 and 240:
220 Drakenberg 1. Bloch equations m
- Page 241 and 242:
222 Drakenberg Fig. 2. Measurement
- Page 243 and 244:
224 Drakenberg Fig. 3. (A) 43 Ca NM
- Page 245 and 246:
226 Drakenberg Fig. 5. 43 Ca NMR sp
- Page 247 and 248:
228 Drakenberg NMR at sub-mM concen
- Page 249 and 250:
230 Drakenberg 30. Shimizu, T., Hat
- Page 251 and 252:
232 Weljie and Heringa Table 1 Amin
- Page 253 and 254:
234 Weljie and Heringa Table 2 Webs
- Page 255 and 256:
236 Weljie and Heringa diction meth
- Page 257 and 258:
238 Weljie and Heringa these databa
- Page 259 and 260:
240 Weljie and Heringa lineages. Th
- Page 261 and 262:
242 Weljie and Heringa compared, an
- Page 263 and 264:
244 Weljie and Heringa sequences as
- Page 265 and 266:
246 Weljie and Heringa much larger
- Page 267 and 268:
248 Weljie and Heringa ment require
- Page 269 and 270:
250 Weljie and Heringa 10. Kawasaki
- Page 271 and 272:
252 Weljie and Heringa 44. Thompson
- Page 273 and 274:
254 Weljie and Heringa
- Page 275 and 276:
256 Li et al. In order for these ex
- Page 277 and 278:
258 Li et al. 7. Mineral Mixture (s
- Page 279 and 280:
260 Li et al. 3. When the 45% D 2O/
- Page 281 and 282:
262 Li et al. sion system works eff
- Page 283 and 284:
264 Li et al. reliably produce high
- Page 285 and 286:
20 Dean, Kelsey, and Reik
- Page 287 and 288:
268 Mal et al. NMR data, X-PLOR (11
- Page 289 and 290:
270 Mal et al. Table 1 Simulated An
- Page 291 and 292:
272 Mal et al. 3.1.2.1. AMBIGUOUS D
- Page 293 and 294:
274 Mal et al. molecular dynamics a
- Page 295 and 296:
276 Mal et al. Assuming a rigid bod
- Page 297 and 298:
278 Mal et al. assign (segid A and
- Page 299 and 300:
280 Mal et al. References 1. Drenth
- Page 301 and 302:
282 Mal et al. 33. Jeener, J., Meie
- Page 303 and 304:
20 Dean, Kelsey, and Reik
- Page 305 and 306:
286 Werner et al. Our research has
- Page 307 and 308:
288 Fig. 1. (A) T 1, T 2 and the he
- Page 309 and 310:
290 Werner et al. tion, using gradi
- Page 311 and 312:
292 Werner et al. Fig. 3. (A) Rotat
- Page 313 and 314:
294 Werner et al. Fig. 4. (A) Line-
- Page 315 and 316:
296 Werner et al. Table 2 Models of
- Page 317 and 318:
298 Werner et al. 9. Reinhardt, D.
- Page 319 and 320:
300 Werner et al. 39. Press, W. H.,
- Page 321 and 322:
302 Boyd et al. utilize residual di
- Page 323 and 324:
304 Boyd et al. Fig. 1. (A) The sol
- Page 325 and 326:
306 Boyd et al. or significant peak
- Page 327 and 328:
308 Boyd et al. Fig. 3. Histogram o
- Page 329 and 330:
310 Boyd et al. total and NOE energ
- Page 331 and 332:
312 Boyd et al. 2. When studying mu
- Page 333 and 334:
314 Boyd et al. 4. Downing, A. K.,
- Page 335 and 336:
316 Boyd et al. 35. Schulte-Herbrug
- Page 337 and 338:
318 Yap et al. image representation
- Page 339 and 340: 320 Yap et al. modified EF-hand is
- Page 341 and 342: 322 Table 1 Angle and Distance Outp
- Page 343 and 344: 324 Yap et al. 2. Ikura, M. (1995)
- Page 345 and 346: 326 Kobayashi that S-100A1 and S-10
- Page 347 and 348: 328 Kobayashi 3.2. Coupling of Crom
- Page 349 and 350: 330 Kobayashi Fig. 2. Tricine/SDS/P
- Page 351 and 352: 332 Kobayashi 0.1% TFA at a flow ra
- Page 353 and 354: 334 Kobayashi Both recombinant S-10
- Page 355 and 356: 336 Kobayashi Fig. 6. Affinity chro
- Page 357 and 358: 20 Dean, Kelsey, and Reik
- Page 359 and 360: 340 Walsh et al. verts CaM from an
- Page 361 and 362: 342 Walsh et al. 11. Bovine serum a
- Page 363 and 364: 344 Walsh et al. Fig. 1. CaM-depend
- Page 365 and 366: 346 Walsh et al. Fig. 3. CaM-depend
- Page 367 and 368: 348 Walsh et al. 3.5. NOS Reduction
- Page 369 and 370: 350 Walsh et al. Fig. 4. CaM-depend
- Page 371 and 372: 352 Walsh et al. Fig. 6. CaM-depend
- Page 373 and 374: 354 Walsh et al. 3. Cho, M. J., Vag
- Page 375 and 376: 356 Hughes et al. The electroporati
- Page 377 and 378: 358 Hughes et al. 4. 1 M Na 2CO 3.
- Page 379 and 380: 360 Hughes et al. range, repeat ste
- Page 381 and 382: 362 Hughes et al. Table 1 Examples
- Page 383 and 384: 20 Dean, Kelsey, and Reik
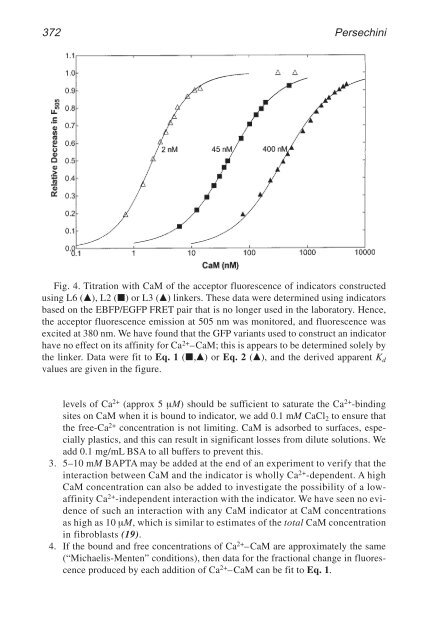
- Page 385 and 386: 366 Persechini of the different CaM
- Page 387 and 388: 368 Persechini Fig. 1. Schematic re
- Page 389: 370 Persechini 2. 1 L of Terrific b
- Page 393 and 394: 374 Persechini Table 1 Parameters f
- Page 395 and 396: 376 Persechini Fig. 6. The [Ca 2+ -
- Page 397 and 398: 378 Persechini determined if the di
- Page 399 and 400: 380 Persechini relatively insensiti
- Page 401 and 402: 382 Persechini 18. Chafouleas, J. G
- Page 403 and 404: 384 Török et al. actions in the c
- Page 405 and 406: 386 Török et al. 3. The reaction
- Page 407 and 408: 388 Török et al. Fig. 2. Electros
- Page 409 and 410: 390 Török et al. Fig. 3. Peptides
- Page 411 and 412: 392 Török et al. Table 1 Peptide
- Page 413 and 414: 394 Török et al. Fig. 7. Nanospra
- Page 415 and 416: 396 Török et al. Fig. 9. Nanospra
- Page 417 and 418: 398 Török et al. Fig. 11. Electro
- Page 419 and 420: 400 Török et al. 3 µM FL-calmodu
- Page 421 and 422: 402 Török et al. Fig. 14. Localiz
- Page 423 and 424: 404 Török et al. Fig. 16. Indicat
- Page 425 and 426: 406 Török et al. the significantl
- Page 427 and 428: 408 Török et al.
- Page 429 and 430: 410 Index substitutes, see Fluoresc
- Page 431 and 432: 412 Index Stern-Volmer plot, 78, 81
- Page 433 and 434: 414 Index Phenothiazines, see Calmo
- Page 435: METHODS IN MOLECULAR BIOLOGY TM •