VUV Spectroscopy of Atoms, Molecules and Surfaces
VUV Spectroscopy of Atoms, Molecules and Surfaces
VUV Spectroscopy of Atoms, Molecules and Surfaces

You also want an ePaper? Increase the reach of your titles
YUMPU automatically turns print PDFs into web optimized ePapers that Google loves.
6.3 Results <strong>and</strong> discussion 135<br />
Ion signal (arb. units)<br />
10<br />
1<br />
0.1<br />
6x10 -5 mB<br />
1x10 -4 mB<br />
3x10 -4 mB<br />
6x10 -4 mB<br />
0.0 0.5 1.0 1.5 2.0<br />
Delay (ns)<br />
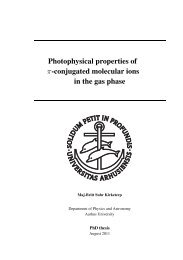
Figure 6.3: Semilogarithmic plot <strong>of</strong> the He + ion signal as a function <strong>of</strong> pump-probe delay<br />
for four different He pressures.<br />
four different pressures. For all <strong>of</strong> the measurements presented, a probepulse<br />
energy <strong>of</strong> ∼350 µJ/pulse was used. The point <strong>of</strong> zero delay has been<br />
(arbitrarily) chosen as the delay corresponding to a maximum in the ion<br />
signal. From figure 6.3 the spike is seen to develop when the pressure is<br />
increased from 6×10 −5 mB to 6×10 −4 mB, the latter being the maximum<br />
pressure applied considering the presence <strong>of</strong> the EMT’s. The development<br />
<strong>of</strong> the spike is seen to be accompanied by an almost one order-<strong>of</strong>-magnitude<br />
decrease in the ion signal at long delays, implying a much reduced statistics<br />
in the tails <strong>of</strong> the decay curves. Abstracting from the consequent scatter in<br />
the data points it is evident that the slopes <strong>of</strong> the curves are constant, <strong>and</strong><br />
”only” the uncertainty on the measured lifetime is affected by the presence<br />
<strong>of</strong> the spike. The influence <strong>of</strong> the pressure is further illustrated in figure<br />
6.4where the magnitude <strong>of</strong> the ion signal at zero (black) <strong>and</strong> 0.23 ns (grey)<br />
delays, respectively, is depicted as a function <strong>of</strong> pressure. The <strong>of</strong>f-spike ion<br />
signal increases up to ∼2×10 −5 mB <strong>and</strong> then decreases, while the on-spike<br />
signal increases up to ∼6×10 −4 mB <strong>and</strong> then saturates. The presence <strong>of</strong><br />
the spike is also signified in the harmonic spectral pr<strong>of</strong>ile which is broadened<br />
by almost a factor <strong>of</strong> two when the pump- <strong>and</strong> probe pulses overlap in time.<br />
This is illustrated in figure 6.5, showing the apparent harmonic pr<strong>of</strong>ile at zero<br />
(black) <strong>and</strong> 0.23 ns (grey) delays, respectively, for a pressure <strong>of</strong> 6×10 −4 mB.<br />
Subsequent fits <strong>of</strong> the pr<strong>of</strong>iles to a Gaussian function yielded widths (FWHM)<br />
<strong>of</strong> 0.0057 <strong>and</strong> 0.0035 nm for the on- <strong>and</strong> <strong>of</strong>f-spike conditions, respectively, <strong>and</strong><br />
corresponding mean wavelengths <strong>of</strong> 58.4292 <strong>and</strong> 58.4295 nm.