VUV Spectroscopy of Atoms, Molecules and Surfaces
VUV Spectroscopy of Atoms, Molecules and Surfaces
VUV Spectroscopy of Atoms, Molecules and Surfaces

You also want an ePaper? Increase the reach of your titles
YUMPU automatically turns print PDFs into web optimized ePapers that Google loves.
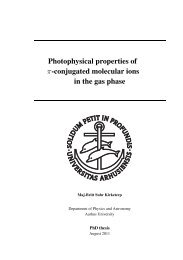
70 Lifetimes <strong>of</strong> molecular negative ions<br />
DETACHMENT YIELD<br />
10 3<br />
10 2<br />
10 1<br />
0 10 20 30 40<br />
TIME (ms)<br />
Figure 4.3: Semilogarithmic plot <strong>of</strong> the detachment yield versus time after injection for a<br />
CO −<br />
2 beam produced by charge exchange <strong>of</strong> CO+ 2 ions. The solid curve represents a fit to<br />
two exponentials <strong>and</strong> a constant background. Error bars represent a statistical uncertainty<br />
<strong>of</strong> one st<strong>and</strong>ard deviation.<br />
repeatedly, successively disregarding more <strong>and</strong> more data points from the<br />
left (short times). In any case, data points corresponding to the first few<br />
revolutions <strong>of</strong> ions in the ring are disregarded, since they could be influenced<br />
by initial state effects like, e.g., slit scattering <strong>of</strong> the beam. While the absence<br />
<strong>of</strong> a long-lived (1–5 s) component was expected, the presence <strong>of</strong> one or<br />
more millisecond components instead <strong>of</strong> the expected ∼90 µs componentis<br />
surprising. Showing a slight systematic deviation from linearity on a semilogarithmic<br />
scale, the data were fitted to two exponentials added to a constant<br />
background, as measured with no ions in the ring. By this procedure, lifetimes<br />
<strong>of</strong> 3.3 ± 0.4ms <strong>and</strong> 7.8 ± 0.3 ms, respectively, were obtained for the<br />
data presented in figure 4.3. The two lifetimes may be attributed to different<br />
vibrational levels <strong>of</strong> the same electronic state <strong>and</strong> are sufficiently close that<br />
more than two components may be hidden in the decay. The values stated<br />
should thus be considered vibrational averages, sensitive to the conditions<br />
prevailing in the ion source.<br />
The resolution <strong>of</strong> the experiment would have permitted observation <strong>of</strong> the<br />
∼90 µs component, if represented by at least ∼1 %<strong>of</strong>theCO − 2 ions. The ap-<br />
parent absence <strong>of</strong> such CO − 2<br />
ions may be explained by the production method<br />
applied. Assuming the CO + 2 ions from the ion source to be in the 2 Πg ground<br />
state upon entering the charge-exchange cell <strong>and</strong> considering the ionization<br />
energies <strong>of</strong> 13.76 eV <strong>and</strong> 4.33 eV for CO2 [51] <strong>and</strong> potassium, respectively,