VUV Spectroscopy of Atoms, Molecules and Surfaces
VUV Spectroscopy of Atoms, Molecules and Surfaces
VUV Spectroscopy of Atoms, Molecules and Surfaces

You also want an ePaper? Increase the reach of your titles
YUMPU automatically turns print PDFs into web optimized ePapers that Google loves.
3.1 Introduction 45<br />
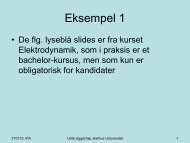
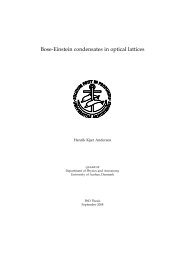
Cross section (arb. units)<br />
200<br />
150<br />
100<br />
50<br />
0<br />
10.92 10.94 10.96 10.98 11.00<br />
600<br />
400<br />
200<br />
0<br />
10.927 10.928<br />
60<br />
(b) (c)<br />
40<br />
20<br />
0<br />
Photon energy (eV)<br />
(a)<br />
10.9550 10.9555<br />
Figure 3.1: (a) Relative photodetachment cross section <strong>of</strong> D− in the vicinity <strong>of</strong> the<br />
D(n=2) threshold measured by Andersen et al. [13] <strong>and</strong> normalized to the theoretical<br />
results <strong>of</strong> Lindroth [13]. The scanned energy range includes the 2 {0} −<br />
3 <strong>and</strong> 2 {0}− 4 Feshbach<br />
resonances <strong>and</strong> the 2 {0} +<br />
2 shape resonace. (b) The 2 {0}− 3 resonance shown on an<br />
enlarged scale, fitted to a Fano pr<strong>of</strong>ile convolved with a Gaussian function representing the<br />
experimental resolution. (c) The 2 {0} −<br />
4 resonance shown on an enlarged scale, fitted to a<br />
Gaussian function.<br />
<strong>of</strong> the 2 {0} + 2 shape resonance, which appears non-smooth due to variations in<br />
the laser- <strong>and</strong> ion-beam overlap. This is a consequence <strong>of</strong> the large scaling in<br />
ion-beam energy required to scan the relatively broad photon-energy range<br />
covered by this structure. The measured cross section is relative, <strong>and</strong> each<br />
<strong>of</strong> the three segments has been normalized to the cross section calculated by<br />
Lindroth <strong>and</strong> convolved with the experimental resolution (solid curve). The<br />
2 {0}−3 <strong>and</strong> 2 {0}−4 resonances are shown on an enlarged scale in figures 3.1