

An Action Plan for Developing Agricultural Input Markets in Tanzania
An Action Plan for Developing Agricultural Input Markets in Tanzania
An Action Plan for Developing Agricultural Input Markets in Tanzania

You also want an ePaper? Increase the reach of your titles
YUMPU automatically turns print PDFs into web optimized ePapers that Google loves.
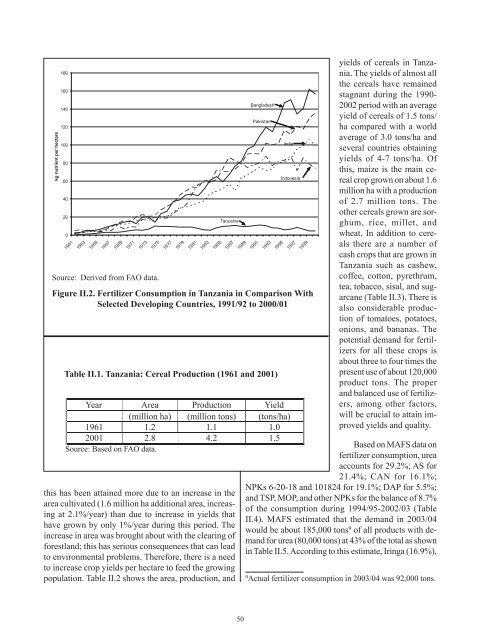
Source: Derived from FAO data.<br />
Figure II.2. Fertilizer Consumption <strong>in</strong> <strong>Tanzania</strong> <strong>in</strong> Comparison With<br />
Selected <strong>Develop<strong>in</strong>g</strong> Countries, 1991/92 to 2000/01<br />
Table II.1. <strong>Tanzania</strong>: Cereal Production (1961 and 2001)<br />
Source: Based on FAO data.<br />
this has been atta<strong>in</strong>ed more due to an <strong>in</strong>crease <strong>in</strong> the<br />
area cultivated (1.6 million ha additional area, <strong>in</strong>creas<strong>in</strong>g<br />
at 2.1%/year) than due to <strong>in</strong>crease <strong>in</strong> yields that<br />
have grown by only 1%/year dur<strong>in</strong>g this period. The<br />
<strong>in</strong>crease <strong>in</strong> area was brought about with the clear<strong>in</strong>g of<br />
<strong>for</strong>estland; this has serious consequences that can lead<br />
to environmental problems. There<strong>for</strong>e, there is a need<br />
to <strong>in</strong>crease crop yields per hectare to feed the grow<strong>in</strong>g<br />
population. Table II.2 shows the area, production, and<br />
50<br />
yields of cereals <strong>in</strong> <strong>Tanzania</strong>.<br />
The yields of almost all<br />
the cereals have rema<strong>in</strong>ed<br />
stagnant dur<strong>in</strong>g the 1990-<br />
2002 period with an average<br />
yield of cereals of 1.5 tons/<br />
ha compared with a world<br />
average of 3.0 tons/ha and<br />
several countries obta<strong>in</strong><strong>in</strong>g<br />
yields of 4-7 tons/ha. Of<br />
this, maize is the ma<strong>in</strong> cereal<br />
crop grown on about 1.6<br />
million ha with a production<br />
of 2.7 million tons. The<br />
other cereals grown are sorghum,<br />
rice, millet, and<br />
wheat. In addition to cereals<br />
there are a number of<br />
cash crops that are grown <strong>in</strong><br />
<strong>Tanzania</strong> such as cashew,<br />
coffee, cotton, pyrethrum,<br />
tea, tobacco, sisal, and sugarcane<br />
(Table II.3). There is<br />
also considerable production<br />
of tomatoes, potatoes,<br />
onions, and bananas. The<br />
potential demand <strong>for</strong> fertilizers<br />
<strong>for</strong> all these crops is<br />
about three to four times the<br />
present use of about 120,000<br />
product tons. The proper<br />
and balanced use of fertilizers,<br />
among other factors,<br />
will be crucial to atta<strong>in</strong> improved<br />
yields and quality.<br />
Based on MAFS data on<br />
fertilizer consumption, urea<br />
accounts <strong>for</strong> 29.2%; AS <strong>for</strong><br />
21.4%; CAN <strong>for</strong> 16.1%;<br />
NPKs 6-20-18 and 101824 <strong>for</strong> 19.1%; DAP <strong>for</strong> 5.5%;<br />
and TSP, MOP, and other NPKs <strong>for</strong> the balance of 8.7%<br />
of the consumption dur<strong>in</strong>g 1994/95-2002/03 (Table<br />
II.4). MAFS estimated that the demand <strong>in</strong> 2003/04<br />
would be about 185,000 tons 9 of all products with demand<br />
<strong>for</strong> urea (80,000 tons) at 43% of the total as shown<br />
<strong>in</strong> Table II.5. Accord<strong>in</strong>g to this estimate, Ir<strong>in</strong>ga (16.9%),<br />
9 Actual fertilizer consumption <strong>in</strong> 2003/04 was 92,000 tons.


