2011 - Li & Fung Limited
2011 - Li & Fung Limited
2011 - Li & Fung Limited
- TAGS
- fung
- limited
- www.lifung.com

Create successful ePaper yourself
Turn your PDF publications into a flip-book with our unique Google optimized e-Paper software.
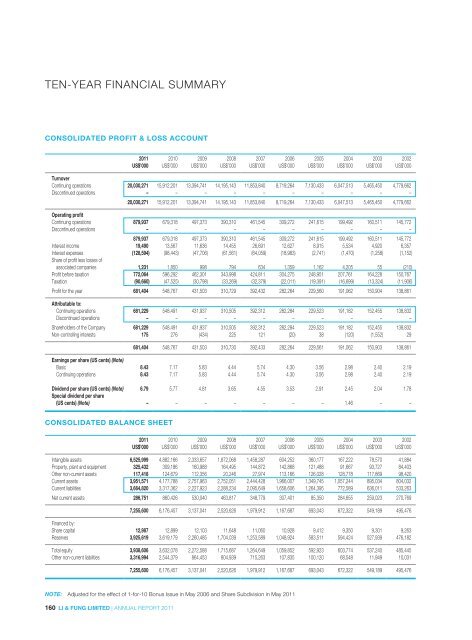
TEN-YEAR FINANCIAL SUMMARY<br />
CONSOLIDATED PROFIT & LOSS ACCOUNT<br />
160 LI & FUNG LIMITED | ANNUAL REPORT <strong>2011</strong><br />
<strong>2011</strong> 2010 2009 2008 2007 2006 2005 2004 2003 2002<br />
US$’000 US$’000 US$’000 US$’000 US$’000 US$’000 US$’000 US$’000 US$’000 US$’000<br />
Turnover<br />
Continuing operations 20,030,271 15,912,201 13,394,741 14,195,143 11,853,840 8,719,264 7,130,433 6,047,513 5,465,450 4,779,662<br />
Discontinued operations – – – – – – – – – –<br />
20,030,271 15,912,201 13,394,741 14,195,143 11,853,840 8,719,264 7,130,433 6,047,513 5,465,450 4,779,662<br />
Operating profit<br />
Continuing operations 879,937 679,318 497,373 390,310 461,545 309,272 241,615 199,492 160,511 145,772<br />
Discontinued operations – – – – – – – – – –<br />
879,937 679,318 497,373 390,310 461,545 309,272 241,615 199,492 160,511 145,772<br />
Interest income 19,490 13,567 11,636 14,455 26,691 12,627 8,915 5,534 4,920 6,357<br />
Interest expenses (128,594) (98,443) (47,706) (61,561) (64,059) (18,983) (2,741) (1,470) (1,258) (1,152)<br />
Share of profit less losses of<br />
associated companies 1,231 1,850 998 794 634 1,359 1,162 4,205 55 (210)<br />
Profit before taxation 772,064 596,292 462,301 343,998 424,811 304,275 248,951 207,761 164,228 150,767<br />
Taxation (90,660) (47,525) (30,798) (33,269) (32,379) (22,011) (19,391) (16,699) (13,324) (11,906)<br />
Profit for the year 681,404 548,767 431,503 310,729 392,432 282,264 229,560 191,062 150,904 138,861<br />
Attributable to:<br />
Continuing operations 681,229 548,491 431,937 310,505 392,312 282,284 229,523 191,182 152,455 138,832<br />
Discontinued operations – – – – – – – – – –<br />
Shareholders of the Company 681,229 548,491 431,937 310,505 392,312 282,284 229,523 191,182 152,455 138,832<br />
Non-controlling interests 175 276 (434) 225 121 (20) 38 (120) (1,552) 29<br />
681,404 548,767 431,503 310,730 392,433 282,264 229,561 191,062 150,903 138,861<br />
Earnings per share (US cents) (Note)<br />
Basic 8.43 7.17 5.83 4.44 5.74 4.30 3.56 2.98 2.40 2.19<br />
Continuing operations 8.43 7.17 5.83 4.44 5.74 4.30 3.56 2.98 2.40 2.19<br />
Dividend per share (US cents) (Note) 6.79 5.77 4.81 3.65 4.55 3.53 2.91 2.45 2.04 1.78<br />
Special dividend per share<br />
(US cents) (Note) – – – – – – – 1.46 – –<br />
CONSOLIDATED BALANCE SHEET<br />
<strong>2011</strong> 2010 2009 2008 2007 2006 2005 2004 2003 2002<br />
US$’000 US$’000 US$’000 US$’000 US$’000 US$’000 US$’000 US$’000 US$’000 US$’000<br />
Intangible assets 6,525,999 4,882,166 2,333,657 1,872,068 1,458,287 604,252 360,177 167,222 78,570 41,884<br />
Property, plant and equipment 325,432 309,186 160,988 164,495 144,872 142,868 121,488 91,667 93,727 84,403<br />
Other non-current assets 117,418 124,679 112,356 20,246 27,974 113,166 126,028 128,778 117,869 98,420<br />
Current assets 3,951,571 4,177,788 2,757,963 2,752,051 2,444,428 1,966,007 1,349,745 1,057,244 895,034 804,032<br />
Current liabilities 3,664,820 3,317,362 2,227,923 2,288,234 2,095,649 1,658,606 1,264,395 772,589 636,011 533,263<br />
Net current assets 286,751 860,426 530,040 463,817 348,779 307,401 85,350 284,655 259,023 270,769<br />
7,255,600 6,176,457 3,137,041 2,520,626 1,979,912 1,167,687 693,043 672,322 549,189 495,476<br />
Financed by:<br />
Share capital 12,987 12,899 12,103 11,648 11,060 10,928 9,412 9,350 9,301 9,263<br />
Reserves 3,925,619 3,619,179 2,260,485 1,704,039 1,253,589 1,048,924 583,511 594,424 527,939 476,182<br />
Total equity 3,938,606 3,632,078 2,272,588 1,715,687 1,264,649 1,059,852 592,923 603,774 537,240 485,445<br />
Other non-current liabilities 3,316,994 2,544,379 864,453 804,939 715,263 107,835 100,120 68,548 11,949 10,031<br />
7,255,600 6,176,457 3,137,041 2,520,626 1,979,912 1,167,687 693,043 672,322 549,189 495,476<br />
NOTE: Adjusted for the effect of 1-for-10 Bonus Issue in May 2006 and Share Subdivision in May <strong>2011</strong>