Project Green District Energy Feasibility Study - Partners in Project ...
Project Green District Energy Feasibility Study - Partners in Project ...
Project Green District Energy Feasibility Study - Partners in Project ...

You also want an ePaper? Increase the reach of your titles
YUMPU automatically turns print PDFs into web optimized ePapers that Google loves.
Pearson Eco-Bus<strong>in</strong>ess Zone<br />
<strong>District</strong> <strong>Energy</strong> <strong>Feasibility</strong> <strong>Study</strong><br />
for<br />
Toronto and Region Conservation Authority<br />
10 April 2012<br />
Prepared By<br />
FVB <strong>Energy</strong> Inc.
TRCA Pearson Eco-Bus<strong>in</strong>ess Zone <strong>District</strong> <strong>Energy</strong> <strong>Feasibility</strong> <strong>Study</strong> 10 April 2012<br />
© 2012, Toronto and Region Conservation Authority. All Rights Reserved.<br />
This feasibility study was carried out with assistance from the <strong>Green</strong> Municipal Fund, a Fund<br />
f<strong>in</strong>anced by the Government of Canada and adm<strong>in</strong>istered by the Federation of Canadian<br />
Municipalities. Notwithstand<strong>in</strong>g this support, the views expressed are the personal views of<br />
the authors, and the Federation of Canadian Municipalities and the Government of Canada<br />
accept no responsibility for them.
TRCA Pearson Eco-Bus<strong>in</strong>ess Zone <strong>District</strong> <strong>Energy</strong> <strong>Feasibility</strong> <strong>Study</strong> 10 April 2012<br />
Executive Summary<br />
Overview of <strong>District</strong> <strong>Energy</strong><br />
<strong>District</strong> energy is the distribution of thermal energy us<strong>in</strong>g a pipel<strong>in</strong>e distribution system that can<br />
deliver heat<strong>in</strong>g or cool<strong>in</strong>g to build<strong>in</strong>gs connected to the system. The central thermal plants may<br />
use various types of fuel <strong>in</strong>clud<strong>in</strong>g natural gas, oil or renewable energy, with heat be<strong>in</strong>g<br />
generated either as a purchased fuel or as waste heat.<br />
The economic viability of district energy system relates closely to the energy density of the<br />
thermal customers be<strong>in</strong>g served, as the system <strong>in</strong> effect replaces the functions provided by<br />
furnaces, air conditioners, boilers and chillers <strong>in</strong> the <strong>in</strong>dividual build<strong>in</strong>gs.<br />
Background and Scope of <strong>Study</strong><br />
One of the priorities identified <strong>in</strong> the <strong>Partners</strong> <strong>in</strong> <strong>Project</strong> <strong>Green</strong> Strategy was the development of<br />
a <strong>District</strong> <strong>Energy</strong> System (DES) <strong>in</strong> the Pearson Eco-Bus<strong>in</strong>ess Zone - the commercial and<br />
<strong>in</strong>dustrial area surround<strong>in</strong>g the Toronto Pearson International Airport. The strategy<br />
recommended engag<strong>in</strong>g one or all three of the energy generat<strong>in</strong>g facilities around Toronto<br />
Pearson to determ<strong>in</strong>e the feasibility of them provid<strong>in</strong>g heat<strong>in</strong>g and/or cool<strong>in</strong>g to a district energy<br />
system that could feed local build<strong>in</strong>gs. The three facilities are Greater Toronto Airports<br />
Authority’s (GTAA) Central Utilities Plant (CUP) 1<br />
(117 MW), TransAlta Mississauga<br />
Cogeneration Plant (108 MW), and the Magellan Aerospace Cogeneration Facility (2.5 MW).<br />
Given that the owners or operators of each of these facilities <strong>in</strong>dicated that their plant cannot be<br />
relied on to serve as an energy source for the envisioned DES, this feasibility study analyzes a<br />
DES bus<strong>in</strong>ess model that is based on construction of a new <strong>Energy</strong> Centre on a vacant parcel<br />
of land on Elmbank Road. It also exam<strong>in</strong>es the economic and regulatory conditions that would<br />
be necessary to make thermal energy supply from the GTAA’s CUP facility feasible.<br />
Specifically, this feasibility study focuses on answer<strong>in</strong>g the follow<strong>in</strong>g two questions:<br />
1. What is the feasibility of develop<strong>in</strong>g a district energy system fed by a new central thermal<br />
plant to provide heat<strong>in</strong>g to build<strong>in</strong>gs with<strong>in</strong> the vic<strong>in</strong>ity of Toronto Pearson?<br />
2. What are the economic and regulatory conditions that could make runn<strong>in</strong>g GTAA’s<br />
Central Heat<strong>in</strong>g Plant (CHP) economical as a source to provide heat for a district energy<br />
system <strong>in</strong> the Pearson Eco-Bus<strong>in</strong>ess Zone?<br />
Results<br />
The results of this feasibility study found that there is potential to develop a district energy<br />
system <strong>in</strong> the vic<strong>in</strong>ity of Toronto Pearson, beg<strong>in</strong>n<strong>in</strong>g with 11 potential facilities near Highway<br />
427 and Airport Road. There is significant thermal energy consumption and moderate density<br />
from the local hotels that would make up the majority of the customers. However, the major<br />
challenge <strong>in</strong> the area is that it is a retrofit environment which makes attract<strong>in</strong>g customers to the<br />
system much more challeng<strong>in</strong>g.<br />
1 Consists of boilers and a Central Heat<strong>in</strong>g Plant<br />
ES-i
TRCA Pearson Eco-Bus<strong>in</strong>ess Zone <strong>District</strong> <strong>Energy</strong> <strong>Feasibility</strong> <strong>Study</strong> 10 April 2012<br />
Demand Identification<br />
In order to identify the potential customer thermal energy demand, aggregate natural gas<br />
consumption was compared aga<strong>in</strong>st aerial maps to identify potential areas of <strong>in</strong>terest. These<br />
areas were then surveyed from the exterior to identify 36 facilities, shown <strong>in</strong> Figure ES-1, with<br />
strong potential as district energy customers. Of these facilities, 15 participated <strong>in</strong> a detailed<br />
review consist<strong>in</strong>g of an <strong>in</strong>terview with key staff, <strong>in</strong>spection of the mechanical equipment, and<br />
study of natural gas consumption data. The thermal loads for the rema<strong>in</strong><strong>in</strong>g facilities were<br />
estimated with benchmark data from the consultants’ database of similar build<strong>in</strong>gs. The thermal<br />
heat<strong>in</strong>g load for the 36 facilities is estimated at 44,000 kW.<br />
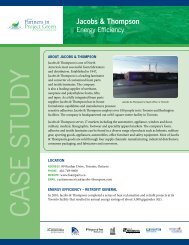
Figure ES-1. Proposed <strong>District</strong> <strong>Energy</strong> System Customers and Route<br />
The estimated cool<strong>in</strong>g load for the facilities is considerably lower, as is typical <strong>in</strong> Ontario. <strong>District</strong><br />
cool<strong>in</strong>g requires higher capital costs and is not cost effective <strong>in</strong> the study area.<br />
As a result of this analysis, two clusters of build<strong>in</strong>gs were identified to be most suitable for a<br />
district energy system, and are recommended for the <strong>in</strong>itial phase of a potential system. The<br />
first cluster has an estimated thermal load of 4,825 kW and consists of build<strong>in</strong>gs number 1 to 5<br />
<strong>in</strong> the area bounded by Highway 427, Airport Road and Elmbank Road. The second cluster has<br />
an estimated thermal load of 8,800 kW and <strong>in</strong>cludes build<strong>in</strong>gs number 6 to 11 on Dixon Road to<br />
the east of Highway 427.<br />
Thermal <strong>Energy</strong> Supply<br />
Given the constra<strong>in</strong>ts of the exist<strong>in</strong>g energy generation facilities <strong>in</strong> the area, there would be a<br />
need to create a dedicated central thermal plant. For this study, it was assumed that this facility<br />
would be located on a vacant parcel of land on Elmbank Road. The facility would consist of four<br />
ES-ii
TRCA Pearson Eco-Bus<strong>in</strong>ess Zone <strong>District</strong> <strong>Energy</strong> <strong>Feasibility</strong> <strong>Study</strong> 10 April 2012<br />
boilers each hav<strong>in</strong>g a capacity to supply 4MW of heat and a CHP plant with an output of 4MW<br />
of heat and 4MW of electrical power.<br />
Distribution System<br />
Supply and return pipes are buried at least one meter below grade. Figure 1 shows<br />
recommended pip<strong>in</strong>g routes for the build<strong>in</strong>gs under consideration with 3.1 km of pip<strong>in</strong>g required<br />
to connect build<strong>in</strong>gs 1 to11.<br />
F<strong>in</strong>ancial Model<br />
Capital Cost Estimates<br />
The total capital cost of a district energy system connect<strong>in</strong>g build<strong>in</strong>gs 1 to 11, <strong>in</strong>clud<strong>in</strong>g<br />
construction of a dedicated energy centre consist<strong>in</strong>g of four boilers and one CHP plant,<br />
distribution pipe systems, energy transfer stations and build<strong>in</strong>g modifications required for<br />
connection is estimated at $28,200,000.<br />
Operat<strong>in</strong>g Cost Estimates<br />
Operat<strong>in</strong>g costs <strong>in</strong>clude forecast commodity fuel and delivery costs, labour, ma<strong>in</strong>tenance,<br />
<strong>in</strong>surance, land lease, and overhead costs.<br />
Customer Pric<strong>in</strong>g and Revenue Estimates<br />
The maximum price that a potential customer of a district energy system would be likely to pay<br />
is the avoided cost of generat<strong>in</strong>g their own thermal energy onsite. This avoided cost <strong>in</strong>cludes<br />
the price paid to the utilities as well as avoided operational and capital costs from own<strong>in</strong>g and<br />
runn<strong>in</strong>g a boiler. The suggested pric<strong>in</strong>g, used <strong>in</strong> the model, sets a fixed monthly capacity charge<br />
and passes through the cost of energy.<br />
Electricity Revenue Estimates<br />
Electricity supplied by the CHP to Ontario’s grid is assumed to receive revenue under a contract<br />
with the Ontario Power Authority based on the current CHP Standard Offer Program.<br />
F<strong>in</strong>ancial Model Results<br />
The f<strong>in</strong>ancial model developed for the district energy system connect<strong>in</strong>g build<strong>in</strong>gs 1 to 11<br />
provides an estimated unlevered <strong>in</strong>ternal rate of return (IRR) of 5 per cent. Under the base case<br />
f<strong>in</strong>anc<strong>in</strong>g assumptions (D/E ratio of 6 per cent, repayment term of 20 years and an <strong>in</strong>terest rate<br />
of 6 per cent), the levered IRR is improved to 8 per cent, a rate that is at the low end of the<br />
range for DES projects that typically generate 8 to 12 per cent.<br />
Government fund<strong>in</strong>g assistance through programs such as the <strong>Green</strong> Infrastructure Fund and<br />
<strong>Green</strong> Municipal Fund may be available to support a DES. If 30 per cent of project costs were<br />
funded, a level received by other Canadian DES’s, the unlevered project IRR would <strong>in</strong>crease to<br />
9 per cent.<br />
Ownership and Operational Structure<br />
Because of the high capital costs and long <strong>in</strong>vestment horizon, utilities (Enbridge), municipalities<br />
(Peel, Mississauga or Toronto), or other public sector bodies with access to low-cost capital are<br />
potential developers and/or owners of a district energy system.<br />
The system could have a number of potential ownership models, <strong>in</strong>clud<strong>in</strong>g:<br />
ES-iii
TRCA Pearson Eco-Bus<strong>in</strong>ess Zone <strong>District</strong> <strong>Energy</strong> <strong>Feasibility</strong> <strong>Study</strong> 10 April 2012<br />
• Public-Private Ownership – the municipality (Peel and/or Mississauga) and another public<br />
sector body could partner with a private-sector partner (i.e. Enbridge) to develop the project<br />
<strong>in</strong> partnership.<br />
• Private Ownership – an <strong>in</strong>terested private sector company could develop the project and<br />
provide the municipality annual easement fees for use of its right-of-ways.<br />
• Public Ownership – the municipality and another public sector body could develop and<br />
implement the project and operate it as a utility similar to water and wastewater services.<br />
Regardless of the ownership model, the <strong>Partners</strong> <strong>in</strong> <strong>Project</strong> <strong>Green</strong> <strong>District</strong> <strong>Energy</strong> Team agreed<br />
that a champion from the local municipalities is critical to the success of the system – as the<br />
public trust and <strong>in</strong>fluence of the local municipality is important <strong>in</strong> ensur<strong>in</strong>g buy-<strong>in</strong> of potential<br />
customers; while access to easements, proper permitt<strong>in</strong>g and favourable development<br />
conditions, are crucial to the facility’s development.<br />
Regulatory Considerations<br />
The district energy system is not expected to face significant regulatory or legal obstacles. If<br />
federal fund<strong>in</strong>g is accessed it may trigger an Environmental Assessment screen<strong>in</strong>g. It would not<br />
be expected to trigger a prov<strong>in</strong>cial Environmental Assessment.<br />
Municipal easements and permits would be required for the development of a system.<br />
Risk Assessment<br />
There are a number of risks that the development of the district energy system could face,<br />
<strong>in</strong>clud<strong>in</strong>g:<br />
• Customer Connections - the primary risk with the development of this district energy<br />
system is that customers will not connect. A concerted market<strong>in</strong>g campaign to educate<br />
potential customers and obta<strong>in</strong> their <strong>in</strong>tent to connect will be required before development.<br />
In addition, new development <strong>in</strong> the vic<strong>in</strong>ity of the proposed system should be educated and<br />
encouraged to connect as part of the development process.<br />
• Natural Gas Price Volatility - rates can be structured with a fixed rate and variable rate<br />
component so that customers take-on or share-<strong>in</strong> the volatility of the energy prices. In the<br />
extreme, district energy systems are resilient to changes <strong>in</strong> fuel type and can typically be<br />
modified for a new fuel source more cheaply than <strong>in</strong>dividual build<strong>in</strong>gs.<br />
• Land Availability - suitable and affordable plots of land appear to be available to host the<br />
central thermal facility, however the owners would need to be identified and availability and<br />
price confirmed.<br />
• <strong>Project</strong> F<strong>in</strong>anc<strong>in</strong>g - availability and cost of capital will be key constra<strong>in</strong>ts for the successful<br />
development of the system.<br />
Economic Conditions for GTAA’s Central Utilities Plant to Supply Thermal <strong>Energy</strong><br />
Currently the GTAA has a CUP that consists of boilers and a CHP plant. While the boilers are<br />
limited by their physical capacity and GTAA’s demand for heat<strong>in</strong>g and cool<strong>in</strong>g, the CHP is<br />
currently limited by market prices for electricity.<br />
The CHP plant is dispatched when it is profitable based on market rates for electricity and the<br />
cost of natural gas. In order to utilize GTAA’s CHP as the thermal source for the proposed<br />
district energy system, GTAA would need improved contract terms so that it is profitable to run<br />
ES-iv
TRCA Pearson Eco-Bus<strong>in</strong>ess Zone <strong>District</strong> <strong>Energy</strong> <strong>Feasibility</strong> <strong>Study</strong> 10 April 2012<br />
more often. If this was the case, it is possible that the proposed 4MW dedicated CHP plant<br />
assumed by this study could be avoided.<br />
Contract features that would support the delivery of heat to the Pearson Eco-Bus<strong>in</strong>ess Zone<br />
<strong>District</strong> <strong>Energy</strong> System <strong>in</strong>clude non-dispatchable operation and m<strong>in</strong>imum standby price for<br />
electricity. If this was available, GTAA could potentially be available to provide the thermal<br />
energy when needed by the proposed district energy system.<br />
ES-v
TRCA Pearson Eco-Bus<strong>in</strong>ess Zone <strong>District</strong> <strong>Energy</strong> <strong>Feasibility</strong> <strong>Study</strong> 10 April 2012<br />
TABLE OF CONTENTS<br />
Executive Summary......................................................................................................ES-i – ES-v<br />
1 INTRODUCTION ................................................................................................................ 6<br />
1.1 TORONTO AND REGION CONSERVATION AUTHORITY ........................................................ 6<br />
1.2 PARTNERS IN PROJECT GREEN: A PEARSON ECO-BUSINESS ZONE .................................. 6<br />
1.3 INTRODUCTION TO DISTRICT ENERGY SYSTEMS .............................................................. 6<br />
1.4 PURPOSE OF THE FEASIBILITY STUDY ............................................................................. 7<br />
1.5 SCOPE OF THE STUDY ................................................................................................... 7<br />
1.6 REPORT ORGANIZATION ................................................................................................. 8<br />
2 CUSTOMER DEMAND ....................................................................................................... 8<br />
2.1 MARKET POTENTIAL FOR DES AND THERMAL LOAD ESTIMATIONS .................................... 8<br />
2.2 LOAD DIVERSIFICATION FACTOR ....................................................................................15<br />
3 ENERGY SOURCES .........................................................................................................16<br />
3.1 DESCRIPTION OF THE APPROPRIATE TYPE OF DES ........................................................16<br />
3.2 ENERGY SOURCE .........................................................................................................16<br />
4 DISTRIBUTION .................................................................................................................18<br />
4.1 INTRODUCTION .............................................................................................................18<br />
4.2 DISTRIBUTION NETWORK PIPE ROUTING AND SIZING ......................................................18<br />
4.3 ENERGY TRANSFER STATIONS ......................................................................................20<br />
5 FINANCIAL, ENVIRONMENTAL AND SOCIAL ANALYSIS .............................................24<br />
5.1 BUSINESS-AS-USUAL ANALYSIS .....................................................................................24<br />
5.2 CONCEPTUAL DES COST ESTIMATES ............................................................................25<br />
5.3 FINANCIAL PROJECTIONS ..............................................................................................30<br />
5.4 SOCIAL ANALYSIS .........................................................................................................30<br />
5.5 ENVIRONMENTAL ANALYSIS ...........................................................................................31<br />
6 OWNERSHIP AND OPERATIONAL STRUCTURE ...........................................................31<br />
6.1 POSSIBLE OWNERSHIP MODELS FOR DES DEVELOPMENT IN PEARSON AREA ..................31<br />
6.2 PRECEDENTS AND LESSONS FROM RECENT CANADIAN EXPERIENCE ...............................32<br />
6.3 POTENTIAL ROLE OF MUNICIPALITIES .............................................................................32<br />
6.4 POTENTIAL ROLE OF GTAA ...........................................................................................34<br />
6.5 POTENTIAL ROLE OF ENBRIDGE .....................................................................................34<br />
6.6 DE UTILITY REGULATION ..............................................................................................34<br />
7 RISK, REGULATORY & FINANCING ISSUES .................................................................35<br />
7.1 RISK MANAGEMENT PLAN .............................................................................................35<br />
7.2 RISK SUMMARY ............................................................................................................60<br />
7.3 REGULATORY ISSUES ...................................................................................................61<br />
7.4 FINANCING ISSUES........................................................................................................63<br />
8 BUSINESS MODEL REPORT ...........................................................................................69<br />
8.1 THERMAL REVENUE ASSUMPTIONS ................................................................................70<br />
8.2 ELECTRICITY REVENUE .................................................................................................72<br />
1
TRCA Pearson Eco-Bus<strong>in</strong>ess Zone <strong>District</strong> <strong>Energy</strong> <strong>Feasibility</strong> <strong>Study</strong> 10 April 2012<br />
8.3 VARIABLE COST ASSUMPTIONS .....................................................................................73<br />
8.4 FINANCIAL RESULTS .....................................................................................................75<br />
8.5 SENSITIVITY .................................................................................................................79<br />
9 IMPLEMENTATION PLAN ................................................................................................80<br />
9.1 DES OWNERSHIP MODEL .............................................................................................80<br />
9.2 INITIAL BUSINESS PLAN .................................................................................................80<br />
9.3 MARKETING ..................................................................................................................80<br />
9.4 PROJECT REVIEW .........................................................................................................81<br />
9.5 REVISED BUSINESS PLAN ..............................................................................................81<br />
9.6 DESIGN BASIS DOCUMENT ............................................................................................81<br />
9.7 OBTAIN CUSTOMER COMMITMENT .................................................................................81<br />
9.8 FINALIZE PROJECT DEFINITION ......................................................................................81<br />
9.9 SECURE FINANCING ......................................................................................................82<br />
10 ECONOMIC CONDITIONS FOR GTAA’S CENTRAL UTILITIES PLANT TO SUPPLY<br />
THERMAL ENERGY ................................................................................................................83<br />
11 APPENDIX A: INTRODUCTION TO DISTRICT ENERGY .............................................84<br />
11.1 GENERAL OVERVIEW ....................................................................................................84<br />
11.2 SERVICES ....................................................................................................................84<br />
11.3 UNIQUE SALES PROPOSITION ........................................................................................84<br />
11.4 ENERGY SOURCES .......................................................................................................85<br />
11.5 DISTRIBUTION MEDIUM .................................................................................................86<br />
11.6 BUILDING INTERFACE ....................................................................................................86<br />
11.7 METERING ....................................................................................................................88<br />
11.8 DEFINITIONS AND ABBREVIATIONS .................................................................................90<br />
12 APPENDIX B: BUILDING SURVEYS ............................................................................93<br />
13 APPENDIX C: COMPARISON OF POTENTIAL ENERGY SOURCES ........................ 114<br />
13.1 ELECTRICITY .............................................................................................................. 114<br />
13.2 NATURAL GAS ............................................................................................................ 114<br />
13.3 BIOMASS .................................................................................................................... 115<br />
13.4 THERMAL ENERGY STORAGE ...................................................................................... 117<br />
13.5 RAW SEWAGE HEAT SOURCE ...................................................................................... 117<br />
13.6 BIOGAS ...................................................................................................................... 118<br />
13.7 GEOTHERMAL ............................................................................................................. 119<br />
13.8 SOLAR THERMAL ........................................................................................................ 121<br />
14 APPENDIX D: GTAA COGENERATION PLANT OPERATIONS ................................ 122<br />
15 APPENDIX E: PROPOSED ENERGY CENTRE LAYOUT........................................... 123<br />
16 APPENDIX F: DISTRIBUTION SYSTEM ROUTE ........................................................ 125<br />
17 APPENDIX G: ENERGY TRANSFER STATION SCHEMATIC ................................... 127<br />
18 APPENDIX H: FINANCIAL PROJECTIONS ................................................................ 129<br />
19 APPENDIX I: TECHNICAL MEMO .............................................................................. 142<br />
20 APPENDIX J: CANADIAN EXPERIENCE OF DES DEVELOPMENT ......................... 150<br />
20.1 LARGER NEW DE UTILITY SYSTEMS ............................................................................ 150<br />
2
TRCA Pearson Eco-Bus<strong>in</strong>ess Zone <strong>District</strong> <strong>Energy</strong> <strong>Feasibility</strong> <strong>Study</strong> 10 April 2012<br />
20.2 SMALLER NEW DE UTILITY SYSTEMS ........................................................................... 154<br />
20.3 SUMMARY OF OWNERSHIP OF DES DEVELOPED IN CANADA RECENTLY ......................... 159<br />
21 APPENDIX K: ONTARIO MINISTRY OF ENVIRONMENT REGULATIONS................ 161<br />
21.1 REGULATION 116/01 – ENVIRONMENTAL ASSESSMENT REQUIREMENTS FOR ELECTRICITY<br />
PROJECTS ............................................................................................................................ 161<br />
21.2 REGULATION 419/05 – AIR POLLUTION – LOCAL AIR QUALITY ....................................... 161<br />
21.3 NOISE ........................................................................................................................ 162<br />
21.4 USE OF BIOMASS OR WASTE WOOD ............................................................................. 162<br />
21.5 GUIDELINE A-9 – NOX EMISSIONS FROM BOILERS AND HEATERS .................................. 163<br />
21.6 GUIDELINE A-10 - PROCEDURE FOR PREPARING AN EMISSION SUMMARY AND DISPERSION<br />
MODELLING (ESDM) REPORT, DATE JULY 2005 ..................................................................... 163<br />
21.7 GUIDELINE A-12 – GUIDELINE FOR THE IMPLEMENTATION OF AIR STANDARDS IN ONTARIO<br />
(GIASO) .............................................................................................................................. 163<br />
21.8 SUMMARY .................................................................................................................. 163<br />
3
TRCA Pearson Eco-Bus<strong>in</strong>ess Zone <strong>District</strong> <strong>Energy</strong> <strong>Feasibility</strong> <strong>Study</strong> 10 April 2012<br />
LIST OF TABLES<br />
Table 1 List of Initial DE Prospects Selected .............................................................................11<br />
Table 2 Summary of Exist<strong>in</strong>g Heat<strong>in</strong>g System Types for Visited Prospects <strong>in</strong> Phase 1 .............14<br />
Table 3 Estimated Heat<strong>in</strong>g and Cool<strong>in</strong>g Loads by Phase ..........................................................15<br />
Table 4 List of Major Equipment ................................................................................................17<br />
Table 5 DPS Design Criteria .....................................................................................................19<br />
Table 6 ETS Design Criteria ......................................................................................................23<br />
Table 7 BaU Cost Summary ......................................................................................................25<br />
Table 8 Capital Cost Estimate Summary ...................................................................................26<br />
Table 9 CCE for ETS Phase 1A ................................................................................................26<br />
Table 10 CCE for ETS Balance of Phase 1 ...............................................................................27<br />
Table 11 CC for DPS Phase 1A ................................................................................................28<br />
Table 12 CCE for DPS Balance of Phase 1 ..............................................................................29<br />
Table 13 CCE for <strong>Energy</strong> Centre, <strong>in</strong>clud<strong>in</strong>g CHP .....................................................................30<br />
Table 15 Summary of Construction Risks .................................................................................55<br />
Table 16 Summary of Operations Technical Risks ....................................................................56<br />
Table 17 Summary of Operations Bus<strong>in</strong>ess Risks ....................................................................60<br />
Table 18 Matrix Compar<strong>in</strong>g Risk Severity ................................................................................60<br />
Table 19 IRR by Phase & Contract Capacity .............................................................................70<br />
Table 20 Thermal Capacity Build-up .........................................................................................70<br />
Table 21 <strong>Project</strong> Phas<strong>in</strong>g .........................................................................................................71<br />
Table 22 DES Rate Derivation .................................................................................................72<br />
Table 23 Heat<strong>in</strong>g Variable Cost Assumptions ..........................................................................74<br />
Table 24 Heat<strong>in</strong>g Fixed Cost Assumptions ...............................................................................75<br />
Table 25 Pro Forma Income Statement....................................................................................76<br />
Table 26 Pro Forma Balance Sheet .........................................................................................77<br />
Table 27 Pro Forma Cash Flow ...............................................................................................78<br />
Table 28 Results of Sensitivity Analysis on Unlevered IRR ......................................................79<br />
Table 29 Sensitivity of unlevered IRR to Fund<strong>in</strong>g and Capital with External Supply ..................80<br />
Table 30 Ownership of Larger DES ........................................................................................ 150<br />
Table 31 Ownership of Smaller DES ....................................................................................... 155<br />
Table 31 Summary of DES Ownership .................................................................................... 159<br />
4
TRCA Pearson Eco-Bus<strong>in</strong>ess Zone <strong>District</strong> <strong>Energy</strong> <strong>Feasibility</strong> <strong>Study</strong> 10 April 2012<br />
LIST OF FIGURES<br />
Figure 1 Estimated Natural Gas Consumption by Address ......................................................... 9<br />
Figure 2 Locations of Selected DE Prospects ..........................................................................12<br />
Figure 3 Comparison of BaU to DES Rates ..............................................................................46<br />
Figure 4 Illustrative F<strong>in</strong>anc<strong>in</strong>g Mix .............................................................................................66<br />
Figure 5 Risk of DES vs Stage of <strong>Project</strong> ..................................................................................66<br />
Figure 6 F<strong>in</strong>ancial <strong>Project</strong>ion .....................................................................................................79<br />
5
TRCA Pearson Eco-Bus<strong>in</strong>ess Zone <strong>District</strong> <strong>Energy</strong> <strong>Feasibility</strong> <strong>Study</strong> 10 April 2012<br />
1 Introduction<br />
This feasibility study exam<strong>in</strong>es the potential opportunities to use <strong>District</strong> <strong>Energy</strong> (DE) technology<br />
to serve exist<strong>in</strong>g thermal sources <strong>in</strong> the Pearson Eco-Bus<strong>in</strong>ess Zone area and distribute that<br />
energy to loads that appear to be f<strong>in</strong>ancially viable. The study was commissioned by <strong>Partners</strong> <strong>in</strong><br />
<strong>Project</strong> <strong>Green</strong>, a program of the Toronto and Region Conservation Authority, and was<br />
conducted by FVB <strong>Energy</strong> Inc.<br />
1.1 Toronto and Region Conservation Authority<br />
Toronto and Region Conservation Authority (TRCA) is one of 38 conservation authorities <strong>in</strong><br />
Ontario. Formed <strong>in</strong> the aftermath of Hurricane Hazel, TRCA has a strong history <strong>in</strong> watershed<br />
management and leadership <strong>in</strong> apply<strong>in</strong>g susta<strong>in</strong>ability practices. Today, TRCA owns more than<br />
40,000 acres of land <strong>in</strong> the Toronto region, employs more than 400 full time employees and<br />
coord<strong>in</strong>ates more than 3,000 volunteers each year. TRCA works to protect and restore the<br />
health of the n<strong>in</strong>e watersheds that form the Toronto region, and the Lake Ontario waterfront<br />
along its southern boundary. With decades of practical experience <strong>in</strong> protect<strong>in</strong>g our<br />
environment, educat<strong>in</strong>g young people, and engag<strong>in</strong>g communities, TRCA works with<br />
governments, bus<strong>in</strong>esses, and <strong>in</strong>dividuals to build a greener, cleaner healthier place to live.<br />
1.2 <strong>Partners</strong> <strong>in</strong> <strong>Project</strong> <strong>Green</strong>: A Pearson Eco-Bus<strong>in</strong>ess Zone<br />
<strong>Partners</strong> <strong>in</strong> <strong>Project</strong> <strong>Green</strong> was officially launched <strong>in</strong> October 2008 by the Greater Toronto Airport<br />
Authority (GTAA), the Region of Peel, the City of Toronto and Toronto and Region Conservation<br />
Authority (TRCA). <strong>Partners</strong> <strong>in</strong> <strong>Project</strong> <strong>Green</strong> seeks to transform 12,000 ha of bus<strong>in</strong>ess activity<br />
<strong>in</strong>to the Pearson Eco-Bus<strong>in</strong>ess Zone, which is envisioned to be an <strong>in</strong>ternationally recognized<br />
community known for its competitive, high performance and eco-friendly bus<strong>in</strong>ess climate (see<br />
www.partners<strong>in</strong>projectgreen.com).<br />
The <strong>Partners</strong> <strong>in</strong> <strong>Project</strong> <strong>Green</strong> Strategy document 2<br />
identified eco-opportunities that could<br />
enhance the environmental and economic performance of bus<strong>in</strong>esses based on the local<br />
context. Given the presence and/or construction plans of exist<strong>in</strong>g or new energy generation<br />
facilities, plus a potentially high demand for space heat<strong>in</strong>g and cool<strong>in</strong>g, as well as for heated<br />
process water, the establishment of a district energy system (DES) around Toronto Pearson<br />
was identified as an opportunity.<br />
The <strong>Partners</strong> <strong>in</strong> <strong>Project</strong> <strong>Green</strong> Steer<strong>in</strong>g Committee created a number of <strong>Project</strong> Teams to guide<br />
the implementation of the eco-opportunities identified <strong>in</strong> the strategy document. The <strong>District</strong><br />
<strong>Energy</strong> Team aims to develop a district heat<strong>in</strong>g and cool<strong>in</strong>g network around Toronto Pearson,<br />
mak<strong>in</strong>g use of the large amount of waste heat available from local cogeneration plants.<br />
1.3 Introduction to <strong>District</strong> <strong>Energy</strong> Systems<br />
A DES is a system that delivers heat<strong>in</strong>g and/or cool<strong>in</strong>g to multiple build<strong>in</strong>gs from a central<br />
source or sources, usually compris<strong>in</strong>g of three physically connected sub-systems that form a<br />
closed loop:<br />
2 http://www.partners<strong>in</strong>projectgreen.com/files/Strategy(2008)_PPG.pdf<br />
6
TRCA Pearson Eco-Bus<strong>in</strong>ess Zone <strong>District</strong> <strong>Energy</strong> <strong>Feasibility</strong> <strong>Study</strong> 10 April 2012<br />
1) <strong>Energy</strong> Transfer Station(s) (ETS) – transfer thermal energy to customers.<br />
2) <strong>Energy</strong> Centre(s) (EC), - generate/recover thermal energy and<br />
3) Distribution Pip<strong>in</strong>g System (DPS) – transport thermal energy from EC to ETS<br />
A DES generally does not <strong>in</strong>clude the secondary systems for distribut<strong>in</strong>g heat<strong>in</strong>g or cool<strong>in</strong>g<br />
with<strong>in</strong> build<strong>in</strong>gs. There is usually a demarcation po<strong>in</strong>t designated <strong>in</strong>side each build<strong>in</strong>g<br />
mechanical room def<strong>in</strong><strong>in</strong>g the DES pipes and equipment owned by the DES utility as dist<strong>in</strong>ct<br />
from the secondary systems that are used by the build<strong>in</strong>g owners to distribute heat <strong>in</strong>ternally<br />
throughout their build<strong>in</strong>g.<br />
A fuller description of the concept of DES and its benefits together with def<strong>in</strong>itions and<br />
abbreviations commonly used <strong>in</strong> the district energy <strong>in</strong>dustry is given <strong>in</strong> Appendix A.<br />
1.4 Purpose of the <strong>Feasibility</strong> <strong>Study</strong><br />
This feasibility study was conducted to exam<strong>in</strong>e potential opportunities to use <strong>District</strong> <strong>Energy</strong><br />
(DE) technology to serve exist<strong>in</strong>g thermal sources <strong>in</strong> the Pearson Eco-Bus<strong>in</strong>ess Zone area and<br />
distribute that energy to loads that appear to be f<strong>in</strong>ancially viable. The study primarily focuses<br />
on the generation and distribution of hot water. Generation and distribution of chilled water was<br />
<strong>in</strong>vestigated and it was determ<strong>in</strong>ed that the capital required to provide cool<strong>in</strong>g is too high to<br />
make it f<strong>in</strong>ancially viable.<br />
This study is directed towards groups (e.g., municipalities, Ontario Power Authority, Enbridge)<br />
<strong>in</strong>terested <strong>in</strong> develop<strong>in</strong>g, or assist<strong>in</strong>g <strong>in</strong> the development of, district energy opportunities. This<br />
study seeks to provide sufficient detail that <strong>in</strong>terested parties can decide on an operat<strong>in</strong>g<br />
structure and issue an expression of <strong>in</strong>terest to seek development partners.<br />
1.5 Scope of the <strong>Study</strong><br />
One of the priorities identified <strong>in</strong> the <strong>Partners</strong> <strong>in</strong> <strong>Project</strong> <strong>Green</strong> Strategy was the development of<br />
a DES around Toronto Pearson. The strategy recommended engag<strong>in</strong>g one or all three of the<br />
energy generat<strong>in</strong>g facilities around Toronto Pearson to determ<strong>in</strong>e the feasibility of them<br />
provid<strong>in</strong>g heat<strong>in</strong>g and/or cool<strong>in</strong>g to a district energy system that could feed local build<strong>in</strong>gs. The<br />
three facilities are Greater Toronto Airports Authority’s (GTAA) Central Utilities Plant (117 MW),<br />
TransAlta Mississauga Cogeneration Plant (108 MW), and the Magellan Aerospace<br />
Cogeneration Facility (2.5 MW).<br />
Given that the owners or operators of each of these facilities <strong>in</strong>dicated that their plant cannot be<br />
relied on to serve as an energy source for the envisioned DES, this feasibility study analyzes a<br />
DES bus<strong>in</strong>ess model that is based on construction of a new <strong>Energy</strong> Centre on a vacant parcel<br />
of land on Elmbank Road. It also exam<strong>in</strong>es the economic and regulatory conditions that would<br />
be necessary to make the GTAA’s facility feasible.<br />
Specifically, this feasibility study focuses on answer<strong>in</strong>g the follow<strong>in</strong>g two questions:<br />
1. What is the feasibility of develop<strong>in</strong>g a district energy system fed by a new central thermal<br />
plant to provide heat<strong>in</strong>g to build<strong>in</strong>gs with<strong>in</strong> the vic<strong>in</strong>ity of Toronto Pearson?<br />
2. What are the economic and regulatory conditions that could make runn<strong>in</strong>g GTAA’s<br />
Central Heat<strong>in</strong>g Plant economical as a source to provide heat for a district energy system<br />
<strong>in</strong> the vic<strong>in</strong>ity of Toronto Pearson?<br />
7
TRCA Pearson Eco-Bus<strong>in</strong>ess Zone <strong>District</strong> <strong>Energy</strong> <strong>Feasibility</strong> <strong>Study</strong> 10 April 2012<br />
1.6 Report Organization<br />
This report is organized <strong>in</strong>to 9 sections as follows:<br />
1. Introduction<br />
2. Customer Demand<br />
3. <strong>Energy</strong> Sources<br />
4. Distribution<br />
5. Bus<strong>in</strong>ess-As-Usual Analysis, F<strong>in</strong>ancial Analysis and Environmental Analysis<br />
6. Ownership and Operational Structure<br />
7. Risk, Regulatory and F<strong>in</strong>anc<strong>in</strong>g Issues<br />
8. Bus<strong>in</strong>ess Model Report<br />
9. Implementation Plan<br />
A series of appendices concludes this feasibility study.<br />
2 Customer Demand<br />
2.1 Market Potential for DES and Thermal Load Estimations<br />
The DES must be designed to provide enough capacity to meet each build<strong>in</strong>g's thermal needs<br />
dur<strong>in</strong>g peak days. If the system is under-designed the customer base would be unsatisfied as<br />
peak load requirements wouldn’t be met. If the system is over-designed then the capital costs<br />
required would be too high and could affect the economics of the entire project. Therefore,<br />
accurate estimat<strong>in</strong>g of thermal demand is the first task <strong>in</strong> any district energy feasibility study.<br />
2.1.1 Previous work by <strong>Partners</strong> <strong>in</strong> <strong>Project</strong> <strong>Green</strong><br />
Previous work by <strong>Partners</strong> <strong>in</strong> <strong>Project</strong> <strong>Green</strong> 3<br />
had identified 12,500 bus<strong>in</strong>esses <strong>in</strong> the Pearson<br />
Eco-Bus<strong>in</strong>ess Zone. <strong>Energy</strong> consumption was estimated from build<strong>in</strong>g footpr<strong>in</strong>t and energy<br />
<strong>in</strong>tensity factors for bus<strong>in</strong>ess types published by Natural Resources Canada (NRCan), for each<br />
address where data were available. It was recognized that this method would underestimate<br />
the consumption for multi-storey build<strong>in</strong>gs, not <strong>in</strong>clude <strong>in</strong>dustrial process energy and not capture<br />
all of the build<strong>in</strong>gs (although it did capture 10,374 of them).<br />
The total natural gas consumption estimated by this method was compared to 2005 actual<br />
consumption data from Enbridge by postal code for approximately the same area. As expected,<br />
the Enbridge data was higher <strong>in</strong> total, specifically by 45%.<br />
The estimated natural gas consumption for each address <strong>in</strong> terms of the range of consumption<br />
was illustrated as shown <strong>in</strong> Figure 1, which is taken from Figure 1 of Appendix H of the <strong>Partners</strong><br />
<strong>in</strong> <strong>Project</strong> <strong>Green</strong> Strategy.<br />
3 <strong>Partners</strong> <strong>in</strong> <strong>Project</strong> <strong>Green</strong> Strategy, Section 10 Infrastructure III: <strong>Energy</strong>, Table 34<br />
8
TRCA Pearson Eco-Bus<strong>in</strong>ess Zone <strong>District</strong> <strong>Energy</strong> <strong>Feasibility</strong> <strong>Study</strong> 10 April 2012<br />
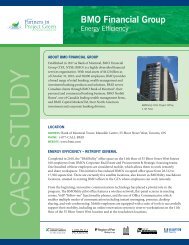
Figure 1 Estimated Natural Gas Consumption by Address<br />
Figure 1 shows there are build<strong>in</strong>gs with significant heat loads all around and <strong>in</strong>side the Airport,<br />
but the area of most <strong>in</strong>terest, which is highlighted by this illustration, is the area immediately<br />
north of the Airport, but south of the railway tracks and west of Highway 27. This area is mostly<br />
<strong>in</strong> Mississauga but <strong>in</strong>cludes a significant slice <strong>in</strong> Toronto (between Highways 27 and 427). This<br />
area appears to conta<strong>in</strong> a large number of build<strong>in</strong>gs with significant heat<strong>in</strong>g loads and is close to<br />
three Cogeneration Plants, which are owned by (1) Magellan Aerospace, (2) Trans-Alta<br />
(identified <strong>in</strong> Figure 1 as the Mississauga Cogeneration Plant) and (3) the Greater Toronto<br />
Airport Authority (GTAA). Therefore, it was decided to focus the <strong>in</strong>vestigation of build<strong>in</strong>g loads<br />
on this area, i.e. postal codes L4V (<strong>in</strong> Peel Region, to the west of Highway 427) and M9W (<strong>in</strong><br />
Toronto, to the east of Highway 427).<br />
9
TRCA Pearson Eco-Bus<strong>in</strong>ess Zone <strong>District</strong> <strong>Energy</strong> <strong>Feasibility</strong> <strong>Study</strong> 10 April 2012<br />
2.1.2 Prospect Screen<strong>in</strong>g<br />
Various attempts were made to screen the large number of bus<strong>in</strong>esses <strong>in</strong> the Pearson Eco-<br />
Bus<strong>in</strong>ess Zone by us<strong>in</strong>g a comb<strong>in</strong>ation of the previous <strong>Project</strong> <strong>Green</strong> work with various<br />
aggregations of actual consumption data that Enbridge could provide while not violat<strong>in</strong>g<br />
customer confidentiality. The data thereby assembled based on postal codes confirmed a level<br />
of natural gas consumption <strong>in</strong> the quadrant of <strong>in</strong>terest (i.e. postal codes L4V and M9W) of<br />
sufficient magnitude to warrant <strong>in</strong>vestigation as to whether a material portion could be offset<br />
with district heat<strong>in</strong>g.<br />
Throughout the Pearson Eco-Bus<strong>in</strong>ess Zone, there are numerous large s<strong>in</strong>gle-storey light<br />
<strong>in</strong>dustrial build<strong>in</strong>gs. This type of build<strong>in</strong>g is usually heated with air directly from distributed roofmounted<br />
heaters. These would be expensive to connect and retrofit with hot water and have<br />
relatively low avoidable ma<strong>in</strong>tenance and capital replacement costs and therefore relatively low<br />
district energy service price potential. Also, it is doubtful whether their owners would attribute<br />
high utility to the value added features of district heat<strong>in</strong>g (comfort, convenience, reliability, longterm<br />
price stability and environmental susta<strong>in</strong>ability), as might owners of multi-residential,<br />
<strong>in</strong>stitutional or Class A office build<strong>in</strong>gs, which are the natural markets for district heat<strong>in</strong>g.<br />
FVB was most <strong>in</strong>terested <strong>in</strong> f<strong>in</strong>d<strong>in</strong>g clusters of multi-storey build<strong>in</strong>gs or, at least, <strong>in</strong>dustrial<br />
facilities of a type that could conceivably <strong>in</strong>clude process loads. The most effective way found<br />
to do that was a comb<strong>in</strong>ation of field <strong>in</strong>spection with use of Google Earth. This allowed the footpr<strong>in</strong>ts<br />
and number of storey to be estimated. The uses of build<strong>in</strong>gs of <strong>in</strong>terest were determ<strong>in</strong>ed<br />
from visual <strong>in</strong>spection. They turned out to be ma<strong>in</strong>ly hotels, offices or <strong>in</strong>dustrial. No pure<br />
residential build<strong>in</strong>gs were found (as is appropriate near an airport), but one <strong>in</strong>stitutional,<br />
residential complex, the Toronto West Detention Centre, is on the periphery of the study area.<br />
The field visits to the area confirmed the existence of numerous, multi-storey build<strong>in</strong>gs along or<br />
close to Airport Road/Dixon Road 4<br />
; but the area further back from Airport Road/Dixon Road,<br />
further northeast, conta<strong>in</strong>s almost no build<strong>in</strong>gs of more than one or two storey. The area (away<br />
from Airport Road/Dixon Road) is almost uniformly light <strong>in</strong>dustrial with some attached offices,<br />
but the offices are relatively small and at most two storey.<br />
The Cara Kitchens, Booth Centennial Laundry, Cott Beverages, BASF and the City of Toronto<br />
Disco Road Transfer Station were the only <strong>in</strong>dustrial facilities that appeared to be a type that<br />
might have process heat loads.<br />
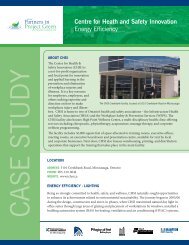
As a result of this field <strong>in</strong>vestigation, 36 prospects were selected, as listed <strong>in</strong> Table 1. The<br />
locations of the 36 selected prospects are shown <strong>in</strong> Figure 2.<br />
# Name # Name<br />
1 Hilton Garden Inn 19 BASF<br />
4<br />
The name of Airport Road changes to Dixon Road as it crosses under the 427 go<strong>in</strong>g east from Peel<br />
Region <strong>in</strong>to Toronto.<br />
10
TRCA Pearson Eco-Bus<strong>in</strong>ess Zone <strong>District</strong> <strong>Energy</strong> <strong>Feasibility</strong> <strong>Study</strong> 10 April 2012<br />
2 Marriott Fairfield Inn & Suites 20 SNC Laval<strong>in</strong><br />
3 Hampton Inn & Suites 21 Transfer Station<br />
4 Airway Center (4 bldgs) 22 West Detention Centre<br />
5 Hilton 23 D<strong>in</strong>een Corporate Centre<br />
6 Holiday Inn 24 Term<strong>in</strong>al 3<br />
7 West<strong>in</strong> 25 Sheraton Gateway Hotel<br />
8 Quality Suite Inn 26 Case Bank Build<strong>in</strong>g<br />
9 Travel Lodge 27 Orlando<br />
10 Courtyard by Marriott 28 Four Po<strong>in</strong>ts Sheraton<br />
11 Toronto Marriott Airport Hotel 29 6299 Airport Rd<br />
12 Renaissance Hotel 30 Comfort Inn<br />
13 Skyway bus<strong>in</strong>ess park (3 bldgs) 31 Cara, Kitchen S<br />
14 Alterna Sav<strong>in</strong>gs 32 Cara ( 2 bldgs)<br />
15 Residence Marriot 33 Cott Beverages<br />
16 Sandman Signature 34 W<strong>in</strong>ner Offices<br />
17 Pearson Corporate Centre 35 International Center<br />
18 Crown Plaza 36 Booth Centennial<br />
Table 1 List of Initial DE Prospects Selected<br />
11
TRCA Pearson Eco-Bus<strong>in</strong>ess Zone <strong>District</strong> <strong>Energy</strong> <strong>Feasibility</strong> <strong>Study</strong> 10 April 2012<br />
2.1.3 Build<strong>in</strong>g Surveys<br />
Figure 2 Locations of Selected DE Prospects<br />
Build<strong>in</strong>g surveys are necessary to ascerta<strong>in</strong> the type of heat<strong>in</strong>g and cool<strong>in</strong>g systems used and<br />
collect historical energy consumption data. The priority decision factor for the build<strong>in</strong>g surveys<br />
was proximity to the identified energy sources.<br />
The most promis<strong>in</strong>g energy source was believed to be the GTAA Central Heat<strong>in</strong>g Plant (CHP)<br />
and Central Utilities Plant (CUP) s<strong>in</strong>ce (1) it is closest to the majority of the prospects, (2) the<br />
GTAA is actively <strong>in</strong>volved <strong>in</strong> the study and (3) it has cool<strong>in</strong>g production facilities as well as<br />
heat<strong>in</strong>g (although, subsequently, it was determ<strong>in</strong>ed that the CUP has little if any spare cool<strong>in</strong>g<br />
capacity, and regardless, the potential market for cool<strong>in</strong>g is not attractive). This consideration<br />
resulted <strong>in</strong> the prospects be<strong>in</strong>g numbered <strong>in</strong> priority sequence start<strong>in</strong>g close to the CUP and<br />
attempts to arrange visits to these build<strong>in</strong>gs were made <strong>in</strong> approximately that order.<br />
Enbridge has a number of bus<strong>in</strong>ess relationships with the major <strong>in</strong>dustrial and commercial<br />
customers <strong>in</strong> this area, <strong>in</strong>clud<strong>in</strong>g some that have recently participated <strong>in</strong> Demand Side<br />
Management <strong>in</strong>itiatives.<br />
TRCA sent a letter to those build<strong>in</strong>g owners and managers that it had relationships with and<br />
which were identified by FVB as priority prospects. The letter requested cooperation with FVB’s<br />
requests to perform surveys of the build<strong>in</strong>g’s heat<strong>in</strong>g and cool<strong>in</strong>g systems.<br />
With the assistance of the TRCA and Enbridge, 9 appo<strong>in</strong>tments were made. To avoid<br />
unnecessary duplication of effort, no attempts were made to re-visit 4 of the prospects that had<br />
been visited dur<strong>in</strong>g a similar study that FVB had performed <strong>in</strong> 2008, the client, Enbridge, hav<strong>in</strong>g<br />
k<strong>in</strong>dly given permission to <strong>in</strong>corporate that <strong>in</strong>formation <strong>in</strong> the current study.<br />
No attempts were made to contact the 10 “farthest out” prospects (those east of the rav<strong>in</strong>e<br />
made by Mimico Creek, between Carl<strong>in</strong>gview and Attwell drives, #’s 12 through 23 on Figure 2),<br />
12
TRCA Pearson Eco-Bus<strong>in</strong>ess Zone <strong>District</strong> <strong>Energy</strong> <strong>Feasibility</strong> <strong>Study</strong> 10 April 2012<br />
because prospects closer to the CUP, and without the complication of bridge cross<strong>in</strong>gs, were a<br />
higher priority to pursue with<strong>in</strong> the time available. Build<strong>in</strong>gs east of Mimico Creek might be<br />
connected at some time <strong>in</strong> the future, but that would probably be dependent on first establish<strong>in</strong>g<br />
a DES anchored by customers closer to the central area, i.e. closest to the CUP.<br />
Similarly, although some ultimately <strong>in</strong>conclusive phone conversations and emails were<br />
exchanged with the operator of the Sheraton Gateway Hotel (# 25), it was decided to not pursue<br />
prospects southwest of Airport Road, which are on airport property. The connection of # 31,<br />
Term<strong>in</strong>al 3 (T3), had been previously studied by GTAA. If T3 were connected it would almost<br />
certa<strong>in</strong>ly be from the exist<strong>in</strong>g distribution system, which runs close to it. Therefore, while T3<br />
may become part of the overall system at some time, it is simpler to lay that issue aside for now.<br />
The visit to # 26 revealed it was under common ownership with # 27. Count<strong>in</strong>g also the 4 that<br />
had been visited <strong>in</strong> 2008, a total of 14 of the selected 36 prospects have been visited. The<br />
breakdown by use is 7 hotels, 3 offices, 3 <strong>in</strong>dustrial and 1 exhibition centre. This <strong>in</strong>cludes # 4,<br />
the Airway Centre, as “one” office build<strong>in</strong>g, but it is actually a complex of 5 build<strong>in</strong>gs.<br />
The survey revealed a variety of types of heat<strong>in</strong>g systems were <strong>in</strong>stalled. Among the 8<br />
prospects that were visited - out of the 11 that are considered to possibly represent Phase 1 of a<br />
potential DES (#’s 1 through 11 on Figure 2) - 5 use either electric resistance heat<strong>in</strong>g or<br />
distributed heat pumps. But they also have supplementary hydronic systems for pool, laundry<br />
and domestic hot water and they generally have supplementary fired air handl<strong>in</strong>g units that<br />
might be connectible. Moreover, gas boilers are used to provide additional heat energy for the 3<br />
that have distributed heat pump systems (i.e. <strong>in</strong> addition to heat derived from the electricity used<br />
to drive the compressors and any heat moved from one part of a build<strong>in</strong>g to another, which is<br />
impossible to quantify).<br />
It is assumed, subject to verification, that these build<strong>in</strong>gs would be worth connect<strong>in</strong>g, based on<br />
their proximity to other prospects, estimated gas consumption and a potential spread between<br />
the variable cost of heat for the DES versus the customers’ Bus<strong>in</strong>ess-as-Usual (BaU) fuel cost.<br />
However, this assumption must be carefully checked with more detailed <strong>in</strong>vestigation, <strong>in</strong>clud<strong>in</strong>g<br />
an estimate of the cost of necessary modifications to the build<strong>in</strong>g’s exist<strong>in</strong>g systems, “secondary<br />
side modifications”.<br />
In some cases, secondary side modifications could <strong>in</strong>clude risers to the roof, which experience<br />
<strong>in</strong>dicates could cost <strong>in</strong> the order of $50,000 and conversion of roof-mounted air handl<strong>in</strong>g units,<br />
which might be <strong>in</strong> the order of $25,000 each. The total cost could vary widely among the<br />
prospects conceivably rang<strong>in</strong>g from $50,000 to $500,000. Given some conservatism <strong>in</strong> the<br />
capital cost estimates for <strong>Energy</strong> Transfer Stations, it is believed that an allowance of an<br />
average of $100,000 per build<strong>in</strong>g is conservative. But this is subject to verification based on<br />
return visits to the build<strong>in</strong>gs and more detailed <strong>in</strong>vestigation.<br />
Summary descriptions of the 8 Phase 1 prospects visited are given <strong>in</strong> Table 2.<br />
13
TRCA Pearson Eco-Bus<strong>in</strong>ess Zone <strong>District</strong> <strong>Energy</strong> <strong>Feasibility</strong> <strong>Study</strong> 10 April 2012<br />
# Brief Description of Heat<strong>in</strong>g System<br />
1 Room Water source heat pumps off boiler/cool<strong>in</strong>g tower loop; boiler system for<br />
basement area, pool, & laundry; 2-DHW boiler systems - 1 each for upper/lower<br />
level; 2-direct gas fired MUA units with DX cool<strong>in</strong>g.<br />
3 Room Through-the-wall-heat pump/air conditioner with supplemental electric<br />
resistance heat<strong>in</strong>g. HW boiler heat<strong>in</strong>g for pool & laundry and DHW boiler <strong>in</strong><br />
penthouse. Gas fired MUA units with DX cool<strong>in</strong>g.<br />
4 Water source heat pumps off boiler/cool<strong>in</strong>g tower loop. DHW system unknown.<br />
5 Room Water source heat pumps off boiler/cool<strong>in</strong>g tower loop; boiler plant each for<br />
north/south tower, multiple gas fired roof top MUA units<br />
7 Central boiler/chiller plant to room fan coils. Roof gas fired MUA units with DX<br />
cool<strong>in</strong>g.<br />
8 Central boiler/chiller plant to room fan coils. Hydronic roof top units.<br />
9 Room electric resistance heat<strong>in</strong>g, common space gas fired make up air units. Boiler<br />
system for DHW/Laundry.<br />
11 4-pipe fan coil central boiler/chiller plant (hydronic coils <strong>in</strong> MUA units). 9 Gas fired for<br />
DHW system.<br />
Table 2 Summary of Exist<strong>in</strong>g Heat<strong>in</strong>g System Types for Visited Prospects <strong>in</strong> Phase 1<br />
Appendix B conta<strong>in</strong>s more detailed summaries for build<strong>in</strong>gs 1 through 11 based on the build<strong>in</strong>g<br />
surveys and further analysis, <strong>in</strong>clud<strong>in</strong>g estimation of thermal loads and Bus<strong>in</strong>ess-as-Usual self<br />
generation costs. Assumptions were made for the three Phase 1 potential customers not visited<br />
based on general <strong>in</strong>formation learned about the others.<br />
2.1.4 Prospect Load Estimates<br />
From the build<strong>in</strong>g surveys and gas consumption data, where available, or, <strong>in</strong> other cases, Gross<br />
Floor Area (GFA) and energy <strong>in</strong>tensity factors from FVB’s local experience, FVB estimated the<br />
peak thermal demand for all of the 36 prospects, which totaled 44 MWt, exclud<strong>in</strong>g Term<strong>in</strong>al 3,<br />
which is estimated to be approximately 17 MWt.<br />
The 20 prospects considered most likely to be served by a DES <strong>in</strong> Phases 1, 2 or 3 are<br />
presented <strong>in</strong> Table 3 with their thermal load estimates. It is noted that 7 of these have not yet<br />
been visited, but this group <strong>in</strong>cludes most of the build<strong>in</strong>gs visited <strong>in</strong> the two studies <strong>in</strong> 2008 and<br />
2011, a total of 13, while the 14 th prospect that was visited, # 19, BASF, is located further up<br />
Carl<strong>in</strong>gview Drive, such that its connection would depend on a later extension to serve other<br />
prospects along Carl<strong>in</strong>gview Drive or north of Highway 409, yet to be def<strong>in</strong>ed, and probably<br />
subsequent to Phase 3.<br />
The total undiversified peak heat<strong>in</strong>g demand of the proposed Phases 1, 2 and 3 is 22 MWt, with<br />
almost 14 MWt <strong>in</strong> Phase 1. Development beyond Phase 1 is speculative, but it is reasonable to<br />
14
TRCA Pearson Eco-Bus<strong>in</strong>ess Zone <strong>District</strong> <strong>Energy</strong> <strong>Feasibility</strong> <strong>Study</strong> 10 April 2012<br />
expect that should a DES become established, it would cont<strong>in</strong>ue to grow connect<strong>in</strong>g additional<br />
multi-storey build<strong>in</strong>gs along Airport Road.<br />
Map # Load Description Visited ? Heat<strong>in</strong>g Load (kW) Cool<strong>in</strong>g Load (tons)<br />
1 Hilton Garden Inn yes 825 250<br />
2 Marriott Fairfield Inn & Suites no 600 200<br />
3 Hampton Inn & Suites yes 400<br />
4 Airway Center yes 1,400 800<br />
5 Hilton Airport Hotel yes 1,600 570<br />
Subtotal 1A<br />
4,825 1,820<br />
6 Holiday Inn no 1,400 360<br />
7 West<strong>in</strong> Bristol Place yes 1,600 290<br />
8 Quality Suite Inn yes 900 310<br />
9 Travel Lodge yes 600 310<br />
10 Courtyard by Marriott no 2,100 590<br />
11 Toronto Marriott Airport Hotel yes 2,400 650<br />
Subtotal 1<br />
9,000 2,510<br />
26 Chase Bank Build<strong>in</strong>g yes 200 110<br />
27 Orlando yes 400 130<br />
28 Four Po<strong>in</strong>ts Sheraton no 500 130<br />
29 Ontario General Contractors no 400 230<br />
30 Comfort Inn no 400 100<br />
Subtotal 2<br />
1,900 700<br />
33 Cott Beverages yes 1,200 110<br />
34 W<strong>in</strong>ner Offices no 700 260<br />
35 International Center yes 500 760<br />
36 Booth Centennial yes 4,200 560<br />
Subtotal 3<br />
Total<br />
15<br />
6,600 1,690<br />
22,325 6,720<br />
Table 3 Estimated Heat<strong>in</strong>g and Cool<strong>in</strong>g Loads by Phase<br />
The feasibility of connect<strong>in</strong>g prospects east of Mimico Creek, Figure 2 #’s 12 through 23 would<br />
require a special <strong>in</strong>vestigation of the issue of us<strong>in</strong>g the bridge(s) as pipe supports. This might<br />
be feasible as an eventual system expansion provided Phase 1 was established.<br />
The possibility of serv<strong>in</strong>g additional build<strong>in</strong>gs on airport property, i.e. south of Airport Road, not<br />
already served by the proposed system could be <strong>in</strong>vestigated later if a core DES became<br />
established.<br />
2.2 Load Diversification Factor<br />
A DES will normally have a lower thermal peak than the sum of the <strong>in</strong>dividual build<strong>in</strong>gs’ thermal<br />
peaks. This is due to the fact that <strong>in</strong>dividual build<strong>in</strong>gs reach their respective thermal peaks at<br />
different times dur<strong>in</strong>g the day. This is known as load diversification. The mix of different
TRCA Pearson Eco-Bus<strong>in</strong>ess Zone <strong>District</strong> <strong>Energy</strong> <strong>Feasibility</strong> <strong>Study</strong> 10 April 2012<br />
build<strong>in</strong>g types normally conta<strong>in</strong>ed with<strong>in</strong> a DES requires consideration of load diversification <strong>in</strong><br />
siz<strong>in</strong>g the production plant and distribution system.<br />
It is estimated that the diversification for this system will be 85%. In other words, the peak load<br />
of the system will be 85% of the total connected (contract) load, approximately 19 MWt for<br />
Phases 1, 2 and 3 and 12 MWt for Phase 1. If verified, the diversified system load of 12 MWt<br />
for Phase 1, or even about three-quarters of it, would represent a sufficient size to be a viable<br />
DES. It would be larger than many of the hot water district heat<strong>in</strong>g systems <strong>in</strong> Canada.<br />
The bus<strong>in</strong>ess case will be developed us<strong>in</strong>g these peak demands and the estimated build<strong>in</strong>g<br />
loads for Phase 1.<br />
3 <strong>Energy</strong> Sources<br />
3.1 Description of the Appropriate Type of DES<br />
It is proposed that the DES supply heat<strong>in</strong>g only, and not cool<strong>in</strong>g, as the prospective customers<br />
are all exist<strong>in</strong>g build<strong>in</strong>gs. There is no opportunity to save customers the capital cost of cool<strong>in</strong>g<br />
systems, which is the ma<strong>in</strong> advantage of district cool<strong>in</strong>g <strong>in</strong> Canada.<br />
3.2 <strong>Energy</strong> Source<br />
A variety of energy sources are used <strong>in</strong> DES. Appendix C provides a general overview of some<br />
types of sources that have been used <strong>in</strong> DES built recently <strong>in</strong> Canada. It is FVB’s op<strong>in</strong>ion that<br />
the most practical sure energy choice for a new DES <strong>in</strong> the Pearson area <strong>in</strong> the near future<br />
would be natural gas and electricity.<br />
Whereas biogas from anaerobic digestion is expected to be produced at the City of Toronto<br />
Disco Road Transfer Station (TS) only 1-2 kilometres from the envisaged <strong>Energy</strong> Centre, it is<br />
understood that this biogas is all committed to be upgraded for pipel<strong>in</strong>e gas (a.k.a. green gas)<br />
under an arrangement with Enbridge. If for any reason it turns out that sufficient biogas<br />
becomes available from Disco TS, it might be a source for the DES.<br />
One of the advantages of DE is that it is able to switch fuel sources more easily than <strong>in</strong>dividual<br />
build<strong>in</strong>gs.<br />
3.2.1 Potential <strong>Energy</strong> Sources Investigated<br />
Three exist<strong>in</strong>g Cogeneration Plants had been <strong>in</strong>cluded <strong>in</strong> the scope of work as potential energy<br />
sources to be <strong>in</strong>vestigated: owned by (1) Magellan Aerospace, (2) Trans-Alta and (3) the GTAA.<br />
Owners or operators of each of these facilities <strong>in</strong>dicated that their plant cannot be relied on to<br />
serve as an energy source for the envisioned DES.<br />
Magellan Aerospace and Trans-Alta<br />
Magellan Aerospace <strong>in</strong>dicated that their plant would not be available to supply a DES and<br />
Trans-Alta responded that their plant uses all of its steam production <strong>in</strong>ternally.<br />
GTAA CUP<br />
The GTAA CUP has four steam boilers, each 65,000 lbs/hr capacity (a total of approximately 76<br />
16
TRCA Pearson Eco-Bus<strong>in</strong>ess Zone <strong>District</strong> <strong>Energy</strong> <strong>Feasibility</strong> <strong>Study</strong> 10 April 2012<br />
MWt) and the heat<strong>in</strong>g load has been reported to be approximately 29 MWt 5<br />
. The GTAA<br />
<strong>in</strong>dicated that firm capacity from the CUP could not be committed for the DES because the CUP<br />
capacity is reserved for future airport expansion. The CUP has an associated Cogeneration<br />
Plant with the capability to extract steam for heat<strong>in</strong>g purposes. The GTAA advised it would not<br />
be prudent to base the bus<strong>in</strong>ess plan on an assumed supply from the Cogeneration Plant<br />
because of both the uncerta<strong>in</strong> value of electricity <strong>in</strong> future and other uncerta<strong>in</strong>ties impact<strong>in</strong>g the<br />
availability of steam. A more detailed description of the operation of GTAA’s CUP and<br />
Cogeneration Plant is found <strong>in</strong> Appendix D.<br />
3.2.2 Proposed <strong>Energy</strong> Centre<br />
As the availability of energy from exist<strong>in</strong>g sources is unlikely under current conditions, it is<br />
proposed that the base case of the bus<strong>in</strong>ess plan for the DES be a new <strong>Energy</strong> Centre on a<br />
vacant parcel of land on Elmbank Road, across the street from the CUP. If the DES becomes<br />
established it is possible that a supplementary supply arrangement may be developed from the<br />
GTAA cogeneration plan.<br />
The <strong>in</strong>itial design criteria for the <strong>Energy</strong> Centre would be to meet the diversified peak demand <strong>in</strong><br />
Phase 1, i.e. 12 MWt. Allow<strong>in</strong>g for one redundant boiler <strong>in</strong> accordance with the “N+1” reliability<br />
criterion, the recommended heat generation capacity consists of four 4 MWt boilers.<br />
If the project proceeds with no early prospect of heat supply from an external source, it is likely<br />
that an appropriately sized CHP unit, approximately 4 MWe, would be added provided that a<br />
suitable contract could be arranged with the Ontario Power Authority.<br />
The DES would also generate electricity as a by-product, us<strong>in</strong>g the CHP. The electricity would<br />
be partly consumed <strong>in</strong> the <strong>Energy</strong> Centre, but most would be <strong>in</strong>jected <strong>in</strong>to the local electricity<br />
distribution system. This is a form of Distributed Generation (DG) (i.e. electricity generation<br />
connected to a local distribution system not to the prov<strong>in</strong>ce-wide transmission system). It will<br />
ease congestion on the transmission system and reduce losses on both the transmission and<br />
distribution systems. The CHP unit would be capable of operat<strong>in</strong>g <strong>in</strong> island mode to keep the<br />
<strong>Energy</strong> Centre <strong>in</strong> operation <strong>in</strong> the event of a grid outage. There might be some reliability benefit<br />
to the airport to also <strong>in</strong>clude the CUP <strong>in</strong> this island.<br />
Table 4 identifies the size and number of the major equipment for Phase 1 to serve a diversified<br />
heat<strong>in</strong>g load of 12 MWt. Additional 4 MWt boilers would be added to meet additional load as<br />
required.<br />
Major Equipment Size Number<br />
Hot Water Boiler 4 MWt 4<br />
Eng<strong>in</strong>e Generator 4 MWe 1<br />
Heat Rejection from CHP 4 MWt 1<br />
Table 4 List of Major Equipment<br />
The <strong>in</strong>itial site selected for the proposed <strong>Energy</strong> Centre is on the vacant parcel of land on the<br />
east side of Elmbank Road, directly across the street from the CUP that supplies heat<strong>in</strong>g and<br />
cool<strong>in</strong>g to the airport.<br />
5<br />
Report on <strong>Feasibility</strong> of Connect<strong>in</strong>g the Central Utility Plant to Term<strong>in</strong>al Three, H.H. Angus, November<br />
27, 2008.<br />
17
TRCA Pearson Eco-Bus<strong>in</strong>ess Zone <strong>District</strong> <strong>Energy</strong> <strong>Feasibility</strong> <strong>Study</strong> 10 April 2012<br />
A conceptual layout of this standalone <strong>Energy</strong> Centre and site location is shown on a draw<strong>in</strong>g <strong>in</strong><br />
Appendix E.<br />
4 Distribution<br />
4.1 Introduction<br />
Hot water will be produced at the <strong>Energy</strong> Centre and supplied through the distribution pip<strong>in</strong>g<br />
system (DPS) also referred to as the “primary side”. The DPS flows are varied based on the<br />
differential pressure (∆P) read<strong>in</strong>gs at the build<strong>in</strong>g <strong>Energy</strong> Transfer Stations (ETS). This ensures<br />
that adequate flow is ma<strong>in</strong>ta<strong>in</strong>ed to all build<strong>in</strong>gs <strong>in</strong> the system.<br />
Hot water distribution pipes are comprised of supply and return pipes of the same diameter.<br />
Generally, pipes are run <strong>in</strong> a side-by-side configuration. In most cases, distribution pip<strong>in</strong>g will be<br />
<strong>in</strong>stalled under roads and streets, sidewalks and green spaces us<strong>in</strong>g open trench construction<br />
methods. In some <strong>in</strong>stances trenchless technologies might need to be employed. This will be <strong>in</strong><br />
cases where the distribution l<strong>in</strong>es come <strong>in</strong>to conflict with other utilities or a section of street is<br />
congested with utilities.<br />
Typical pip<strong>in</strong>g will be <strong>in</strong>stalled with approximately 900 to 1,200 millimeters (mm) of cover. The<br />
distribution network will be designed to have a m<strong>in</strong>imum cover of 600 mm over the distribution<br />
pipel<strong>in</strong>es. The actual amount of cover may vary throughout the network and will depend on<br />
utility conflicts and distribution servic<strong>in</strong>g requirements.<br />
4.2 Distribution Network Pipe Rout<strong>in</strong>g and Siz<strong>in</strong>g<br />
FVB has prepared a prelim<strong>in</strong>ary distribution-pip<strong>in</strong>g concept <strong>in</strong>clud<strong>in</strong>g: rout<strong>in</strong>g and siz<strong>in</strong>g to<br />
provide heat<strong>in</strong>g services to the targeted build<strong>in</strong>gs. L<strong>in</strong>es are sized to accommodate the full<br />
development as identified <strong>in</strong> the load tables <strong>in</strong>cluded <strong>in</strong> Section 2: Customer Demand.<br />
It is assumed that all the required heat would be supplied from the <strong>Energy</strong> Centre, and the<br />
preferred rout<strong>in</strong>g has been identified by FVB, as shown on the draw<strong>in</strong>g <strong>in</strong>cluded <strong>in</strong> Appendix F.<br />
The proposed DPS has approximately 3.2 trench kilometres of supply and return pipe, <strong>in</strong>clud<strong>in</strong>g<br />
branch l<strong>in</strong>es to customers, rang<strong>in</strong>g <strong>in</strong> size from 300 mm (approximately 12 <strong>in</strong>ches) <strong>in</strong>ternal<br />
diameter (which would be approximately 16 <strong>in</strong>ches <strong>in</strong>clud<strong>in</strong>g <strong>in</strong>sulation) exit<strong>in</strong>g the <strong>Energy</strong><br />
Centres down to 150 mm at the far end of the l<strong>in</strong>e and 80, 100 or 125 mm branch l<strong>in</strong>es to<br />
customers.<br />
More scrut<strong>in</strong>y of the streets is required before determ<strong>in</strong><strong>in</strong>g f<strong>in</strong>al route plans. This would have to<br />
be done <strong>in</strong> close cooperation with the local authorities and other utilities.<br />
4.2.1 Design Criteria for Medium Temperature Hot Water (MTHW) Distribution Pip<strong>in</strong>g<br />
System<br />
The distribution system must be capable of handl<strong>in</strong>g the required flow, at the required<br />
temperature and pressure drop, to ma<strong>in</strong>ta<strong>in</strong> the system energy load demand. System<br />
diversification factor is 85 percent on the overall build<strong>in</strong>g loads. Design criteria for DPS are<br />
listed <strong>in</strong> Table 5. The maximum supply temperature is conservatively set at 120°C to allow for<br />
connection of some older build<strong>in</strong>gs, which may require 80°C secondary supply temperature,<br />
subject to more detailed consideration.<br />
The system would be operated at as low a temperature as possible to maximize the efficiency of<br />
the <strong>Energy</strong> Centre and reduce distribution losses.<br />
18
TRCA Pearson Eco-Bus<strong>in</strong>ess Zone <strong>District</strong> <strong>Energy</strong> <strong>Feasibility</strong> <strong>Study</strong> 10 April 2012<br />
Design Parameters MTHW<br />
Pipe Velocities:<br />
Buried Ma<strong>in</strong>s & Ma<strong>in</strong>s <strong>in</strong> Tunnels<br />
Max. Water Velocity <strong>in</strong> Service L<strong>in</strong>es<br />
Temperatures:<br />
Max. Supply Temp.<br />
M<strong>in</strong>. Supply Temp. (Off Peak)<br />
Max. Return Temp.<br />
M<strong>in</strong>. Return Temp.<br />
19<br />
2 – 5 m/sec<br />
3 m/sec<br />
120°C<br />
75°C<br />
75°C<br />
45°C<br />
System Design Pressure 1600 kPa<br />
System Test Pressure 1.5 x Design Pressure<br />
M<strong>in</strong>imum Trench Slope for Dra<strong>in</strong>age 0.5%<br />
Table 5 DPS Design Criteria<br />
4.2.2 Material<br />
The DPS shall be <strong>in</strong>stalled as a fully welded and bonded system <strong>in</strong> which the steel carrier pipe,<br />
<strong>in</strong>sulation and outer cas<strong>in</strong>g are bonded together to form a solid unit. This solid unit when buried<br />
is completely sealed from soil and water <strong>in</strong>gress and hence provides superior longevity and<br />
performance. It is critical for reliability that owners procure from suppliers of complete buried<br />
systems rather than attempt<strong>in</strong>g to assemble components from multiple suppliers to provide a<br />
completely sealed system.<br />
The system consists of a steel carrier pipe, polyurethane foam <strong>in</strong>sulation with <strong>in</strong>tegral copper<br />
leak detection alarm wires, and an outer cas<strong>in</strong>g of high density polyethylene. The system shall<br />
be designed such that the expansion movements of the steel carrier pipe are transferred to the<br />
outer cas<strong>in</strong>g via the foam <strong>in</strong>sulation. The elements of the bonded pipes shall be manufactured<br />
to expand and move together. The movements are restricted by the friction between soil and<br />
jacket pipe, which acts as the anchorage for the pipe system. Generally external anchors are<br />
not required. Expansion is allowed for, as determ<strong>in</strong>ed by the stress analysis.<br />
4.2.3 Vents and Valves<br />
In the majority of cases direct buried valves and vents will be <strong>in</strong>stalled <strong>in</strong> the heat<strong>in</strong>g distribution<br />
system. These will be operated through risers and valve boxes set at street level. Valve<br />
chambers will be designed and <strong>in</strong>stalled as necessary at strategic locations to house the larger<br />
isolation valves. Dra<strong>in</strong>s and vents will be <strong>in</strong>stalled either at the valve chambers or at separate<br />
purpose built chambers as necessary with<strong>in</strong> streets and sidewalks. The vaulted chambers may<br />
be constructed <strong>in</strong> place us<strong>in</strong>g re<strong>in</strong>forced precast concrete units or high density polymer<br />
concrete. All manholes will have person access for operation, ma<strong>in</strong>tenance and repair.
TRCA Pearson Eco-Bus<strong>in</strong>ess Zone <strong>District</strong> <strong>Energy</strong> <strong>Feasibility</strong> <strong>Study</strong> 10 April 2012<br />
4.2.4 Trench Details<br />
Open trench width is dependent on the pipe size, but for a common size of 150 mm (Nom<strong>in</strong>al<br />
Pipe Size 6”) heat<strong>in</strong>g carrier pipes, the trench width will be a maximum of approximately 1,280<br />
mm (50”). Trench cutbacks <strong>in</strong> unpaved areas are based on a 1:1 slope for depths greater than<br />
1.0 metre, or as required by local regulations or procedures.<br />
Native soils, if suitable, will be returned and compacted <strong>in</strong> the trench to complete fill<strong>in</strong>g up to the<br />
underside of the roadbed. Trench construction and all work with<strong>in</strong> the streets will conform to<br />
City and/or Regional requirements. Generally, all re<strong>in</strong>statement is to an “as was” condition<br />
and/or to meet adjacent conditions.<br />
4.2.5 Communication Cable System<br />
The Communication Cable System will provide the communication l<strong>in</strong>k between each build<strong>in</strong>g<br />
and the <strong>Energy</strong> Centre. This will allow remote supervision; control and meter<strong>in</strong>g of each ETS,<br />
as well as Variable Frequency Drive (VFD) pump control via ∆P sensors at the furthest po<strong>in</strong>ts <strong>in</strong><br />
the distribution system.<br />
4.2.6 Leak Detection System<br />
The leak detection system detects moisture <strong>in</strong> the <strong>in</strong>sulation based on a change <strong>in</strong> conductivity<br />
of the <strong>in</strong>sulation. Two non-<strong>in</strong>sulated wires are supplied <strong>in</strong> each component’s polyurethane<br />
<strong>in</strong>sulation of the prefabricated pip<strong>in</strong>g system. Each component wire is connected and the<br />
system is l<strong>in</strong>ked to a central monitor<strong>in</strong>g device.<br />
The results discussed <strong>in</strong> Section 2: Customer Demand have been used to prepare a conceptual<br />
design of the DPS. We cannot presume that the GTAA CUP will be a supplementary energy<br />
source, but it is a good candidate and centrally located with respect to the customers.<br />
Fortunately there is vacant land on the east side of Elmbank Road, i.e. <strong>in</strong> between the CUP and<br />
prospective customers #’s 1, 2 and 3, just across the street from the CUP, which has been<br />
designated by <strong>Partners</strong> <strong>in</strong> <strong>Project</strong> <strong>Green</strong> for the <strong>Energy</strong> Centre.<br />
The <strong>in</strong>tent would be to construct a new <strong>Energy</strong> Centre on this site that might be eventually<br />
connected to the CUP, with consequent improvement <strong>in</strong> reliability for both.<br />
If there was any district cool<strong>in</strong>g component, which at this time seems unlikely, possibly limited to<br />
only the Airway Centre, the recommended distribution medium for commercial district cool<strong>in</strong>g<br />
systems is chilled water supplied at temperatures rang<strong>in</strong>g from 4 to 8 °C (re-set accord<strong>in</strong>g to<br />
outside air temperature) and controlled to achieve a return temperature of 14 °C. This<br />
temperature profile is compatible with standard build<strong>in</strong>g HVAC systems. The ΔT of 10 °C on<br />
peak reduces pip<strong>in</strong>g and equipment siz<strong>in</strong>g. Until confirmed through specific commitments with<br />
the Airway Centre, it will be assumed that there will be no cool<strong>in</strong>g component to the project <strong>in</strong><br />
the foreseeable future.<br />
4.3 <strong>Energy</strong> Transfer Stations<br />
The DPS would deliver hot water and chilled water to the ETS located <strong>in</strong> the basements of each<br />
customer build<strong>in</strong>g. The ETS, although located <strong>in</strong> the customer build<strong>in</strong>g, would be owned and<br />
operated by the DES.<br />
The components of an ETS <strong>in</strong>clude:<br />
Separate heat exchangers (HX’s) for domestic hot water (DHW) and space heat<strong>in</strong>g<br />
Primary pip<strong>in</strong>g to connect the HX’s to the branch l<strong>in</strong>es of the DPS<br />
20
TRCA Pearson Eco-Bus<strong>in</strong>ess Zone <strong>District</strong> <strong>Energy</strong> <strong>Feasibility</strong> <strong>Study</strong> 10 April 2012<br />
Shut-off valves on the primary pip<strong>in</strong>g<br />
Controls, <strong>in</strong>clud<strong>in</strong>g electric operated control valves, to regulate flow required to meet the build<strong>in</strong>g’s<br />
energy demand and ma<strong>in</strong>ta<strong>in</strong> the DES return temperatures<br />
Thermal <strong>Energy</strong> Meters<br />
Short lengths of secondary pip<strong>in</strong>g with secondary side temperature <strong>in</strong>struments<br />
Miscellaneous fitt<strong>in</strong>gs such as vents, stra<strong>in</strong>ers and thermo-wells for the energy meter and<br />
temperature <strong>in</strong>struments<br />
DHW at 60°C would be required by plumb<strong>in</strong>g codes to prevent growth of Legionella bacteria<br />
s<strong>in</strong>ce it is known that hot water storage tanks are <strong>in</strong>corporated <strong>in</strong> the secondary system of some<br />
of the potential customers. This requires 65°C on the primary side. It would be preferable to<br />
omit hot water storage tanks and supply DHW at a lower temperature, but this is a decision that<br />
must <strong>in</strong>volve the build<strong>in</strong>g HVAC eng<strong>in</strong>eers.<br />
The hot side <strong>in</strong>let temperature for space heat<strong>in</strong>g could go as high as 120°C from a regulatory<br />
design perspective. However, the system would be operated at as low a temperature as<br />
possible (m<strong>in</strong>imum 65°C due to DHW requirements).<br />
The ETS will occupy approximately 20% of the space that would be required by equipment<br />
serv<strong>in</strong>g the same functions <strong>in</strong> BaU. The rest of the HVAC system would be essentially the<br />
same <strong>in</strong> BaU, except for some relatively m<strong>in</strong>or changes to ensure good ΔT, which is important<br />
to achieve design capacity of the DES.<br />
4.3.1 Meter<strong>in</strong>g<br />
The thermal energy meters (TEM) are an important component of the ETS.<br />
All TEM used <strong>in</strong> the ETS comply with the Canadian Standards Association (CSA) heat meter<strong>in</strong>g<br />
standard (CSA C.900), as may be amended or replaced from time to time. CSA C.900 is<br />
currently an adaptation of European Standard EN1434 with Canadian deviations.<br />
The energy meter will collect data on:<br />
Cumulative volume <strong>in</strong> cubic meters (m 3 )<br />
Cumulative energy <strong>in</strong> MWht<br />
Thermal power demand <strong>in</strong> kWt<br />
Flow rate <strong>in</strong> m 3 /hour<br />
Supply and return temperatures<br />
Temperature difference (∆T)<br />
The data from each meter will be transmitted periodically to a central DES computer. This data<br />
will be used for bill<strong>in</strong>g and trouble-shoot<strong>in</strong>g. Data from ETS <strong>in</strong>struments can be shared with<br />
build<strong>in</strong>g automation systems if desired.<br />
In many cases, the scope of work of a DE pip<strong>in</strong>g contractor will <strong>in</strong>clude <strong>in</strong>stall<strong>in</strong>g branch l<strong>in</strong>es to<br />
just <strong>in</strong>side the basement walls. The pipes are capped and left for the ETS mechanical<br />
contractor to connect to the ETS. The ETS <strong>in</strong>stallation contractor is normally employed by the<br />
DES owner who will own, operate and ma<strong>in</strong>ta<strong>in</strong> the ETS. Therefore, appropriate easements<br />
and protocol for the ETS <strong>in</strong>stallation and operation would be part of the <strong>Energy</strong> Service<br />
Agreement.<br />
The scope of work for the ETS <strong>in</strong>stallation contractor <strong>in</strong> recent projects has <strong>in</strong>cluded short<br />
lengths of pip<strong>in</strong>g on the secondary side of the heat exchanger to accommodate <strong>in</strong>strumentation<br />
essential to the control of the ETS. The build<strong>in</strong>g mechanical contractor, employed by the<br />
21
TRCA Pearson Eco-Bus<strong>in</strong>ess Zone <strong>District</strong> <strong>Energy</strong> <strong>Feasibility</strong> <strong>Study</strong> 10 April 2012<br />
build<strong>in</strong>g developer, then connects the build<strong>in</strong>g heat<strong>in</strong>g and, if applicable, cool<strong>in</strong>g systems to<br />
these stubs of secondary pip<strong>in</strong>g.<br />
The location of, ensur<strong>in</strong>g access to <strong>in</strong>stall and the requirements for the ETS all demand close<br />
cooperation between the DE consultants, DE contractor, and the build<strong>in</strong>g eng<strong>in</strong>eers and<br />
contractors. For example, the build<strong>in</strong>g architects are often <strong>in</strong>terested <strong>in</strong> the dimensions of the<br />
ETS.<br />
A process schematic of a typical ETS is shown <strong>in</strong> Appendix G. Further details of construction<br />
and operations are outl<strong>in</strong>ed <strong>in</strong> the follow<strong>in</strong>g paragraphs.<br />
4.3.2 General<br />
Each build<strong>in</strong>g will be connected to the distribution system <strong>in</strong>directly through an energy transfer<br />
station (ETS).<br />
The purpose of the ETS is to transfer the energy transported from the <strong>Energy</strong> Centre through<br />
the distribution pip<strong>in</strong>g network to the customer via heat exchangers to satisfy the build<strong>in</strong>g’s<br />
heat<strong>in</strong>g needs. The build<strong>in</strong>g heat<strong>in</strong>g system design for new build<strong>in</strong>gs is open to the designer as<br />
long as the system meets the basic requirements of the DES.<br />
4.3.3 ETS Basic Equipment<br />
An energy transfer station is made up of heat exchanger(s), isolation valves, stra<strong>in</strong>ers, control<br />
package – <strong>in</strong>clud<strong>in</strong>g controller, control valve(s), temperature and pressure sensors, and energy<br />
meter<strong>in</strong>g package – <strong>in</strong>clud<strong>in</strong>g flow meter, temperature transmitters, and energy calculator.<br />
The thermal capacity delivered to each customer is controlled by modulat<strong>in</strong>g motorized control<br />
valve(s) located on the distribution system side (or primary DH side) of the energy transfer<br />
station. The DH system will employ a flow and supply water temperature strategy that will vary<br />
both parameters based on outside air temperature and load demand. The actual load delivered<br />
to each customer is controlled by modulat<strong>in</strong>g motorized control valve(s) located on the<br />
distribution system side (or primary DH side) of the energy transfer station. This variable flow<br />
and temperature reset strategy will aid <strong>in</strong> maximiz<strong>in</strong>g the efficiency of the entire system.<br />
4.3.4 ETS Design Criteria<br />
Design criteria for ETS are listed <strong>in</strong> Table 6.<br />
Design Conditions ETS<br />
Temperatures:<br />
Max. DH Supply Temp. 6<br />
M<strong>in</strong>. DH Supply Temp. (Summer)<br />
Max. DH Return Temp. (New Build<strong>in</strong>gs)<br />
Max. DH Return Temp. (Exist<strong>in</strong>g Build<strong>in</strong>gs)<br />
22<br />
120°C<br />
6 Temperatures will be reset based on outside air temperature (OAT) for energy conservation purposes.<br />
The coolest water possible will be delivered to the customer that will still meet the customer’s heat<strong>in</strong>g<br />
criteria and needs.<br />
65°C<br />
55°C<br />
75°C
TRCA Pearson Eco-Bus<strong>in</strong>ess Zone <strong>District</strong> <strong>Energy</strong> <strong>Feasibility</strong> <strong>Study</strong> 10 April 2012<br />
Max. Customer Supply Temp.<br />
Max. Customer Return Temp.<br />
Max. Customer Domestic Hot Water Supply<br />
Temp.<br />
Pressures:<br />
DH System Design Pressure<br />
ETS Primary Side Operat<strong>in</strong>g ∆P<br />
Customer Side Design Pressure<br />
Customer Side Operat<strong>in</strong>g ∆P<br />
System Test Pressures<br />
23<br />
75°C<br />
50°C<br />
60°C<br />
1600 kPag<br />
150 - 1000 kPad<br />
≤1600 kPag<br />
As required<br />
1.5 x Design Pressure<br />
Table 6 ETS Design Criteria<br />
4.3.5 ETS Location and Configuration<br />
The DES system has to be sufficiently pressurized at the EC to overcome the elevation<br />
difference <strong>in</strong> the system and to avoid boil<strong>in</strong>g (or flash<strong>in</strong>g) from occurr<strong>in</strong>g at the high po<strong>in</strong>ts. In<br />
addition, some further marg<strong>in</strong> is required to m<strong>in</strong>imize the effect of operat<strong>in</strong>g disturbances, such<br />
as cavitations and pressure surges (i.e. transient pressures). Increased static pressure<br />
requirements will limit the maximum allowable dynamic pressure <strong>in</strong> the system set by the design<br />
pressure of 1,600 kPa, effectively impos<strong>in</strong>g unnecessary limitations on the system capacity.<br />
Thus, it is recommended to <strong>in</strong>stall ETS’s at the basement or ground floor level to ensure that the<br />
build<strong>in</strong>g elevations to do not put unwanted static pressure limitations on the system.<br />
New build<strong>in</strong>gs should allocate space <strong>in</strong> a basement level mechanical room for the ETS<br />
equipment.<br />
Series or cascad<strong>in</strong>g of the space heat<strong>in</strong>g heat exchangers and domestic hot water (DHW) heat<br />
exchangers should be considered where beneficial to improve the return water temperatures.<br />
This is generally only applicable for build<strong>in</strong>gs with large co<strong>in</strong>cidental usage such as multi-story<br />
residential and hotels, and only when configured as an <strong>in</strong>stantaneous DHW system. The<br />
criteria for each type of connection to be used are to be established at the design stage.<br />
4.3.6 Heat Exchangers<br />
Brazed plate heat exchangers are recommended for space heat<strong>in</strong>g, and double-wall plate &<br />
frame are recommended for domestic hot water applications. The double-wall design will<br />
prevent any possible cross-contam<strong>in</strong>ation between the district and build<strong>in</strong>g sides.<br />
The heat exchangers would be selected based on the above design criteria and allowable heat<br />
exchanger pressure drops specified by the design eng<strong>in</strong>eers.<br />
The m<strong>in</strong>imum DH supply temperature is limited to 65°C <strong>in</strong> summer <strong>in</strong> order to meet the<br />
requirements of the domestic hot water systems whose storage tanks must be ma<strong>in</strong>ta<strong>in</strong>ed at<br />
m<strong>in</strong>imum 60°C to prevent bacteria growth (i.e. Legionella) <strong>in</strong> the system. With an <strong>in</strong>stantaneous<br />
domestic hot water design with cont<strong>in</strong>uous recirculation, it is possible to lower the supply
TRCA Pearson Eco-Bus<strong>in</strong>ess Zone <strong>District</strong> <strong>Energy</strong> <strong>Feasibility</strong> <strong>Study</strong> 10 April 2012<br />
temperature by 5 o C to 10 o C s<strong>in</strong>ce the storage tanks should not be required with this<br />
configuration; however, this would be an issue to discuss with the hotel operators, who may<br />
have a strong preference for reta<strong>in</strong><strong>in</strong>g their DHW storage tanks.<br />
4.3.7 Control & <strong>Energy</strong> Meter<strong>in</strong>g<br />
Each ETS will have control and meter<strong>in</strong>g devices to measure cont<strong>in</strong>uous thermal energy usage,<br />
and to ma<strong>in</strong>ta<strong>in</strong> proper temperature relationships between the DH system supply and each<br />
build<strong>in</strong>g. The energy usage is calculated by the energy meter based on <strong>in</strong>put from the flow<br />
meter and the two matched pair temperature sensors. The energy meters must meet any<br />
relevant thermal meter<strong>in</strong>g standards such as CSA C900 and EN1434.<br />
4.3.8 Pip<strong>in</strong>g<br />
The district heat<strong>in</strong>g (primary) side shall be an all-welded pip<strong>in</strong>g system <strong>in</strong> accordance with ANSI<br />
B.31.1 and CSA B51. The build<strong>in</strong>g (secondary) side pip<strong>in</strong>g shall be a welded system <strong>in</strong><br />
accordance with ANSI B.31.9. If grooved pip<strong>in</strong>g is used <strong>in</strong> the exist<strong>in</strong>g build<strong>in</strong>g secondary<br />
systems, it can be used as an acceptable alternate. However, it is recommended that all risers<br />
be welded for maximum system <strong>in</strong>tegrity.<br />
5 F<strong>in</strong>ancial, Environmental and Social Analysis<br />
5.1 Bus<strong>in</strong>ess-as-Usual Analysis<br />
The Bus<strong>in</strong>ess-as-Usual (BaU) costs of self-generation of heat <strong>in</strong> the prospective customer’s own<br />
facilities have been estimated for each of the Phase 1 prospects and are documented <strong>in</strong><br />
Appendix B customer by customer. A summary is tabulated <strong>in</strong> a worksheet that is also <strong>in</strong>cluded<br />
<strong>in</strong> Appendix B. The total BaU is used as a basis for design<strong>in</strong>g the service rate structure as<br />
outl<strong>in</strong>ed <strong>in</strong> the Bus<strong>in</strong>ess Model Section of this Report.<br />
The aggregate BAU costs for all of the 11 designated potential customers are shown <strong>in</strong> Table 7.<br />
The costs are shown <strong>in</strong> constant 2011 dollars and will be assumed to escalate at 3% per year<br />
for the purpose of the f<strong>in</strong>ancial projections.<br />
The fuel cost is calculated from a forecast 7 of natural gas commodity prices <strong>in</strong> 2015, assumed to<br />
be the first year the DES would be <strong>in</strong>-service, specifically $5.46/MMBtu 8 (<strong>in</strong> 2011 $) at AECO-<br />
C 9<br />
. Estimated transportation and distribution (T&D) charges were added. The T&D estimate of<br />
$2.96/GJ <strong>in</strong> 2011 $ was based on a recent rate calculation for a similar sized commercial<br />
build<strong>in</strong>g us<strong>in</strong>g the Enbridge Rate 100. Average seasonal conversion efficiency of 60% is<br />
applied to the delivered cost of gas to estimate the cost of thermal energy, which is preferably<br />
expressed <strong>in</strong> $/MWht by multiply<strong>in</strong>g $/GJ by 3.6.<br />
Clearly, the total cost of heat<strong>in</strong>g is much more than just the cost of fuel, although the other<br />
elements are always more difficult to establish. The operation and ma<strong>in</strong>tenance cost is the sum<br />
of many relatively m<strong>in</strong>or expenses, but also <strong>in</strong>cludes the time of the build<strong>in</strong>g operators and<br />
managers.<br />
7 Sproule forecast as of September 2011<br />
8 1 MMBtu = 1.055 GJ<br />
9 A hub <strong>in</strong> Alberta often used as a gas commodity price reference location<br />
24
TRCA Pearson Eco-Bus<strong>in</strong>ess Zone <strong>District</strong> <strong>Energy</strong> <strong>Feasibility</strong> <strong>Study</strong> 10 April 2012<br />
Provision for replacement capital is the most prone to debate, as it is derived from several<br />
parameters all of which are subject to question, (1) which equipment needs to be replaced, (2)<br />
when, (3) how much will it cost at that time, <strong>in</strong>clud<strong>in</strong>g escalation, and, (4) how much should be<br />
allowed each year to provide for that future outlay, given <strong>in</strong>terest rates expected to be earned by<br />
reserve fund <strong>in</strong>vestments.<br />
Cost Element<br />
Total Cost<br />
$ per year<br />
25<br />
Average Unit<br />
<strong>Energy</strong> Cost<br />
$/MWht<br />
% of total<br />
Fuel $1,371,800 $48.81 65%<br />
Operation and Ma<strong>in</strong>tenance $260,200 $9.26 12%<br />
Provision for Replacement Capital $487,000 $17.33 23%<br />
Total $2,119,000 $75.40 100%<br />
Table 7 BaU Cost Summary<br />
The BaU cost of this group of customers is lower that it would be for new build<strong>in</strong>gs, as the<br />
customers have already made <strong>in</strong>vestments <strong>in</strong> heat<strong>in</strong>g equipment. The overall system revenue<br />
prospect would be improved to the extent any new development is planned on one or more of<br />
the three development parcels; specifically, those parcels that are near the DPS route, as<br />
shown <strong>in</strong> Figure 2, on the north side of Airport Road, just west of Highway 409, currently used<br />
by Park n’ Fly and two on the east side of Carl<strong>in</strong>gview, just north of Dixon, <strong>in</strong>clud<strong>in</strong>g the site of<br />
the former Regal Constellation Hotel.<br />
The positive impact of a major new development might be such as to trigger reconsideration of<br />
this DES project should it have been shelved <strong>in</strong> the meantime.<br />
5.2 Conceptual DES Cost Estimates<br />
Conceptual capital costs have been developed for each of the three DES sub-systems based on<br />
FVB’s cost database from recent, similar projects for heat<strong>in</strong>g and cool<strong>in</strong>g.<br />
DPS and ETS capital cost estimates for Phases 1, 2 and 3 for heat<strong>in</strong>g and cool<strong>in</strong>g were<br />
provided <strong>in</strong> the mid-project review Technical Memo, which is attached to this report <strong>in</strong> Appendix<br />
I. These estimates were theoretical because of <strong>in</strong>complete knowledge about prospective<br />
customers, and particularly low expectations of the prospects for sell<strong>in</strong>g cool<strong>in</strong>g to this set of<br />
customers. They already have cool<strong>in</strong>g systems <strong>in</strong>stalled and district cool<strong>in</strong>g is ma<strong>in</strong>ly a capital<br />
play <strong>in</strong> Canada, not an energy play.<br />
A condensed summary of the DES capital costs for heat<strong>in</strong>g only <strong>in</strong> Phase 1 is given <strong>in</strong> Table 8<br />
with further breakdown <strong>in</strong> follow<strong>in</strong>g subsections. All estimates are <strong>in</strong> 2011 dollars. These<br />
estimates are made us<strong>in</strong>g FVB’s proprietary DES cost<strong>in</strong>g models that are regularly updated with<br />
actual costs from recent construction work awarded or completed.<br />
System Capital Cost Estimate M$
TRCA Pearson Eco-Bus<strong>in</strong>ess Zone <strong>District</strong> <strong>Energy</strong> <strong>Feasibility</strong> <strong>Study</strong> 10 April 2012<br />
Build<strong>in</strong>g Modifications (11 build<strong>in</strong>gs) 1.1<br />
<strong>Energy</strong> Transfer Stations (11, totall<strong>in</strong>g 14 MWt) 2.5<br />
Distribution Pipe System (3.2 trench km, 14 MWt) 7.8<br />
<strong>Energy</strong> Centre (without CHP) (16 MWt HW Boilers) 5.9<br />
Total Phase 1 DES (without CHP) 17.3<br />
CHP Facility (4 MWe/4MWt) 10.9<br />
Total Phase 1 DES (with CHP) 28.2<br />
5.2.1 <strong>Energy</strong> Transfer Stations<br />
Table 8 Capital Cost Estimate Summary<br />
Tables 9 and 10 provide conceptual cost estimates for the ETS and service pip<strong>in</strong>g to supply<br />
heat<strong>in</strong>g to Phase 1A and the balance of Phase 1.<br />
Pearson Eco Bus<strong>in</strong>ess Zone - ETS Cost Estimate Heat<strong>in</strong>g<br />
Phase 1A ($)<br />
4800 kW of heat<strong>in</strong>g<br />
Owner Supplied<br />
Heat Exchangers $117,000<br />
Isolation Valves $18,300<br />
Controls & Meter<strong>in</strong>g $153,800<br />
Additional Primary & Secondary Pip<strong>in</strong>g Modifications $0<br />
Owner Supplied Subtotal $289,100<br />
Contractor Supplied<br />
Mechanical & Electrical Material and Installation $519,900<br />
Contractor Supplied Subtotal $519,900<br />
Construction Soft Costs<br />
General Contractor Overhead and Profit Included<br />
Construction Management and Supervision 4% $32,400<br />
Prov<strong>in</strong>cial Sales Tax 0% $0<br />
Goods & Services Tax 0% $0<br />
Harmonized Sales Tax 13% $105,200<br />
Subtotal Construction $137,600<br />
Owner's Soft Costs<br />
Eng<strong>in</strong>eer<strong>in</strong>g (Design, Construction and Commission<strong>in</strong>g Support) 15% $142,000<br />
Cont<strong>in</strong>gency 10% $94,700<br />
Subtotal Owner's Soft Costs $236,700<br />
Table 9 CCE for ETS Phase 1A<br />
Total ETS Cost (w/o Taxes) $1,078,100<br />
Total ETS Cost (w/ Taxes) $1,183,300<br />
26
TRCA Pearson Eco-Bus<strong>in</strong>ess Zone <strong>District</strong> <strong>Energy</strong> <strong>Feasibility</strong> <strong>Study</strong> 10 April 2012<br />
Pearson Eco Bus<strong>in</strong>ess Zone - ETS Cost Estimate Heat<strong>in</strong>g<br />
Balance fo Phase 1 ($)<br />
9,000 kW of heat<strong>in</strong>g<br />
Owner Supplied<br />
Heat Exchangers $114,700<br />
Isolation Valves $23,200<br />
Controls & Meter<strong>in</strong>g $136,300<br />
Additional Primary & Secondary Pip<strong>in</strong>g Modifications $0<br />
Owner Supplied Subtotal $274,200<br />
Contractor Supplied<br />
Mechanical & Electrical Material and Installation $644,900<br />
Contractor Supplied Subtotal $644,900<br />
Construction Soft Costs<br />
General Contractor Overhead and Profit Included<br />
Construction Management and Supervision 4% $36,800<br />
Prov<strong>in</strong>cial Sales Tax 0% $0<br />
Goods & Services Tax 0% $0<br />
Harmonized Sales Tax 13% $119,500<br />
Subtotal Construction $156,300<br />
Owner's Soft Costs<br />
Eng<strong>in</strong>eer<strong>in</strong>g (Design, Construction and Commission<strong>in</strong>g Support) 15% $161,300<br />
Cont<strong>in</strong>gency 10% $107,500<br />
Table 10 CCE for ETS Balance of Phase 1<br />
Subtotal Owner's Soft Costs $268,800<br />
The follow<strong>in</strong>g notes relate to the ETS capital cost estimates.<br />
1.<br />
2.<br />
3.<br />
4.<br />
5.<br />
6.<br />
7.<br />
8.<br />
9.<br />
10.<br />
11.<br />
Notes:<br />
Total ETS Cost (w/o Taxes) $1,224,700<br />
Total ETS Cost (w/ Taxes) $1,344,200<br />
ETS Costs reflects primary side with secondary side modification EXCLUDED. 1 ETS per build<strong>in</strong>g<br />
Pric<strong>in</strong>g assumes sufficient floor space <strong>in</strong> a ground or basement level mechanical room and limits the ETS<br />
location to a maximum of 10 m. from an outside wall.<br />
The cost estimates provided are Class C and thus are prelim<strong>in</strong>ary.<br />
Pric<strong>in</strong>g reflects 1 heat exchanger at 120% for heat<strong>in</strong>g and 1 heat exchanger for DHW and cool<strong>in</strong>g respectively.<br />
Pric<strong>in</strong>g reflects a comb<strong>in</strong>ed commercial control system and meter<strong>in</strong>g.<br />
ETS Cost reflects an <strong>in</strong>-direct connection based on 30°C district heat<strong>in</strong>g differential temperature.<br />
ETS Cost reflects an <strong>in</strong>-direct connection based on 8.3°C district cool<strong>in</strong>g differenital temperature.<br />
Pric<strong>in</strong>g is based on calculated peak loads for heat<strong>in</strong>g as shown <strong>in</strong> the load table.<br />
Estimate of 13% HST <strong>in</strong>cluded <strong>in</strong> prelim<strong>in</strong>ary capital costs.<br />
Communication cable, material and <strong>in</strong>stallation from ma<strong>in</strong>l<strong>in</strong>e <strong>in</strong> street to build<strong>in</strong>g wall not <strong>in</strong>cluded <strong>in</strong> pric<strong>in</strong>g.<br />
No cost allowance for secondary modifications/pipe risers to boiler rooms.<br />
12. Airway Centre is consideredto be comprised of four (4) build<strong>in</strong>gs (4 ETSs).<br />
5.2.2 Distribution Pip<strong>in</strong>g System<br />
Tables 11 and 12 below provide conceptual cost estimates for the DPS for Phase 1A and the<br />
rest of Phase 1.<br />
27
TRCA Pearson Eco-Bus<strong>in</strong>ess Zone <strong>District</strong> <strong>Energy</strong> <strong>Feasibility</strong> <strong>Study</strong> 10 April 2012<br />
Distribution Pip<strong>in</strong>g<br />
28<br />
Heat<strong>in</strong>g<br />
Mechanical - Material & Installation 1,950 m $1,740,000<br />
Civil - Excavation, Backfill & Re<strong>in</strong>statement 1,950 m $1,451,000<br />
Construction Soft Costs<br />
($)<br />
DPS Subtotal $3,191,000<br />
Contractor Adm<strong>in</strong>., Bond<strong>in</strong>g, Insurance & OH&P 15.0% $479,000<br />
Construction Management & Supervision 3.0% $96,000<br />
Construction Change Allowance 2.0% $64,000<br />
Prov<strong>in</strong>cial Sales Tax 0.0% $0<br />
Goods & Services Tax 0.0% $0<br />
Harmonized Sales Tax 13.0% $415,000<br />
Owner's Soft Costs<br />
Phase 1A:<br />
Construction Soft Costs Subtotal $1,054,000<br />
Eng<strong>in</strong>eer<strong>in</strong>g (Design & Construction Support) 8.0% $340,000<br />
Cont<strong>in</strong>gency (Design & Pric<strong>in</strong>g) 10.0% $424,000<br />
Table 11 CC for DPS Phase 1A<br />
Owner's Soft Costs Subtotal $764,000<br />
Phase 1 DPS Total $5,009,000<br />
Phase 1 DPS Total w/o taxes $4,594,000
TRCA Pearson Eco-Bus<strong>in</strong>ess Zone <strong>District</strong> <strong>Energy</strong> <strong>Feasibility</strong> <strong>Study</strong> 10 April 2012<br />
Distribution Pip<strong>in</strong>g<br />
29<br />
Heat<strong>in</strong>g<br />
Mechanical - Material & Installation 1,240 m $922,000<br />
Civil - Excavation, Backfill & Re<strong>in</strong>statement 1,240 m $841,000<br />
Construction Soft Costs<br />
($)<br />
DPS Subtotal $1,763,000<br />
Contractor Adm<strong>in</strong>., Bond<strong>in</strong>g, Insurance & OH&P 15.0% $264,000<br />
Construction Management & Supervision 3.0% $53,000<br />
Construction Change Allowance 2.0% $35,000<br />
Prov<strong>in</strong>cial Sales Tax 0.0% $0<br />
Goods & Services Tax 0.0% $0<br />
Harmonized Sales Tax 13.0% $229,000<br />
Owner's Soft Costs<br />
Balance of Phase 1:<br />
Construction Soft Costs Subtotal $581,000<br />
Eng<strong>in</strong>eer<strong>in</strong>g (Design & Construction Support) 8.0% $188,000<br />
Cont<strong>in</strong>gency (Design & Pric<strong>in</strong>g) 10.0% $234,000<br />
Table 12 CCE for DPS Balance of Phase 1<br />
Owner's Soft Costs Subtotal $422,000<br />
Phase 2 DPS Total $2,766,000<br />
Phase 2 DPS Total w/o taxes $2,537,000<br />
The follow<strong>in</strong>g notes relate to the DPS capital cost estimates.<br />
Notes:<br />
1) Shor<strong>in</strong>g trench box allowance <strong>in</strong>cluded for trenches deeper than 1.2 m.<br />
2) Trench depth allows for 1200 mm cover to top of pipe.<br />
3) Cost per meter <strong>in</strong>cludes material supply, mechanical <strong>in</strong>stallation and all civil works. No allowance for offsite<br />
haulage/U-fill backfill.<br />
4) Price <strong>in</strong>cludes for supply and return l<strong>in</strong>es.<br />
5) Mechanical and civil costs <strong>in</strong>clude allowance for mobilization, specialist subcontractors, bond<strong>in</strong>g and <strong>in</strong>surance.<br />
6) Cost does not <strong>in</strong>clude soil remediation or costs related to obta<strong>in</strong><strong>in</strong>g right-of-ways/easements etc.<br />
7) Estimate provided is prelim<strong>in</strong>ary and based on FVB draw<strong>in</strong>gs.<br />
5.2.3 <strong>District</strong> <strong>Energy</strong> Centre<br />
Table 13 provides a conceptual cost estimate for the standalone heat<strong>in</strong>g plant, <strong>in</strong>clud<strong>in</strong>g CHP.
TRCA Pearson Eco-Bus<strong>in</strong>ess Zone <strong>District</strong> <strong>Energy</strong> <strong>Feasibility</strong> <strong>Study</strong> 10 April 2012<br />
PPG - Standalone DE plant<br />
Phase I<br />
<strong>Energy</strong> Centre Per Service Installed Totals<br />
Capacity ($)<br />
CHP Genset<br />
Architectural/Civil/Structural 215 m2 $436,000<br />
Electrical Installation 5,529 kVA $2,326,000<br />
Mechanical Installation $2,292,000<br />
Major Equipment $3,277,000<br />
Contractor's Adm<strong>in</strong>, OH&P, etc. $795,000<br />
Subtotal Construction $9,126,000<br />
Soft Costs<br />
Eng<strong>in</strong>eer<strong>in</strong>g $895,000<br />
Cont<strong>in</strong>gency $913,000<br />
Soft Costs $1,808,000<br />
TOTAL - CHP $10,934,000<br />
Heat<strong>in</strong>g Plant<br />
Architectural/Civil/Structural 444 m2 $1,074,000<br />
Electrical Installation $487,000<br />
Mechanical Installation $1,657,000<br />
Major Equipment $1,224,000<br />
GC Adm i n, OH&P & PST $463,000<br />
Subtotal Construction $4,905,000<br />
Soft Costs<br />
Desi gn $515,000<br />
Cont<strong>in</strong>gency $491,000<br />
Soft Costs $1,006,000<br />
TOTAL - Heat<strong>in</strong>g Plant $5,911,000<br />
Table 13 CCE for <strong>Energy</strong> Centre, <strong>in</strong>clud<strong>in</strong>g CHP<br />
5.3 F<strong>in</strong>ancial <strong>Project</strong>ions<br />
<strong>Project</strong>ions of capital expenditures and revenue and expenses are documented <strong>in</strong> the form of<br />
pro formal f<strong>in</strong>ancial statements <strong>in</strong> Appendix H and the project viability implications and<br />
sensitivities are discussed more fully <strong>in</strong> Section 8, Bus<strong>in</strong>ess Model Report.<br />
5.4 Social Analysis<br />
The development of a district energy system is more capital <strong>in</strong>tensive than the bus<strong>in</strong>ess as<br />
usual alternative, most of which will stay with<strong>in</strong> the local economy. The proposed system also<br />
<strong>in</strong>cludes the local generation of electricity through the CHP which will avoid the payment for<br />
electricity that is generated and distributed from outside the local economy. The net present<br />
value of the district energy system to the local economy is estimated to be $15 million from the<br />
construction of the system and a further $26 million <strong>in</strong> avoided spend<strong>in</strong>g on energy from outside<br />
of the local economy evaluated over a 30-year time frame.<br />
30
TRCA Pearson Eco-Bus<strong>in</strong>ess Zone <strong>District</strong> <strong>Energy</strong> <strong>Feasibility</strong> <strong>Study</strong> 10 April 2012<br />
5.5 Environmental Analysis<br />
The greenhouse gas emission reductions as a result of generat<strong>in</strong>g heat for the designated<br />
Phase 1 build<strong>in</strong>gs <strong>in</strong> more efficient boilers by the DES is estimated to be 2,300 tonnes per year<br />
without CHP and 3,600 tonnes per year with CHP, assum<strong>in</strong>g 2,200 run hours per year for the<br />
CHP Facility.<br />
The reduction achievable with CHP would be higher <strong>in</strong> the event market conditions allow for<br />
more run hours.<br />
The estimates of greenhouse gas emissions with CHP allow noth<strong>in</strong>g for possible displacement<br />
of higher emitt<strong>in</strong>g central electricity generat<strong>in</strong>g technologies. The estimate simply assumes that<br />
a mix of generat<strong>in</strong>g technologies would be displaced hav<strong>in</strong>g approximately equivalent<br />
greenhouse gas emissions per unit of electricity delivered to the same po<strong>in</strong>t on the distribution<br />
system (tak<strong>in</strong>g <strong>in</strong>to account losses) as the CHP Facility. This is an imprecise assumption, and<br />
possibly conservative; a different protocol for this calculation could be used, but its validity<br />
would be questionable due to a fundamental lack of empirical data.<br />
This protocol is used <strong>in</strong> view of uncerta<strong>in</strong>ties created by the evolution of the electricity supply<br />
mix, e.g. planned shut-down of coal-fired generat<strong>in</strong>g stations <strong>in</strong> Ontario. Whereas <strong>in</strong> previous<br />
years the percentage of hours that coal-fired generat<strong>in</strong>g stations acted as the marg<strong>in</strong>al resource<br />
could be gauged from reports of the OEB Market Surveillance Panel this source of <strong>in</strong>formation<br />
will no longer be directly useful <strong>in</strong> that way. It is believed that grid electricity will long cont<strong>in</strong>ue to<br />
be based on coal at the marg<strong>in</strong> due to the <strong>in</strong>terconnection of Ontario with neighbour<strong>in</strong>g States.<br />
However, as yet it is not obvious how this could be quantified for the purpose of greenhouse gas<br />
reduction calculations.<br />
6 Ownership and Operational Structure<br />
6.1 Possible Ownership Models for DES Development <strong>in</strong> Pearson Area<br />
This section discusses characteristics of possible ownership models for development of a DES<br />
<strong>in</strong> the Pearson Eco-Bus<strong>in</strong>ess Zone:<br />
Precedents and lessons from recent Canadian experience<br />
The potential role of the municipalities<br />
The potential role of the GTAA<br />
The potential role of Enbridge<br />
There are likely other DE opportunities <strong>in</strong> the Pearson Eco-Bus<strong>in</strong>ess Zone, whose chances for<br />
serious consideration would be improved if an <strong>in</strong>itial DES could be successfully developed <strong>in</strong> the<br />
area under consideration <strong>in</strong> this study.<br />
The comments <strong>in</strong> this report are <strong>in</strong>tended, <strong>in</strong> pr<strong>in</strong>ciple, to apply to any possible scenarios<br />
regard<strong>in</strong>g these other opportunities:<br />
A s<strong>in</strong>gle DES utility <strong>in</strong> all locations<br />
One DES utility for some of the sites and separate entities for others<br />
Separate DE utilities for all sites<br />
31
TRCA Pearson Eco-Bus<strong>in</strong>ess Zone <strong>District</strong> <strong>Energy</strong> <strong>Feasibility</strong> <strong>Study</strong> 10 April 2012<br />
6.2 Precedents and Lessons from Recent Canadian Experience<br />
Appendix J summarizes research <strong>in</strong>to the Canadian experience of DES. The research shows<br />
that municipalities have played a key role <strong>in</strong> all utility DES started <strong>in</strong> Canada over the past two<br />
decades, <strong>in</strong>clud<strong>in</strong>g total or majority ownership <strong>in</strong> most.<br />
There are several precedents for a separate DES corporation that could potentially be owned by<br />
the City of Mississauga, the Region of Peel or the City of Toronto, possibly with a m<strong>in</strong>ority<br />
operat<strong>in</strong>g partner and with fund<strong>in</strong>g assistance from senior levels of government. S<strong>in</strong>ce the<br />
study area straddles Mississauga and Toronto, perhaps a partnership of the two cities would be<br />
appropriate, or the Region of Peel and Toronto. Consultations should also be held with<br />
Enersource Hydro Mississauga and Enbridge.<br />
It is less likely, although possible, that other parties could play a larger role <strong>in</strong> develop<strong>in</strong>g DE <strong>in</strong><br />
the Pearson Area. Regardless of which party eventually takes the lead role <strong>in</strong> develop<strong>in</strong>g the<br />
DES, further progress <strong>in</strong> project def<strong>in</strong>ition will be required and <strong>Partners</strong> <strong>in</strong> <strong>Project</strong> <strong>Green</strong> may be<br />
the most suitable vehicle to manage that work on behalf of the owner (but it will be important for<br />
customer confidence that there is an owner!).<br />
The most important step would be to hold further consultations with potential customers and<br />
with land owners of potential new development sites and with the local utilities. These would all<br />
be stakeholders, even if not owners. The possible <strong>in</strong>volvement of local DES operators<br />
(Enwave, Corix or Markham <strong>District</strong> <strong>Energy</strong>) may also be explored.<br />
Leadership by a local champion will be necessary to launch the DES; <strong>in</strong>terest from a broader<br />
range of potential participants will tend to <strong>in</strong>crease as each project becomes well def<strong>in</strong>ed and<br />
especially follow<strong>in</strong>g commencement of operation.<br />
6.3 Potential Role of Municipalities<br />
Regardless of ownership <strong>in</strong>volvement, the Municipalities would have an important role <strong>in</strong><br />
plann<strong>in</strong>g and approvals for DE. For effective implementation the cities and Region must assist<br />
<strong>in</strong> the coord<strong>in</strong>ation of the underground pip<strong>in</strong>g distribution system with other <strong>in</strong>frastructure. The<br />
City will also have <strong>in</strong>put on the site plan for the <strong>Energy</strong> Centre. It may also be of mutual benefit<br />
for the DES to collaborate on fuel procurement with the cities, Region and GTAA.<br />
The location of the <strong>Energy</strong> Centres will be key decisions that the Municipalities can control<br />
through plann<strong>in</strong>g approvals. Distribution pipe should be run ma<strong>in</strong>ly <strong>in</strong> the Municipal right of way<br />
and meet Municipal requirements <strong>in</strong> coord<strong>in</strong>ation with other <strong>in</strong>frastructure. Even the energy<br />
transfer stations <strong>in</strong> build<strong>in</strong>gs would be a po<strong>in</strong>t of <strong>in</strong>terest for Municipal build<strong>in</strong>g permit approvals<br />
as Municipal staff must be satisfied with the heat sources for build<strong>in</strong>gs.<br />
In fact, it is likely that development of a true DE utility will need significant leadership from<br />
Municipalities, which may <strong>in</strong>volve tak<strong>in</strong>g an ownership position, especially <strong>in</strong> the early stages.<br />
6.3.1 Recommended Involvement of Municipalities<br />
Recommended <strong>in</strong>volvement of the municipalities may <strong>in</strong>clude:<br />
1) Initiation<br />
Incorporation of the DE utility to create an identifiable entity that prospective customers can<br />
recognize as their future energy supplier<br />
Develop a detailed bus<strong>in</strong>ess plan to support procurement of private partners<br />
32
TRCA Pearson Eco-Bus<strong>in</strong>ess Zone <strong>District</strong> <strong>Energy</strong> <strong>Feasibility</strong> <strong>Study</strong> 10 April 2012<br />
Secure Memoranda of Understand<strong>in</strong>g (MOU) with prospective customers that may help attract<br />
private <strong>in</strong>terest <strong>in</strong> the DE utility<br />
F<strong>in</strong>d an effective private owner/operators for the DE utility through a competitive process, preferably<br />
after an attractive opportunity has been def<strong>in</strong>ed, the offer <strong>in</strong> the RFP might <strong>in</strong>clude municipal share<br />
of risk and promises of senior government fund<strong>in</strong>g (e.g. Infrastructure Ontario, Build Canada, FCM)<br />
2) Susta<strong>in</strong><strong>in</strong>g<br />
Market DE as a desirable feature of the area<br />
Require that new build<strong>in</strong>gs <strong>in</strong> the area be at least DE compatible (central hydronic heat<strong>in</strong>g and<br />
cool<strong>in</strong>g with ground level connections, low <strong>in</strong>ternal supply temperature and high ∆T)<br />
Mandatory connection for new build<strong>in</strong>gs should be viewed with caution as it has rate regulation<br />
implications; i.e. if connection is mandated, how can fair rates be ensured?<br />
Consider density bonus<strong>in</strong>g for new build<strong>in</strong>gs (developers allowed more height if connected to DE)<br />
The Municipalities could develop a DES utility through a subsidiary corporation <strong>in</strong> a similar way<br />
that the Town of Markham owns Markham <strong>District</strong> <strong>Energy</strong>. A corporation is the recommended<br />
governance model to signal clear legal ability to conduct bus<strong>in</strong>ess <strong>in</strong>clud<strong>in</strong>g enter<strong>in</strong>g long-term<br />
contracts, negotiat<strong>in</strong>g bus<strong>in</strong>ess partnerships and <strong>in</strong>curr<strong>in</strong>g debt.<br />
The capital structure would be detailed follow<strong>in</strong>g further def<strong>in</strong>ition of project scope and tim<strong>in</strong>g. It<br />
would probably <strong>in</strong>clude equity and possibly loans from the Municipalities and/or partners as well<br />
as grants and loans from senior levels of government.<br />
Capital<br />
Cash flow management dur<strong>in</strong>g the early stages of a DE project can be made easier under<br />
municipal ownership by grants and favourable loans, e.g. through the Federation of Canadian<br />
Municipalities and Build<strong>in</strong>g Canada Plan. These grants and favourable loans can bridge the<br />
f<strong>in</strong>anc<strong>in</strong>g gap between what is generally needed for a DE start-up and what might be<br />
reasonably available on a commercial basis. Grants and other assistance for <strong>in</strong>frastructure<br />
construction are generally more available for projects with municipal ownership.<br />
Part of the orig<strong>in</strong>al capital commitment could be recoverable from contracted revenue from the<br />
first customer(s) that trigger(s) the need for construction to start. Construction should not be<br />
planned until there is a significant customer commitment. The balance would be at risk pend<strong>in</strong>g<br />
commitments from additional customers. This risk has been faced by all DES serv<strong>in</strong>g new<br />
development areas as a large up-front <strong>in</strong>vestment must be dedicated to meet the needs of the<br />
first customer without know<strong>in</strong>g how long it will take to sell the rema<strong>in</strong><strong>in</strong>g capacity. The risk can<br />
be explored with sensitivity analysis and the results shared with potential partners and lenders<br />
dur<strong>in</strong>g the course of detailed bus<strong>in</strong>ess plann<strong>in</strong>g and consultations.<br />
Operations<br />
Operation of the DES could be contracted out but it would be preferable to have a private<br />
partner br<strong>in</strong>g the required DE operat<strong>in</strong>g and management skills. As owners, they would be<br />
expected to operate efficiently and the <strong>in</strong>vestment would be more attractive for them.<br />
S<strong>in</strong>ce operations is a significant fixed cost it is often found that the early cash flow of a DES is<br />
greatly improved if the DES can be “bolted on” to an exist<strong>in</strong>g operation and thereby avoid the<br />
<strong>in</strong>cremental cost of establish<strong>in</strong>g a new operat<strong>in</strong>g organization.<br />
33
TRCA Pearson Eco-Bus<strong>in</strong>ess Zone <strong>District</strong> <strong>Energy</strong> <strong>Feasibility</strong> <strong>Study</strong> 10 April 2012<br />
<strong>Partners</strong>hips<br />
The contrast<strong>in</strong>g experiences of Waterfront Toronto and TCHC suggest that the chances of<br />
successfully develop<strong>in</strong>g a partnership are improved with more project def<strong>in</strong>ition. Such<br />
def<strong>in</strong>itions could be made under the auspices of the <strong>Partners</strong> <strong>in</strong> <strong>Project</strong> <strong>Green</strong> and/or the<br />
Municipalities prior to <strong>in</strong>corporation. Alternately, a corporation could be created <strong>in</strong>itially with<br />
Municipalities as the sole owners but allow<strong>in</strong>g for later entry of other participants.<br />
At some stage <strong>in</strong> its development the DES will become capable of operat<strong>in</strong>g without<br />
government assistance. It may atta<strong>in</strong> a de facto monopoly for heat<strong>in</strong>g as it may have become<br />
uneconomic to <strong>in</strong>stall additional gas distribution <strong>in</strong>frastructure <strong>in</strong> the some of the new DE<br />
development parcels. At that time, the Municipalities would have the option of reta<strong>in</strong><strong>in</strong>g<br />
ownership <strong>in</strong>terest as a source of revenue or tak<strong>in</strong>g out some or all of the equity.<br />
6.3.2 Opportunities for Municipalities to Provide Services<br />
DE plann<strong>in</strong>g, eng<strong>in</strong>eer<strong>in</strong>g and market<strong>in</strong>g services are specialized activities and would probably<br />
be looked after by a comb<strong>in</strong>ation of dedicated DES staff and consultants.<br />
The Municipalities could provide all the usual adm<strong>in</strong>istrative services to the DES (legal, human<br />
resources, account<strong>in</strong>g, procurement, accounts receivable etc). Whereas this might be helpful to<br />
the DES, it would only be a m<strong>in</strong>or source of revenue for the Municipalities, s<strong>in</strong>ce the size of DES<br />
envisioned <strong>in</strong> Phase 1 would not be a large bus<strong>in</strong>ess relative to the Municipality itself. The ma<strong>in</strong><br />
expenses of a DES are typically for <strong>in</strong>put energy and debt service, not adm<strong>in</strong>istration.<br />
Natural gas procurement may be an area where synergies could be useful as the relatively high<br />
volume of exist<strong>in</strong>g supply contracts to the Municipalities may support gas consultants and gas<br />
management strategies. These contracts could benefit the DES, especially dur<strong>in</strong>g its early<br />
stages of development while its own volume requirements would be low. Conversely, <strong>in</strong> the<br />
longer-term, the DES may consume a significant volume especially if gas fired CHP is used and<br />
then the Municipalities may benefit from jo<strong>in</strong>t gas procurement with the DES. At some time, bioenergy<br />
may be sourced from Municipalities waste management programs.<br />
6.4 Potential Role of GTAA<br />
The GTAA may play a role as energy supplier. S<strong>in</strong>ce this is not the core bus<strong>in</strong>ess of the GTAA<br />
it would probably prefer a support<strong>in</strong>g rather than a leadership role <strong>in</strong> the project. The DES must<br />
become established without assistance from the GTAA.<br />
6.5 Potential Role of Enbridge<br />
The bus<strong>in</strong>ess model for most district energy systems started <strong>in</strong> Canada is based on long-term<br />
contracts. DE service pric<strong>in</strong>g <strong>in</strong> British Columbia (BC) is based on rate regulation. Enbridge is<br />
<strong>in</strong>terested <strong>in</strong> <strong>in</strong>vest<strong>in</strong>g <strong>in</strong> DE under a regulated price model. If regulation should materialize,<br />
Enbridge may be a potential partner. Consequently the DES may have the option of be<strong>in</strong>g<br />
grand-fathered <strong>in</strong> the traditional long-term contract model or transition to the regulated model.<br />
6.6 DE Utility Regulation<br />
Rate regulation is a feature of the DE <strong>in</strong>dustry <strong>in</strong> BC. Regulation could be a net positive<br />
development for the prospects of DE development. This is based on the reasonable<br />
assumptions that regulation would only occur:<br />
If there was a concrete example where a proponent lobbied for it<br />
34
TRCA Pearson Eco-Bus<strong>in</strong>ess Zone <strong>District</strong> <strong>Energy</strong> <strong>Feasibility</strong> <strong>Study</strong> 10 April 2012<br />
The regulatory rules were favourable for <strong>in</strong>vestment<br />
If any exist<strong>in</strong>g DES will have the option of be<strong>in</strong>g grand-fathered out<br />
Private <strong>in</strong>vestment should not be discouraged by regulation because a utility rate of return is<br />
only what should be expected for DE anyway. Enbridge, Corix Utilities and others accustomed<br />
to work<strong>in</strong>g <strong>in</strong> regulated environments might be encouraged to commit substantial up-front<br />
<strong>in</strong>vestment <strong>in</strong> DE development, result<strong>in</strong>g <strong>in</strong> an overall positive economic impact <strong>in</strong> the Pearson<br />
Eco-Bus<strong>in</strong>ess Zone. So this possibility should not be discouraged but neither should it be relied<br />
on.<br />
7 Risk, Regulatory & F<strong>in</strong>anc<strong>in</strong>g Issues<br />
7.1 Risk Management Plan<br />
7.1.1 Introduction<br />
The follow<strong>in</strong>g sections of the report outl<strong>in</strong>e risks <strong>in</strong>volved <strong>in</strong> development of <strong>District</strong> <strong>Energy</strong> (DE)<br />
and recommend mitigation strategies.<br />
Certa<strong>in</strong> risks with respect to plann<strong>in</strong>g, safety and the environment can be mitigated simply<br />
through compliance with By-Laws or regulations. Others related to CHP depend on a detailed<br />
understand<strong>in</strong>g of regulations as well as market rules. Therefore, understand<strong>in</strong>g of applicable<br />
regulations is an <strong>in</strong>tegral part of the overall risk management plan which is an essential<br />
component of the bus<strong>in</strong>ess plan for DE development.<br />
The various risks and related regulations are discussed below generally <strong>in</strong> the sequence <strong>in</strong><br />
which they are commonly encountered dur<strong>in</strong>g the course of DE project development:<br />
Plann<strong>in</strong>g<br />
Market<strong>in</strong>g<br />
Contracts and Pric<strong>in</strong>g<br />
Safety<br />
Certificate of Approval<br />
Environmental Assessments – Prov<strong>in</strong>cial and Federal<br />
Other CHP Related Approvals and Issues<br />
Design<br />
Construction<br />
Operations<br />
7.1.2 Plann<strong>in</strong>g<br />
DE developers need to know that they will be able to obta<strong>in</strong> plann<strong>in</strong>g approvals required to<br />
implement a proposed project, and the expected timel<strong>in</strong>e. The follow<strong>in</strong>g discussion highlights<br />
the key items that should be understood.<br />
Zon<strong>in</strong>g<br />
The zon<strong>in</strong>g By-Law dictates land use. For any location, an <strong>Energy</strong> Centre (EC) may or may not<br />
be permitted and there may be restrictions, such as on the height of a stack or on outside<br />
storage (which could impact a biomass project).<br />
Whether an EC is regarded as an “<strong>in</strong>dustrial use” can depend on local practice or decisions.<br />
Industrial uses are sometimes not permitted <strong>in</strong> areas that <strong>in</strong>clude the type of build<strong>in</strong>gs that are<br />
good candidates for DE service, i.e. multi-storey office and multi-unit residential build<strong>in</strong>gs.<br />
35
TRCA Pearson Eco-Bus<strong>in</strong>ess Zone <strong>District</strong> <strong>Energy</strong> <strong>Feasibility</strong> <strong>Study</strong> 10 April 2012<br />
Conversely, <strong>in</strong>dustrially zoned areas often consist ma<strong>in</strong>ly of build<strong>in</strong>gs that are not good DE<br />
prospects, such as s<strong>in</strong>gle-storey warehouse type build<strong>in</strong>gs and big-box stores.<br />
When the technical concept for the EC has been developed advice from local plann<strong>in</strong>g experts<br />
will be needed to determ<strong>in</strong>e whether zon<strong>in</strong>g would permit the type of planned DE facility. If not<br />
permitted, the next issue would be the least cost and shortest route to secure compliance, e.g.<br />
request for a change to the zon<strong>in</strong>g By-Law, a m<strong>in</strong>or variance, f<strong>in</strong>d a different site or modify the<br />
technical concept.<br />
Clearly, this is a strategic issue that needs to be addressed <strong>in</strong> the feasibility study, soon after<br />
the technical concept has been developed sufficiently to allow draft<strong>in</strong>g a high-level description of<br />
the proposed EC.<br />
Development Permit and Build<strong>in</strong>g Permit<br />
The municipal plann<strong>in</strong>g process usually <strong>in</strong>cludes site control <strong>in</strong> the form of a Development<br />
Permit and a Build<strong>in</strong>g Permit.<br />
Obta<strong>in</strong><strong>in</strong>g a Development Permit usually requires a site layout show<strong>in</strong>g the locations of build<strong>in</strong>gs<br />
and their use, access to the site and the entry po<strong>in</strong>ts for utilities. Application for a Development<br />
Permit can and should be made soon after eng<strong>in</strong>eer<strong>in</strong>g has proceeded to the po<strong>in</strong>t where a<br />
reasonably stable site layout can be produced.<br />
A Build<strong>in</strong>g Permit would be required before construction can proceed on a new EC. This will<br />
typically require more detail on the design of the build<strong>in</strong>g than was required for the Development<br />
Permit. Application for a Build<strong>in</strong>g Permit should be made sometime dur<strong>in</strong>g the detail design<br />
process. Effective project schedul<strong>in</strong>g requires understand<strong>in</strong>g the time-l<strong>in</strong>es to obta<strong>in</strong> a Build<strong>in</strong>g<br />
Permit, as it may well be on the critical path.<br />
Municipal Consent/Right of Way Agreement<br />
The distribution systems of DES are most conveniently located <strong>in</strong> municipal rights-of-way and<br />
other government controlled land, thereby m<strong>in</strong>imiz<strong>in</strong>g the extent of easements from private land<br />
owners.<br />
An Access Agreement is required with the municipality. The municipality has the right to<br />
approve the <strong>in</strong>stallation of pip<strong>in</strong>g, its location and the method of construction. Procedures for<br />
approval, ma<strong>in</strong>tenance procedures and contacts are usually spelled out <strong>in</strong> a Municipal Access<br />
Agreement. The municipality may also levy an annual fee on the DES for use of the right-ofway.<br />
This fee is usually m<strong>in</strong>imal, but sometimes there is a provision that it can be <strong>in</strong>creased<br />
(e.g. if the City sees an opportunity to garner more revenue). The economics of DES cannot<br />
usually afford provid<strong>in</strong>g a significant revenue source for the municipality via a municipal access<br />
fee.<br />
Any pipe rout<strong>in</strong>g not on municipal road allowance would require easements or other similar<br />
property agreement with the private landowner, which could <strong>in</strong>troduce additional cost and<br />
delays.<br />
Consultation with municipal plann<strong>in</strong>g staff is recommended to ensure full understand<strong>in</strong>g of the<br />
process, timel<strong>in</strong>es and potential cost of obta<strong>in</strong><strong>in</strong>g a Municipal Access Agreement for the<br />
contemplated route of the thermal distribution system.<br />
36
TRCA Pearson Eco-Bus<strong>in</strong>ess Zone <strong>District</strong> <strong>Energy</strong> <strong>Feasibility</strong> <strong>Study</strong> 10 April 2012<br />
7.1.3 Market<strong>in</strong>g<br />
Overview of Market<strong>in</strong>g Risks<br />
After completion of a pre-feasibility or feasibility study and after hav<strong>in</strong>g made a decision to<br />
proceed to develop a new DES, market<strong>in</strong>g is generally the first project development activity.<br />
The degree of success <strong>in</strong> market<strong>in</strong>g will impact project def<strong>in</strong>ition and ultimately the detailed<br />
design.<br />
There are certa<strong>in</strong> risks that should be recognized and addressed as failure to achieve market<strong>in</strong>g<br />
objectives may br<strong>in</strong>g the development to a halt or if it cont<strong>in</strong>ues the f<strong>in</strong>ancial results would be<br />
unsatisfactory.<br />
Development of a DES is a capital <strong>in</strong>tensive undertak<strong>in</strong>g. The <strong>in</strong>itial capital required for an EC<br />
and the associated pip<strong>in</strong>g system is extremely high when compared to traditional systems. The<br />
<strong>in</strong>tent is to recover the <strong>in</strong>cremental capital costs from energy sav<strong>in</strong>gs. But if a DES isn’t<br />
marketed effectively the last<strong>in</strong>g benefits to customers, the build<strong>in</strong>gs and the environment may<br />
not materialize.<br />
This is a risk that is often underestimated by novices <strong>in</strong> DE. While DE is such a positive<br />
<strong>in</strong>itiative from an overall community energy efficiency perspective, it often suffers from be<strong>in</strong>g a<br />
low priority for a build<strong>in</strong>g owner. Provision of energy is usually a relatively small concern dur<strong>in</strong>g<br />
development of a large Class A build<strong>in</strong>g, e.g. as compared with sell<strong>in</strong>g space, obta<strong>in</strong><strong>in</strong>g<br />
f<strong>in</strong>anc<strong>in</strong>g, obta<strong>in</strong><strong>in</strong>g development approvals, negotiat<strong>in</strong>g construction contracts, meet<strong>in</strong>g<br />
deadl<strong>in</strong>es etc, and perhaps even more so <strong>in</strong> the build<strong>in</strong>g operation phase. There are many real<br />
or imag<strong>in</strong>ed barriers for DE to overcome <strong>in</strong> order to become accepted as the preferred energy<br />
solution by a developer or owner. One of the issues is simply the time required to make a<br />
decision and a commitment. Another issue is that it is difficult to guarantee a significant cost<br />
sav<strong>in</strong>g, which is what build<strong>in</strong>g developers and owners are most <strong>in</strong>terested <strong>in</strong> (they are not so<br />
much <strong>in</strong>terested <strong>in</strong> societal benefits).<br />
Some DES f<strong>in</strong>ance and construct system capacity only after receipt of signed customer<br />
contracts. Other systems move ahead based on letters of <strong>in</strong>tent. Yet other systems build<br />
capacity and then market it (this approach may be necessary <strong>in</strong> a green field situation). The<br />
approach taken depends on the f<strong>in</strong>ancial resources, bus<strong>in</strong>ess philosophy and risk tolerance of<br />
the owners. Mitigat<strong>in</strong>g market<strong>in</strong>g risks and the resultant impact on f<strong>in</strong>ancial performance is the<br />
first major risk decision to be made.<br />
Reduc<strong>in</strong>g Market<strong>in</strong>g Risks<br />
An important first step to reduc<strong>in</strong>g market<strong>in</strong>g risks is to properly target the potential customers<br />
who have the greatest likelihood of tak<strong>in</strong>g service. This entails an accurate understand<strong>in</strong>g of<br />
their avoidable costs relative to the costs of connection <strong>in</strong>clud<strong>in</strong>g any modifications to the<br />
<strong>in</strong>ternal build<strong>in</strong>g systems. By committ<strong>in</strong>g early, new development will avoid the considerable<br />
<strong>in</strong>itial capital required for construction of heat<strong>in</strong>g and cool<strong>in</strong>g equipment systems. Retrofit<br />
situations are more complicated, be<strong>in</strong>g related to the age and condition of exist<strong>in</strong>g heat<strong>in</strong>g or<br />
cool<strong>in</strong>g equipment as <strong>in</strong>dicators for future avoidance of capital replacement.<br />
An attractive market<strong>in</strong>g risk mitigation strategy is to undertake an <strong>in</strong>tense “kick-off” campaign to<br />
sign up customers. This is most useful where a large number of customers are anticipated.<br />
This strategy uses communications, advertis<strong>in</strong>g and public relations to build market<strong>in</strong>g<br />
momentum. This strategy has been used successfully by some of the newest downtown DES.<br />
37
TRCA Pearson Eco-Bus<strong>in</strong>ess Zone <strong>District</strong> <strong>Energy</strong> <strong>Feasibility</strong> <strong>Study</strong> 10 April 2012<br />
Another strategy is to obta<strong>in</strong> contracts from one or two anchor customers prior to proceed<strong>in</strong>g<br />
with construction. In the case of some retro-fit situations, these anchor contracts may need to<br />
have pric<strong>in</strong>g that provides less than target returns. This strategy reduces the overall f<strong>in</strong>ancial<br />
risk by secur<strong>in</strong>g some revenue prior to project commencement but may <strong>in</strong>crease the risk of not<br />
obta<strong>in</strong><strong>in</strong>g target returns. The anchor customers should be carefully chosen for their ability to<br />
<strong>in</strong>fluence the rema<strong>in</strong><strong>in</strong>g potential customers. This strategy works best when the <strong>in</strong>cremental<br />
cost of serv<strong>in</strong>g new customers is less than the cost of serv<strong>in</strong>g the anchor customers (which is<br />
often the case because additional branch l<strong>in</strong>es and energy transfer stations need relatively<br />
m<strong>in</strong>or <strong>in</strong>crements of capital). Many exist<strong>in</strong>g DES utilized this strategy <strong>in</strong>itially.<br />
In the case of the envisaged DES <strong>in</strong> the Pearson area there are no outstand<strong>in</strong>g anchor<br />
customers that would, by themselves justify commencement of the project. Rather, it is<br />
expected that a group of several customers, <strong>in</strong> fact most of the prospects identified <strong>in</strong> Phase 1,<br />
would need to be committed.<br />
Pric<strong>in</strong>g cutt<strong>in</strong>g <strong>in</strong> general, which emphasizes customer “sav<strong>in</strong>gs” from exist<strong>in</strong>g costs, is not<br />
recommended as a market<strong>in</strong>g risk mitigation strategy. It typically uses a feasibility study<br />
performed by the DES to identify “sav<strong>in</strong>gs”. The problems <strong>in</strong> practice are that customers are<br />
skeptical that the sav<strong>in</strong>gs are real, <strong>in</strong> truth they are difficult to prove and customers will<br />
cont<strong>in</strong>ually require further sav<strong>in</strong>gs. This strategy has led to excessive price cutt<strong>in</strong>g result<strong>in</strong>g <strong>in</strong><br />
poor f<strong>in</strong>ancial performance and should be avoided. It must be taken <strong>in</strong>to account that stipulat<strong>in</strong>g<br />
a contract as “confidential” by no means <strong>in</strong>sures that it rema<strong>in</strong>s so. Interested parties will f<strong>in</strong>d<br />
out what they need to know <strong>in</strong> order to negotiate the lowest price available.<br />
Customer Behaviours<br />
The follow<strong>in</strong>g discussion identifies customer behaviours that <strong>in</strong>fluence market<strong>in</strong>g risks and often<br />
require responses or decisions by the DE developer.<br />
“Wait and see” attitude<br />
Some prospects may be reluctant to contract for DE service <strong>in</strong> the <strong>in</strong>itial stages of system<br />
development as this type of service is new to them. Many consumers are reluctant to be “early<br />
adopters” of new technologies or services, preferr<strong>in</strong>g to wait and see how it works for others.<br />
This reluctance does not only apply <strong>in</strong> retro-fit situations. It has also been seen <strong>in</strong> the <strong>in</strong>itial<br />
phases of new development. Successful market<strong>in</strong>g to such prospects requires education<br />
regard<strong>in</strong>g the use of DE by entities they recognize and presentation of persuasive arguments<br />
that the owners and operators have the expertise to reliably operate the DES.<br />
Distance to distribution system<br />
There may be build<strong>in</strong>g owners who desire DE service but who are too far from the pipe network<br />
to cost-effectively connect. If the <strong>in</strong>terest of these prospects is urgent due to equipment age or<br />
performance issues, there is a high risk that they will be lost as customers. If it is considered<br />
likely that the distribution system will be extended to the area with<strong>in</strong> a reasonable period, it may<br />
be feasible to <strong>in</strong>stall a temporary plant at or near the build<strong>in</strong>g site to serve that customer or<br />
group of customers <strong>in</strong> the <strong>in</strong>terim. Alternately, additional costs of advanc<strong>in</strong>g the schedule for<br />
distribution extension can sometimes be covered by federal fund<strong>in</strong>g assistance.<br />
Competition from on-site plants<br />
Other potential customers may be fixated on <strong>in</strong>stall<strong>in</strong>g and operat<strong>in</strong>g their own on-site plant.<br />
This is often the case when deal<strong>in</strong>g with conventional HVAC eng<strong>in</strong>eers, for whom DE is a form<br />
38
TRCA Pearson Eco-Bus<strong>in</strong>ess Zone <strong>District</strong> <strong>Energy</strong> <strong>Feasibility</strong> <strong>Study</strong> 10 April 2012<br />
of competition as it reduces their scope of work by deletion of the on-site boiler and chiller<br />
plants.<br />
As with any proposal for which the alternative <strong>in</strong>volves a significant capital expenditure, it is<br />
useful to frame the economic analysis <strong>in</strong> terms of return on <strong>in</strong>vestment <strong>in</strong> the plant as compared<br />
to other potential <strong>in</strong>vestments by the build<strong>in</strong>g owner.<br />
New plants<br />
A prospect may <strong>in</strong>dicate a desire to cont<strong>in</strong>ue own<strong>in</strong>g and operat<strong>in</strong>g their current on-site plant<br />
system especially if it is relatively new. This may apply to several new hotels <strong>in</strong> the area of the<br />
proposed DES. As a result, there may be little or no capital avoidance value (s<strong>in</strong>ce replacement<br />
is believed to be far off <strong>in</strong>to the future), which seriously detracts from the total value provided by<br />
DE.<br />
For build<strong>in</strong>gs with relatively newer plants, a potential w<strong>in</strong>/w<strong>in</strong> response that is sometimes<br />
suggested is to lease their plant capacity for peak<strong>in</strong>g and back-up, thereby procur<strong>in</strong>g needed<br />
capacity and reduc<strong>in</strong>g these customers’ net costs of district energy. As the leased equipment<br />
ages, they can eventually become regular customers. However, there are technical challenges<br />
with this approach, e.g. district heat<strong>in</strong>g systems <strong>in</strong>volve longer lengths of pipe than on-site<br />
systems and therefore often operate aga<strong>in</strong>st higher pressure drops with higher differential<br />
pressures between supply and return. Moreover, <strong>in</strong> this case, the capacity may not be needed<br />
if the CUP is part of the supply mix.<br />
Coord<strong>in</strong>ation with developers<br />
Private sector developers for new construction and owners of exist<strong>in</strong>g build<strong>in</strong>gs, each advised<br />
by their mechanical eng<strong>in</strong>eers must buy-<strong>in</strong> to DE because coord<strong>in</strong>ation of their activities with<br />
those of the DES is essential for its success. Risks <strong>in</strong>clude new construction that could<br />
otherwise connect be<strong>in</strong>g designed for on-site heat<strong>in</strong>g and/or cool<strong>in</strong>g generation or, <strong>in</strong> the case<br />
of exist<strong>in</strong>g build<strong>in</strong>gs, replacements and refurbishments be<strong>in</strong>g made which could be avoided by<br />
connection to DE.<br />
Mitigation measures <strong>in</strong>clude good two-way communication followed by system plann<strong>in</strong>g to<br />
enable the proposed DES to optimally serve prospective customers <strong>in</strong> a timely and economic<br />
way. S<strong>in</strong>ce connection to DE is a key procurement decision and s<strong>in</strong>ce a healthy DES will be a<br />
major benefit to the community, it is appropriate that <strong>in</strong>fluential leaders, <strong>in</strong>clud<strong>in</strong>g the Mayor,<br />
take an active role <strong>in</strong> promotion. If sold at a high-level, these decision makers will then ensure<br />
that management and mechanical eng<strong>in</strong>eers work closely with the DES staff to achieve a<br />
successful result. The local chapter of BOMA (the Build<strong>in</strong>g Owners and Managers Association)<br />
may be some assistance <strong>in</strong> this process.<br />
Design of <strong>in</strong>ternal HVAC systems<br />
After hav<strong>in</strong>g secured the <strong>in</strong>tent of developers and build<strong>in</strong>g owners to connect, the next<br />
challenge is to ensure that HVAC systems are designed to be compatible with an efficient DES.<br />
This may mean work<strong>in</strong>g with wider differences <strong>in</strong> temperature (ΔT) than the mechanical<br />
eng<strong>in</strong>eers are used to (and all that implies, such as no three-way valves and variable flow) and<br />
lower temperature profiles.<br />
Selection of the best system operat<strong>in</strong>g temperature profile <strong>in</strong> consultation with potential<br />
customers and their eng<strong>in</strong>eers is an important goal of the market<strong>in</strong>g phase of the project.<br />
<strong>Green</strong>field developments offer the opportunity to use a relatively low temperature profile for<br />
heat<strong>in</strong>g, i.e. 95°C – 65°C supply with a maximum 50°C return on the primary side. This implies<br />
39
TRCA Pearson Eco-Bus<strong>in</strong>ess Zone <strong>District</strong> <strong>Energy</strong> <strong>Feasibility</strong> <strong>Study</strong> 10 April 2012<br />
a secondary (i.e. customer side) temperature profile of 70°C – 50°C supply for space heat<strong>in</strong>g<br />
with a maximum 45-40°C return. There is also an analogous temperature set-back schedule for<br />
cool<strong>in</strong>g. These details should be provided early <strong>in</strong> discussions with prospective customers. The<br />
topic needs to be stressed dur<strong>in</strong>g design meet<strong>in</strong>gs and repeated often, as experience has<br />
shown that conventional HVAC eng<strong>in</strong>eers will tend to design <strong>in</strong>ternal systems that do not allow<br />
the desired primary temperature profiles and this can limit system capacity and efficiency.<br />
In the case of the envisaged DES <strong>in</strong> the Pearson area, there is a variety of ages of prospective<br />
build<strong>in</strong>gs. It may not be possible to achieve as low supply and return temperatures as ideally<br />
desired, but the default assumption before start<strong>in</strong>g discussions with build<strong>in</strong>g HVAC eng<strong>in</strong>eers<br />
could be based on the latest standard for new build<strong>in</strong>gs as outl<strong>in</strong>ed above.<br />
Particular Challenges of Market<strong>in</strong>g DE for New Developments<br />
In the case of a DES to serve new development the market risk is made more complicated by<br />
an uncerta<strong>in</strong> rate of real estate development and the need for the DES to be available to serve<br />
new build<strong>in</strong>gs. Hence, further <strong>in</strong>vestigation of the potential for new build<strong>in</strong>gs on the several<br />
vacant parcels <strong>in</strong> the area would be warranted.<br />
Development of green field or redevelopment of brown field areas often starts with road<br />
construction or reconstruction, at which time underground services are <strong>in</strong>stalled so there is an<br />
opportunity to <strong>in</strong>stall DE distribution pipe, which could be several years <strong>in</strong> advance of the DES<br />
enter<strong>in</strong>g service and produc<strong>in</strong>g revenue. The decision to <strong>in</strong>stall DE pipes is also related to a<br />
decision of whether to <strong>in</strong>stall natural gas distribution <strong>in</strong>frastructure because it would not be<br />
economic to <strong>in</strong>stall both.<br />
To make a decision that an area will be served only by DE clearly requires early agreement with<br />
the land developers. Also, when such a decision is made, it is important that all parties have<br />
confidence that the prospective DE owner will be able to complete the DES as a viable<br />
operation, otherwise land might be left stranded with neither DE nor gas service committed.<br />
Even if connection to DE is made mandatory, risk rema<strong>in</strong>s related to the uncerta<strong>in</strong> rate of real<br />
estate development and the pric<strong>in</strong>g that will be generally acceptable. Whereas DE rates are not<br />
regulated except <strong>in</strong> BC, it is possible that the Ontario regulator, the Ontario <strong>Energy</strong> Board, could<br />
take an active <strong>in</strong>terest should any party compla<strong>in</strong> that proposed prices are unreasonable.<br />
Summary<br />
Overall, the key to m<strong>in</strong>imiz<strong>in</strong>g market<strong>in</strong>g risks is a flexible market<strong>in</strong>g approach that focuses on<br />
value rather than price and which reflects a thorough understand<strong>in</strong>g of buyers, their behaviour<br />
and the technical constra<strong>in</strong>ts and opportunities posed by a specific set of target customers.<br />
7.1.4 Contracts and Pric<strong>in</strong>g<br />
As an outcome of successful market<strong>in</strong>g, customers will want to enter contracts for DE service.<br />
At that po<strong>in</strong>t, there are several risks to successful bus<strong>in</strong>ess operations of the DES that should<br />
be addressed <strong>in</strong> the negotiated contracts.<br />
Contract Term<br />
It is recommended that the term of the customer contracts be long-term, preferably of a length<br />
consistent with amortization of capital costs, such as 20 years. Generally, variable costs<br />
<strong>in</strong>clud<strong>in</strong>g franchise fees and taxes are handled as a pass-through on top of a fixed charge to<br />
cover fixed costs. By sign<strong>in</strong>g the long-term contract a credit-worthy customer provides<br />
assurance to the DES that the customer’s proportional share of the DES fixed costs, <strong>in</strong>clud<strong>in</strong>g<br />
40
TRCA Pearson Eco-Bus<strong>in</strong>ess Zone <strong>District</strong> <strong>Energy</strong> <strong>Feasibility</strong> <strong>Study</strong> 10 April 2012<br />
debt obligations, will be covered. And there will be provisions to cover these costs even <strong>in</strong> the<br />
event that the customer ceases to take service dur<strong>in</strong>g the contract period, unless the DES is at<br />
fault.<br />
Assessment of Pric<strong>in</strong>g Structures<br />
This section describes alternative pric<strong>in</strong>g structures that have been used <strong>in</strong> DES <strong>in</strong> Canada and<br />
their advantages and disadvantages. The <strong>in</strong>tent at this stage is not to make a def<strong>in</strong>ite<br />
recommendation of a pric<strong>in</strong>g structure but merely to po<strong>in</strong>t out some of the issues and potential<br />
pitfalls <strong>in</strong>herent <strong>in</strong> various commonly used structures.<br />
Alternative pric<strong>in</strong>g structures use one or more of the follow<strong>in</strong>g approaches:<br />
Open Book or Closed Book<br />
Two Part or One Part<br />
Match<strong>in</strong>g <strong>Energy</strong> Charges to Customer’s Avoided Costs or to DEC Input Costs<br />
Connection Fees or Amortization of Avoided Capital via Capacity Charges<br />
Escalation (for clarity, how the price elements change over time)<br />
Capacity Adjustments<br />
Competitiveness and Commercial Viability<br />
Open Book vs. Closed Book Pric<strong>in</strong>g<br />
The Open Book pric<strong>in</strong>g strategy provides the customer with direct knowledge of the DE service<br />
costs. Rate components fluctuate directly with correspond<strong>in</strong>g costs. This strategy may reduce<br />
f<strong>in</strong>ancial risk but may also limit profitability.<br />
This pric<strong>in</strong>g strategy has a mixed impact on the attractiveness of the DES offer. On one hand,<br />
transparency may be preferred by some customers; but, on the other hand, customers often<br />
prefer the DES to have economic <strong>in</strong>centives to operate efficiently and make cost effective<br />
<strong>in</strong>vestments <strong>in</strong> system improvements. This implies a pric<strong>in</strong>g regime whereby not all actual costs<br />
may be passed through to customers, which moves away from the Open Book approach.<br />
A Closed Book pric<strong>in</strong>g strategy provides the customer with no knowledge of underly<strong>in</strong>g costs.<br />
Rate components are fixed by contract and fluctuate by contractual escalation clauses. This<br />
strategy <strong>in</strong>creases f<strong>in</strong>ancial risk but may allow for a higher return on <strong>in</strong>vestment.<br />
Open Book pric<strong>in</strong>g only on the variable cost rate components of a Two-part rate structure is<br />
common <strong>in</strong> the <strong>in</strong>dustry.<br />
Two-Part vs. One-Part<br />
A Two-Part rate structure (i.e. a fixed component and a variable component) makes sense from<br />
a cash flow standpo<strong>in</strong>t and is the norm <strong>in</strong> the <strong>in</strong>dustry.<br />
The Two-Part rate structure provides a basis for ty<strong>in</strong>g prices to related costs.<br />
The fixed component may be expressed <strong>in</strong> $ per kWt of contract capacity per month. This may<br />
be <strong>in</strong>dexed to the Consumer Price Index (CPI). This revenue stream, which will be locked-<strong>in</strong><br />
from each customer under long-term (20 year) contracts, will cover the DES fixed costs such as<br />
debt payments, rent, wages and over-heads.<br />
The variable component may be expressed <strong>in</strong> $ per MWht consumption as metered <strong>in</strong> the<br />
previous month. This revenue stream will cover the variable cost components, such as fuel,<br />
electricity, water and consumables. It protects the DES owner from variations <strong>in</strong> cash flow<br />
related to fluctuations <strong>in</strong> both sales volumes and energy prices. If all or some of the energy was<br />
provided to the DES from a third party such as the GTAA, then ideally, that cost would be<br />
41
TRCA Pearson Eco-Bus<strong>in</strong>ess Zone <strong>District</strong> <strong>Energy</strong> <strong>Feasibility</strong> <strong>Study</strong> 10 April 2012<br />
<strong>in</strong>cluded <strong>in</strong> the variable cost that would be passed through to the customers under this<br />
approach. The <strong>in</strong>tent would be that the DES would earn no profit or loss on the energy itself<br />
and therefore its return on equity would be <strong>in</strong>sensitive to energy prices and volumes and factors<br />
outside its control that impact volumes, such as the weather. This is similar to the bus<strong>in</strong>ess<br />
models that Enbridge and Toronto Hydro work under, whereby they earn no profit on the gas<br />
commodity but rather earn a rate of return on their <strong>in</strong>vestment <strong>in</strong> delivery assets. The DES<br />
return on <strong>in</strong>vestment would be earned by fixed capacity charges that would be locked-<strong>in</strong> under<br />
20 year contracts. This provides a high-level of net <strong>in</strong>come stability and predictability for the<br />
DES once customers are signed up so that a relatively low utility grade rate of return on<br />
<strong>in</strong>vestment becomes commercially viable.<br />
Similarly, it is expected that if a third-party such as the GTAA were to supply wholesale energy<br />
to the DES, it would be paid a variable rate that recovered the actual variable cost of the energy<br />
plus a fixed charge to cover fixed costs. In this case, the actual variable cost would be affected<br />
by other unpredictable variables such as the hours of run time of the CHP, the actual de-rate of<br />
electricity caused by heat extraction from the steam turb<strong>in</strong>e and the price that would have been<br />
received for that electricity. This unpredictability could be addressed by an annual true-up<br />
procedure.<br />
Besides match<strong>in</strong>g costs with revenues and thereby ensur<strong>in</strong>g a stable net cash flow for the DES,<br />
the Two-part rate structure has the additional advantage of provid<strong>in</strong>g appropriate signals to the<br />
customer. For example, if the fixed component for a customer is tied to the requested capacity,<br />
the customers will be motivated to m<strong>in</strong>imize the capacity they request, which frees the DES to<br />
sell this capacity to others. It is expected that there would be customer concerns as to whether<br />
sufficient capacity is contracted. Allow<strong>in</strong>g capacity adjustments, subject to conditions is a<br />
possible mechanism to address this concern.<br />
Ty<strong>in</strong>g the variable component to consumption and energy prices provides <strong>in</strong>centives for the<br />
customers to reduce energy consumption. They still enjoy reduced risk exposure to energy<br />
prices to the extent the quantity of fuel required to deliver a unit of thermal energy is reduced by<br />
the higher efficiency achieved by the DES.<br />
If the rate structure is limited to a One-Part rate, i.e. s<strong>in</strong>gle rate per MWht or ton-hour, there will<br />
be a poor match of monthly cash flow to monthly costs. There is a risk of <strong>in</strong>adequate revenues<br />
if the weather is milder than expected, there is reduced occupancy or if energy conservation<br />
measures reduce energy demand.<br />
Match<strong>in</strong>g <strong>Energy</strong> Charges to Customer’s Avoided Costs or to DES Input Costs<br />
The extent to which the DES operator is protected from cash flow fluctuations depends on<br />
whether the variable charges are matched to the DES’s <strong>in</strong>put costs or the customers’ <strong>in</strong>put<br />
energy costs. Match<strong>in</strong>g the variable rate component to the DES <strong>in</strong>put energy costs provides a<br />
total pass through of variable costs to the customers. The DES must meet any contracted<br />
efficiency standards, which are with<strong>in</strong> the control of the DES and not an undue risk, especially <strong>in</strong><br />
the long-term, provided those standards are realistic.<br />
Match<strong>in</strong>g the variable rate component to the customer’s <strong>in</strong>put energy costs provides a very<br />
similar pass-through of energy costs to the customers. Customer’s <strong>in</strong>put energy costs will tend<br />
to track the DES’s <strong>in</strong>put energy costs though not exactly because of different utility rates and<br />
load profiles. Fixed components such as monthly customer charges are not <strong>in</strong>cluded <strong>in</strong> the DE<br />
variable charge, s<strong>in</strong>ce they are not avoided.<br />
42
TRCA Pearson Eco-Bus<strong>in</strong>ess Zone <strong>District</strong> <strong>Energy</strong> <strong>Feasibility</strong> <strong>Study</strong> 10 April 2012<br />
A price structure matched to the customer’s energy costs will likely have higher variable charges<br />
and lower fixed charges. This structure doesn’t provide secure coverage of the DES fixed costs<br />
and is therefore a risk to the DES.<br />
The argument <strong>in</strong> favour of higher variable charges and lower fixed charges is that it more<br />
closely approximates the average utility bill that the customer is familiar with. This is a more<br />
straightforward sell and the market<strong>in</strong>g advantage is sometimes seen to off-set the higher risk to<br />
the DES.<br />
However, one disadvantage that has occurred <strong>in</strong> at least one case is that s<strong>in</strong>ce it becomes more<br />
obvious under this price structure that the fixed charges are related to an estimate of the<br />
customer’s avoided fixed costs of capital and non-fuel operation and ma<strong>in</strong>tenance and s<strong>in</strong>ce<br />
those cost elements are always controversial, the price negotiation can become more difficult.<br />
In some cases, it may be easier to sell a higher fixed cost justified, not only, by the avoided fixed<br />
costs of capital and non-fuel operation and ma<strong>in</strong>tenance, but also, by sav<strong>in</strong>gs <strong>in</strong> energy costs,<br />
which are open-ended and therefore offer the customer the promise of an upside benefit <strong>in</strong> the<br />
sense of keep<strong>in</strong>g energy costs more stable than under Bus<strong>in</strong>ess-as-Usual.<br />
Connection Fees or Amortization of Avoided Capital via Capacity Charges<br />
A challenge with fixed charges is that customers may not understand why they must pay a<br />
significant part of their annual service costs <strong>in</strong> a fixed monthly charge, even when they are not<br />
consum<strong>in</strong>g much energy. This should be addressed through a specific and well-designed<br />
communications effort dur<strong>in</strong>g contract negotiations.<br />
This challenge is exacerbated if there is no connection fee. The fixed charge alone must cover<br />
not only the DES on-go<strong>in</strong>g fixed costs but also amortization of the DES capital <strong>in</strong>vestment, or<br />
avoidance of replacement costs <strong>in</strong> the case of retrofits to exist<strong>in</strong>g build<strong>in</strong>gs. The customers may<br />
resent pay<strong>in</strong>g more on an on-go<strong>in</strong>g basis than they would normally; forgett<strong>in</strong>g that connection to<br />
the DES saved capital dur<strong>in</strong>g the build<strong>in</strong>g construction, or that it will avoid future replacement<br />
costs.<br />
The problem can be mitigated by government subsidies so that not all of the capital <strong>in</strong>vestment<br />
must be amortized. It may still be seen as a potential disadvantage for DE market<strong>in</strong>g. DES<br />
often take many years to build-out and prospective new customers will tend to check the<br />
experience of exist<strong>in</strong>g customers, so it is important that active customers feel they are fairly<br />
treated.<br />
This is a particular problem where the build<strong>in</strong>g developer and eventual owner are different. The<br />
classic example is for Condom<strong>in</strong>ium Corporations. The developer enjoys the benefit of sav<strong>in</strong>g<br />
capital that would otherwise be spent on heat<strong>in</strong>g and cool<strong>in</strong>g equipment, but this benefit may<br />
not be transferred to the owners. The market price of condom<strong>in</strong>ium units is overwhelm<strong>in</strong>gly<br />
driven by other factors so a construction cost sav<strong>in</strong>g of about 5% may not be noticeably<br />
reflected <strong>in</strong> the purchase price.<br />
In order to address this problem, connection fees have been favoured <strong>in</strong> some DES as part of<br />
the overall rate package. It was considered better to recover the benefit of avoided capital upfront<br />
directly from the developer and then have a lower fixed payment. The lower fixed payment<br />
would be comparable to the usual on-go<strong>in</strong>g fixed operation and ma<strong>in</strong>tenance costs. Aga<strong>in</strong>, one<br />
downside is that the closer a capacity charge comes to represent<strong>in</strong>g a s<strong>in</strong>gle avoided cost<br />
component, the more difficult price negotiations may become. Build<strong>in</strong>g developers tend to<br />
argue their usual on-go<strong>in</strong>g costs would be lower if they suspect that this avoided cost is be<strong>in</strong>g<br />
used to justify the DES fixed charges. Based on such experiences, <strong>in</strong>clud<strong>in</strong>g cases that have<br />
43
TRCA Pearson Eco-Bus<strong>in</strong>ess Zone <strong>District</strong> <strong>Energy</strong> <strong>Feasibility</strong> <strong>Study</strong> 10 April 2012<br />
proceeded to arbitration, FVB would recommend not emphasiz<strong>in</strong>g the avoided cost aspect but<br />
rather that the DES simply needs a certa<strong>in</strong> level of revenue to be viable.<br />
There is a long-term downside to connection fees. They eventually have a negative effect on<br />
the revenue stream. Obviously connection fees cease once all customers are connected,<br />
whereas the escalat<strong>in</strong>g fixed payments would cont<strong>in</strong>ue. Moreover, as almost all of the<br />
customers will renew their contracts the fixed payments will cont<strong>in</strong>ue to produce revenue.<br />
One mitigation measure that was then developed was to have a renewal fee that is supposed to<br />
represent the customer’s avoided replacement costs. It is too early to assess how this strategy<br />
will play out <strong>in</strong> the long-term. But it seems reasonable as the customer would usually have to<br />
pay replacement costs <strong>in</strong> the typical 20 year contract term, and it is consistent with the pr<strong>in</strong>ciple<br />
of renew<strong>in</strong>g on terms similar to those be<strong>in</strong>g offered to new customers.<br />
Escalation<br />
The methods by which prices will change over time are just as important as the prices<br />
themselves.<br />
Often the One-Part rate and the fixed portion of the Two-Part rate are simply escalated by CPI.<br />
The variable portion of the Two-Part rate is usually automatically escalated <strong>in</strong> l<strong>in</strong>e with the<br />
correspond<strong>in</strong>g purchased energy costs. Sometimes the water and chemicals portions of cool<strong>in</strong>g<br />
energy charges are escalated by water supply cost and CPI, respectively. Water was<br />
considered worthy of special attention <strong>in</strong> some cases because it was believed to be possibly<br />
subject to major cost <strong>in</strong>creases.<br />
One objection frequently heard is that the portion of the fixed rate related to capital cost should<br />
not escalate because the cost of amortiz<strong>in</strong>g capital is similar to a fixed debt payment. Or, to<br />
address replacement costs, a typical s<strong>in</strong>k<strong>in</strong>g fund formula yields a constant annual payment.<br />
However, other (non-capital) fixed costs do escalate, i.e. wages and other overhead costs.<br />
Some previous DES identify this fact by hav<strong>in</strong>g a Three-Part rate <strong>in</strong>clud<strong>in</strong>g an escalat<strong>in</strong>g fixed<br />
charge and a non-escalat<strong>in</strong>g fixed charge. However, FVB’s general view is that this<br />
complication is not needed or optimal for new DES for the follow<strong>in</strong>g reasons.<br />
The DES must receive a level of revenue <strong>in</strong> relation to its costs and <strong>in</strong>vestments <strong>in</strong> order to be<br />
viable. If the capital portion of the fixed rate did not escalate it would have to be higher to beg<strong>in</strong><br />
with <strong>in</strong> order to provide an equivalent revenue stream.<br />
It’s probably more affordable for the customer to accept a rate that is lower to beg<strong>in</strong> with and then<br />
escalates with CPI because the customer’s own <strong>in</strong>come escalates roughly with CPI. In addition, the<br />
customer’s benefit from DE is expected to <strong>in</strong>crease over time with energy prices, i.e. if the variable<br />
portion of the rate is related to the DEC <strong>in</strong>put energy costs, which are lower than the customer’s.<br />
The customer’s costs of capital replacement escalate.<br />
Capacity Adjustments<br />
Customer service costs are determ<strong>in</strong>ed <strong>in</strong> part by contract capacity. Therefore, it is important to<br />
<strong>in</strong>clude adjustment provisions for customer and DES risk mitigation.<br />
There are risks associated with establish<strong>in</strong>g the <strong>in</strong>itial contract capacity under a Two-part rate.<br />
If the capacity is set too high, the correspond<strong>in</strong>g service cost would also be too high. This<br />
excessive cost would present a market<strong>in</strong>g challenge. If the capacity is set is too low it may be<br />
<strong>in</strong>adequate to meet the actual peak demand.<br />
44
TRCA Pearson Eco-Bus<strong>in</strong>ess Zone <strong>District</strong> <strong>Energy</strong> <strong>Feasibility</strong> <strong>Study</strong> 10 April 2012<br />
Once capacity is responsibly set then accurate meter<strong>in</strong>g must be employed. Changes <strong>in</strong><br />
demand, if not properly registered will negatively impact the DES. Unreported <strong>in</strong>creases can<br />
result <strong>in</strong> poor revenues and decreases will impact customer relations. These fluctuations <strong>in</strong><br />
demand can be easily accommodated with proper meter<strong>in</strong>g and fair contract provisions for<br />
adjustments.<br />
A contract provision used by some DES is to allow customers to unilaterally <strong>in</strong>crease their<br />
contract capacity by up to 20% for up to 2 years from the commencement of service. This<br />
<strong>in</strong>cludes a premium of 20% on the fixed payment for the portion that is <strong>in</strong>creased. This<br />
encourages customers to not over contract <strong>in</strong>itially as they have the ability to adjust upwards if<br />
necessary for a reasonable and def<strong>in</strong>ed cost.<br />
Physical connection capacities, <strong>in</strong>clud<strong>in</strong>g the ETS, usually have a 20% design allowance<br />
anyway and the <strong>Energy</strong> Centre and DPS should have at least that amount of spare capacity to<br />
allow for cont<strong>in</strong>gencies.<br />
Similarly, if actual metered demand exceeds contract by up to 20%, the DES can unilaterally<br />
<strong>in</strong>crease the customer’s contract capacity and apply a 20% premium.<br />
Conversely customer requests to reduce contracted capacity are not necessarily easy to<br />
accommodate by the DES from a f<strong>in</strong>ancial perspective, except to the extent that growth is<br />
expected and system capacity is expected to be added <strong>in</strong> stages.<br />
Competitiveness and Commercial Viability<br />
DE should be marketed as a value added service at a competitive price. Customers are no<br />
longer burdened with own<strong>in</strong>g and operat<strong>in</strong>g heat<strong>in</strong>g and cool<strong>in</strong>g plants. This saves capital for<br />
new build<strong>in</strong>gs and replacement capital for exist<strong>in</strong>g build<strong>in</strong>gs. DE makes the build<strong>in</strong>gs less costly<br />
and easier to operate with a higher quality of reliable comfort delivered to occupants.<br />
In general, the bus<strong>in</strong>ess case for DES rests on supply<strong>in</strong>g heat<strong>in</strong>g and/or cool<strong>in</strong>g service us<strong>in</strong>g<br />
fuel more efficiently also us<strong>in</strong>g lower cost fuels or sources of thermal energy. These benefits<br />
are not generally possible <strong>in</strong> standalone heat<strong>in</strong>g or cool<strong>in</strong>g plants that would otherwise be used<br />
by customers. The total cost of <strong>in</strong>put energy is less; customers also save the cost of own<strong>in</strong>g,<br />
operat<strong>in</strong>g and ma<strong>in</strong>ta<strong>in</strong><strong>in</strong>g their own heat<strong>in</strong>g and cool<strong>in</strong>g plants.<br />
Customers pay energy service charges which are generally structured to cover both the variable<br />
operat<strong>in</strong>g cost of the DES and the overall fixed cost. Typical DES charges are compared with<br />
the bus<strong>in</strong>ess-as-usual cost for a customer to provide their own heat<strong>in</strong>g <strong>in</strong> Figure 3 below.<br />
45
TRCA Pearson Eco-Bus<strong>in</strong>ess Zone <strong>District</strong> <strong>Energy</strong> <strong>Feasibility</strong> <strong>Study</strong> 10 April 2012<br />
$/year<br />
Illustrative Comparison of Heat<strong>in</strong>g Costs<br />
for a Typical Customer<br />
O&M<br />
The illustration makes the follow<strong>in</strong>g po<strong>in</strong>ts:<br />
Capital<br />
<strong>Energy</strong><br />
Bus<strong>in</strong>ess-as-Usual<br />
1 <strong>District</strong> 2 <strong>Energy</strong><br />
Figure 3 Comparison of BaU to DES Rates<br />
46<br />
Capacity<br />
<strong>Energy</strong><br />
The total BaU costs for a customer <strong>in</strong>cludes not only their utility bill (identified <strong>in</strong> Figure 3 as<br />
<strong>Energy</strong>), but also amortization of the capital <strong>in</strong>vestment <strong>in</strong> heat<strong>in</strong>g and cool<strong>in</strong>g generation<br />
equipment and ancillaries and the annual cost of operat<strong>in</strong>g and ma<strong>in</strong>ta<strong>in</strong><strong>in</strong>g that equipment.<br />
DE service charges should be competitive with BaU costs, but not necessarily much lower <strong>in</strong> total.<br />
DE service charges generally have a variable element related to the customer’s energy<br />
consumption plus a fixed element related to the capacity supplied to a customer (i.e. the peak<br />
customer demand accord<strong>in</strong>g to the energy service contract and that the branch connection and<br />
ETS are designed to service).<br />
In the illustration <strong>in</strong> Figure 3, the cost of energy to provide heat<strong>in</strong>g to the customer us<strong>in</strong>g DE is<br />
shown as significantly less than the cost of energy <strong>in</strong>puts that would otherwise be consumed <strong>in</strong><br />
the customer’s own standalone heat<strong>in</strong>g plant. (This will only be true to the extent that a nonconventional<br />
energy source such as CHP is <strong>in</strong>corporated <strong>in</strong> the supply mix). The balance of the<br />
service charge labeled “Capacity” represents the value added by the comb<strong>in</strong>ation of capital<br />
<strong>in</strong>vestment <strong>in</strong> DE <strong>in</strong>frastructure, <strong>in</strong>clud<strong>in</strong>g <strong>Energy</strong> Centre, DPS and ETS, and necessary<br />
commitment of annual fixed costs, such as labour and adm<strong>in</strong>istration.<br />
For a specific project, the projected value added aggregated for all customers relative to the<br />
capital <strong>in</strong>vestment and annual fixed costs will determ<strong>in</strong>e the bus<strong>in</strong>ess case for the project. This<br />
can be <strong>in</strong>dicated <strong>in</strong> various ways. One simple way is to divide the total estimated <strong>in</strong>vestment <strong>in</strong><br />
dollars by the total projected annual value added (less projected annual fixed costs). The result<br />
of this division is called the simple payback and it provides a quick <strong>in</strong>dicator of commercial<br />
viability.<br />
If the simple payback is greater than 20 years and the price po<strong>in</strong>t has been set competitively,<br />
then a flag is raised immediately as to the commercial viability of the proposed project. In that<br />
case, a closer look needs to be taken at whether costs may have been over-estimated and/or<br />
revenues under-estimated. If the estimates are considered reasonable, tak<strong>in</strong>g <strong>in</strong>to account the<br />
stage of project development, then the technical concept should be re-visited <strong>in</strong> an attempt to<br />
move the simple payback closer to 10 years.
TRCA Pearson Eco-Bus<strong>in</strong>ess Zone <strong>District</strong> <strong>Energy</strong> <strong>Feasibility</strong> <strong>Study</strong> 10 April 2012<br />
On the other hand if the simple payback is much less than 10 years, this would raise a concern<br />
that there may be flaw somewhere <strong>in</strong> the underly<strong>in</strong>g assumptions, s<strong>in</strong>ce experience shows that<br />
this type of project would not generally be expected to have a simple payback very much under<br />
10 years.<br />
Generally, most district energy <strong>in</strong>frastructure <strong>in</strong>vestments have simple paybacks of around 10 or<br />
15 years. It is expected that this is comparable to <strong>in</strong>frastructure <strong>in</strong>vestments that electricity and<br />
gas utilities often make. Simple paybacks of this order would be associated with before tax<br />
project return on <strong>in</strong>vestment over 20 years <strong>in</strong> the range of 8-12%. This is generally considered<br />
good for a utility rate of return where the revenue stream is locked <strong>in</strong> through suitable long-term<br />
contracts. Therefore, it is expected that there would be <strong>in</strong>terest from outside parties <strong>in</strong><br />
participat<strong>in</strong>g <strong>in</strong> such a project provided this level of return could be assured. The challenge is to<br />
achieve a sufficient level of assurance.<br />
7.1.5 Safety<br />
Development risks that could arise <strong>in</strong> the construction and operations phases need to be<br />
addressed <strong>in</strong> the design phase. Safety risks and environmental approvals will be discussed as<br />
these topics have an <strong>in</strong>fluence on design, <strong>in</strong>clud<strong>in</strong>g strategic design decisions, e.g. location of<br />
the EC and fuels to be used.<br />
The greatest safety impacts tend to be associated with the energy conversion component of the<br />
DES, i.e. the EC, not the thermal distribution and energy transfer stations <strong>in</strong> customer build<strong>in</strong>gs.<br />
The thermal distribution and energy transfer systems are closed loops operated at moderate<br />
temperatures and pressures. They are <strong>in</strong>sulated and, <strong>in</strong> the case of thermal distribution, mostly<br />
buried. Pressure is a hazard that is addressed <strong>in</strong> regulations. Steam systems can cause<br />
personal <strong>in</strong>jury and significant property damages <strong>in</strong> the case of catastrophic events but modern<br />
district heat<strong>in</strong>g systems such as would be developed <strong>in</strong> <strong>Project</strong> <strong>Green</strong> are based on hot water<br />
distribution, which is far less hazardous.<br />
<strong>Energy</strong> Centres are operated <strong>in</strong> accordance with strict safety and security procedures, similar to<br />
an electricity generat<strong>in</strong>g station. Indeed, one of the benefits of DE is to remove the <strong>in</strong>herently<br />
hazardous energy conversion process from public use build<strong>in</strong>gs. Those customer build<strong>in</strong>gs are<br />
then free from combustible fuels and refrigerants. For new build<strong>in</strong>gs, no gas service is needed<br />
and <strong>in</strong> the case of district cool<strong>in</strong>g, electrical service may be downsized. Cool<strong>in</strong>g towers with<br />
their emissions are centralized. The overall standard of safety for the community is thereby<br />
improved.<br />
Prov<strong>in</strong>cial governments or agencies typically enforce safety regulations for most types of<br />
employment and commercial activity. Regulations relat<strong>in</strong>g to the hazards of electrical safety,<br />
pressure vessels, use of natural gas and chemicals impact design of <strong>Energy</strong> Centres and<br />
compliance with such regulations are the first strategy to mitigate these risks.<br />
Pressure Vessels<br />
Boilers and pressure vessels must be <strong>in</strong> strict compliance with the adm<strong>in</strong>istrative and technical<br />
rules of the appropriate section of the CSA B51 code. Among other requirements, this<br />
equipment must be assigned a Canadian Registration Number (CRN), which is stamped on the<br />
nameplate of the boiler or pressure vessel. The procurement process must ensure that all<br />
purchased equipment have CRN numbers as required.<br />
Government <strong>in</strong>spectors may follow-up dur<strong>in</strong>g construction to ensure that weld<strong>in</strong>g of pressure<br />
pip<strong>in</strong>g is <strong>in</strong> accordance with all applicable codes.<br />
47
TRCA Pearson Eco-Bus<strong>in</strong>ess Zone <strong>District</strong> <strong>Energy</strong> <strong>Feasibility</strong> <strong>Study</strong> 10 April 2012<br />
Electrical and Gas Services<br />
Licens<strong>in</strong>g programs apply to contractors, employers, and <strong>in</strong>dividuals who provide electrical or<br />
gas <strong>in</strong>stallation services.<br />
Electrical <strong>in</strong>spections are required for new electrical systems such as would be <strong>in</strong>cluded <strong>in</strong> the<br />
EC and can be performed by the Electrical Safety Authority <strong>in</strong> Ontario.<br />
Chemicals<br />
Although DES rarely employ chemicals that are severely toxic or hazardous, there are always a<br />
number of chemicals used, e.g. for water treatment or as refrigerants. All chemicals used are<br />
covered by the Workplace Hazardous Materials Information System (WHMIS). This is a system<br />
designed to reduce the risk from hazardous products <strong>in</strong> the workplace. It is governed by both<br />
Federal and Prov<strong>in</strong>cial Laws. Operations staff must be tra<strong>in</strong>ed <strong>in</strong> safe handl<strong>in</strong>g and storage of<br />
these chemicals.<br />
Water Treatment Chemicals<br />
Whereas the thermal distribution systems are closed loops, a cool<strong>in</strong>g tower may use an open<br />
loop. Various water treatment chemicals may be used for pH adjustment, soften<strong>in</strong>g, prevention<br />
of scal<strong>in</strong>g or biocides. Consultants and/or suppliers may be <strong>in</strong>volved <strong>in</strong> specify<strong>in</strong>g the dosage<br />
and Operations staff may be <strong>in</strong>volved <strong>in</strong> the handl<strong>in</strong>g and storage.<br />
Refrigerants<br />
Refrigerants are used <strong>in</strong> closed loops but hazards arise <strong>in</strong> ma<strong>in</strong>tenance or from chronic leaks.<br />
Depend<strong>in</strong>g on the refrigerants used for production of chilled water for district cool<strong>in</strong>g, there are<br />
risks of non-compliance with federal, prov<strong>in</strong>cial and local laws.<br />
There is also potential additional liability risks associated with release of a toxic substance like<br />
ammonia <strong>in</strong>to a congested area. Refrigerant-related risks can be m<strong>in</strong>imized by:<br />
Thoroughly understand<strong>in</strong>g regulatory requirements<br />
Design<strong>in</strong>g refrigerant handl<strong>in</strong>g, storage and leak detection systems for utmost safety<br />
Implement<strong>in</strong>g a strong operator tra<strong>in</strong><strong>in</strong>g program<br />
General Utility Operations Safety Culture<br />
Beyond compliance with regulations, the DES needs to have an energy utility level of safety<br />
consciousness with staff that are appropriately experienced and qualified.<br />
7.1.6 Certificate of Approval<br />
In order for a DE project to proceed on a timely schedule, the developer must secure certa<strong>in</strong><br />
approvals from regulatory authorities. The most important environmental approval required is a<br />
Certificate of Approval (C of A) for emission and noise from the Prov<strong>in</strong>cial M<strong>in</strong>istry of<br />
Environment (MOE). Mean<strong>in</strong>gful application for a C of A requires completion of prelim<strong>in</strong>ary<br />
design and would occur follow<strong>in</strong>g project def<strong>in</strong>ition (see Implementation Plan, Section 9).<br />
7.1.7 Environmental Assessments – Prov<strong>in</strong>cial and Federal<br />
The prov<strong>in</strong>cial and federal governments both require Environmental Assessments (EA’s) prior to<br />
start of construction for projects considered likely to result <strong>in</strong> significant effects on the<br />
environment, <strong>in</strong>clud<strong>in</strong>g social and economic effects. EA’s are typically carried out for largescale<br />
complex undertak<strong>in</strong>gs with potential for significant environmental effects and major public<br />
<strong>in</strong>terest.<br />
48
TRCA Pearson Eco-Bus<strong>in</strong>ess Zone <strong>District</strong> <strong>Energy</strong> <strong>Feasibility</strong> <strong>Study</strong> 10 April 2012<br />
The question as to whether an EA would be required for a particular project can only be<br />
answered def<strong>in</strong>itively by reference to the appropriate authorities after the scope of the project is<br />
better understood. However, it may be <strong>in</strong>terest<strong>in</strong>g to take note of FVB’s experience of EA’s <strong>in</strong><br />
the course of help<strong>in</strong>g clients develop new DES <strong>in</strong> most of the prov<strong>in</strong>ces and territories <strong>in</strong><br />
Canada, approximately 20 new projects <strong>in</strong> total.<br />
To-date we have not encountered cases where a prov<strong>in</strong>cial EA has been undertaken and it is<br />
unlikely to be needed for most DE projects. Generally, EA's tend to be required for projects<br />
that:<br />
Impact any unique, rare or endangered feature of the environment<br />
Use a resource to the extent that it precludes other uses<br />
Emit pollutants or waste products not regulated under other legislation<br />
Cause widespread public concern because of environmental changes<br />
Involve a new technology that may damage the environment or<br />
Have or cause significant impact on the environment<br />
Ontario EA’s<br />
Rules concern<strong>in</strong>g EA's for electricity generation projects <strong>in</strong> Ontario specify there is no EA<br />
required for cogeneration projects (with efficiency greater than 60%) of less than 25 MWe<br />
capacity.<br />
Subject to the technical concept that is developed for a specific DE project and subsequent<br />
consultation with officials of the MOE, it is anticipated that none of the above will be deemed to<br />
apply to a typical DE project.<br />
Federal EA’s<br />
A federal EA is triggered by federal fund<strong>in</strong>g, which is a dist<strong>in</strong>ct possibility for many DE projects.<br />
Federal EA’s are adm<strong>in</strong>istered by the Canadian Environmental Assessment Agency (CEAA)<br />
and will generally be required if the project receives federal fund<strong>in</strong>g. However, it is likely to<br />
<strong>in</strong>volve only a screen<strong>in</strong>g study, not a more detailed comprehensive study. The comprehensive<br />
studies, which must <strong>in</strong>volve public consultation and be submitted to the M<strong>in</strong>ister for approval,<br />
are generally required only for projects that are large <strong>in</strong> scale and have the potential to create<br />
significant adverse environmental effects and to generate public concern.<br />
A DES thermal distribution system is a closed loop with m<strong>in</strong>imal environmental impact. <strong>Energy</strong><br />
sources may conceivably have significant environmental impacts and generate public concern,<br />
e.g. if they <strong>in</strong>volve combustion of solid fuels or extensive water diversion. However, to FVB’s<br />
knowledge a comprehensive study has never been required for a new DES project <strong>in</strong> Canada.<br />
We have seen two stages <strong>in</strong> a CEAA screen<strong>in</strong>g process. In the first stage, an overview of the<br />
project scope and its potential environmental impacts was submitted <strong>in</strong> a report entitled<br />
Information Requirements for Federal Scop<strong>in</strong>g Decisions. We understood this was provided to<br />
give enough <strong>in</strong>formation for CEAA to decide which federal authority would take the lead role <strong>in</strong><br />
adm<strong>in</strong>ister<strong>in</strong>g the process.<br />
The next step was to prepare and submit a screen<strong>in</strong>g report that described the project <strong>in</strong> more<br />
detail together with its expected environmental impacts. No public consultation was required by<br />
CEAA, but our client decided to voluntarily hold public consultation sessions.<br />
These two steps took approximately n<strong>in</strong>e months. They were undertaken <strong>in</strong> parallel with other<br />
non-construction project development work such as design, market<strong>in</strong>g and f<strong>in</strong>anc<strong>in</strong>g.<br />
49
TRCA Pearson Eco-Bus<strong>in</strong>ess Zone <strong>District</strong> <strong>Energy</strong> <strong>Feasibility</strong> <strong>Study</strong> 10 April 2012<br />
7.1.8 CHP Related Approvals and Issues<br />
The generation, transmission and distribution and sale of electricity <strong>in</strong> Canada, and many other<br />
countries, have traditionally been closely regulated and often legally restricted to a few<br />
regulated utilities. These laws and regulations may impact a DES that <strong>in</strong>cludes CHP.<br />
The extent and nature of this impact will depend on the technical concept. For example, if the<br />
technical concept <strong>in</strong>volves development of a small CHP embedded <strong>in</strong> the local distribution<br />
system, then there will be some issues to resolve around ownership and the legal right to<br />
generate and sell electricity, meter<strong>in</strong>g and connection requirements and prices to be received<br />
for the electrical output and who will be the customer.<br />
Connection requirements would have to be discussed with the local electric distribution<br />
company (LDC). Accord<strong>in</strong>g to the Distribution Code, generators should have a choice of three<br />
methods:<br />
Direct connection to the distribution system<br />
Parallel connection with a load customer, i.e. connection downstream of the customer connection<br />
po<strong>in</strong>t to the distribution system, but upstream of the retail meter<br />
Series connection with a load customer, i.e. connection downstream of the retail meter<br />
Series Connection<br />
Series connection facilitates net bill<strong>in</strong>g and beh<strong>in</strong>d the meter sav<strong>in</strong>gs (i.e. Transmission<br />
Network, Wholesale Services and Loss Adjustment) that might amount <strong>in</strong> Ontario to<br />
approximately 1.7 cents/kWh, consist<strong>in</strong>g of approximately 0.3 cents <strong>in</strong> electricity sav<strong>in</strong>gs due to<br />
avoidance of Loss Adjustment, 0.7 cents <strong>in</strong> Transmission Network charges and 0.7 cents <strong>in</strong><br />
Wholesale Service charges. The sav<strong>in</strong>gs <strong>in</strong> Transmission Network for any particular month<br />
would be realized only if the generator runs at least from 7 AM to 7 PM every week day that<br />
month.<br />
However, more recently the OPA has specified that series connection is not to be encouraged<br />
and any beh<strong>in</strong>d the meter sav<strong>in</strong>gs to the customer that occur as a result of series connection<br />
must be remitted to the OPA.<br />
The EC itself will be a load customer, e.g. for pumps and general plant consumption and a<br />
cool<strong>in</strong>g plant could have a very significant electrical load <strong>in</strong> summer. If the EC is <strong>in</strong>tegrated with<br />
another build<strong>in</strong>g the two entities together may form one larger load customer. This would<br />
<strong>in</strong>crease the potential for beh<strong>in</strong>d the meter sav<strong>in</strong>gs from onsite generation but this should not be<br />
a determ<strong>in</strong><strong>in</strong>g factor for plant location as these sav<strong>in</strong>gs are not predictable and should not be<br />
relied on as a key component of expected project revenue (see also the comment regard<strong>in</strong>g<br />
OPA contracts <strong>in</strong> the previous paragraph).<br />
Distribution versus Standby Charges is another issue that needs to be considered when<br />
project<strong>in</strong>g the impact of an embedded generator on the load customers total electricity bill<strong>in</strong>gs.<br />
Series connection could result <strong>in</strong> lower Distribution Charges, but the amount is uncerta<strong>in</strong><br />
because Distribution Charges are billed on non-co<strong>in</strong>cident 10<br />
peak kVA, which means the highest<br />
peak the customer draws anytime dur<strong>in</strong>g the month. For example, if the generator runs at peak<br />
times but not off-peak it may shift the net non-co<strong>in</strong>cident peak to an hour when the generator is<br />
not runn<strong>in</strong>g. This may be a reduction, but the amount may not be precisely predictable. In any<br />
case, to offset losses <strong>in</strong> Distribution Charges, most local distribution companies would assess<br />
10 This means non-co<strong>in</strong>cident with the system peak<br />
50
TRCA Pearson Eco-Bus<strong>in</strong>ess Zone <strong>District</strong> <strong>Energy</strong> <strong>Feasibility</strong> <strong>Study</strong> 10 April 2012<br />
Standby Charges, which may be assumed to roughly approximate their losses <strong>in</strong> Distribution<br />
Charges.<br />
The realization of beh<strong>in</strong>d the meter sav<strong>in</strong>gs is far from certa<strong>in</strong>. Series connection is no longer<br />
allowed <strong>in</strong> FIT contracts or <strong>in</strong> CHPSOP contracts. Moreover there is doubt whether<br />
Measurement Canada can accept series connection as be<strong>in</strong>g sufficiently accurate.<br />
The applicability of beh<strong>in</strong>d the meter sav<strong>in</strong>gs is really an adm<strong>in</strong>istrative, not a connection, issue<br />
s<strong>in</strong>ce they could be easily calculated even under a parallel connection by simply subtract<strong>in</strong>g the<br />
generator meter read<strong>in</strong>gs from the retail meter. Series connection only facilitates net bill<strong>in</strong>g by<br />
elim<strong>in</strong>at<strong>in</strong>g the need for this subtraction.<br />
A more important economic issue that impacts natural gas fired CHP is that f<strong>in</strong>anc<strong>in</strong>g and<br />
prudent <strong>in</strong>vestment <strong>in</strong> gas-fired generat<strong>in</strong>g units depends on mitigation of spark-spread risk, i.e.<br />
the difference <strong>in</strong> any hour between the price of electricity and the price of natural gas. Contract<br />
electricity prices based on a straight cents/kWh, such as used for renewable energy, are not<br />
ideal for gas-fired generation. Rather, some form of spark-spread risk mitigation is needed to<br />
ensure coverage of fixed costs, <strong>in</strong>clud<strong>in</strong>g debt service and return on <strong>in</strong>vestment, regardless of<br />
future spark-spread, which is go<strong>in</strong>g to <strong>in</strong>evitably vary over the long-life of this type of asset.<br />
In view of the overwhelm<strong>in</strong>g spark-spread risk, it is less important whether the customer for the<br />
output of a CHP is either a load customer or the LDC or a comb<strong>in</strong>ation of the two, <strong>in</strong> any case<br />
the price received will be the market price and the important condition is that effective sparkspread<br />
risk mitigation is achieved under a contract with the Ontario Power Authority, which it is<br />
under a CHPSOP contract to the extent that the net economic efficiency equals or exceeds that<br />
of the OPA’s s virtual power plant, approximately 6,000 btu per kWh.<br />
7.1.9 Design<br />
Reliable Satisfaction of Customer <strong>Energy</strong> Demand<br />
It is critical that the plant and distribution systems be designed to reliably meet customer<br />
demand. This is important because failure to do so will seriously hamper future market<strong>in</strong>g<br />
success and profitability.<br />
Some lessons <strong>in</strong> risk mitigation may be ga<strong>in</strong>ed from the electric utility <strong>in</strong>dustry, which has<br />
developed sophisticated methods to evaluate system reliability or reserve requirements. Most<br />
electric utilities use one of the follow<strong>in</strong>g basic methods to evaluate system reliability and to<br />
determ<strong>in</strong>e the size of their generator reserve:<br />
Standard percentage reserve<br />
Loss of largest generator<br />
Loss of load probability<br />
Standard Percentage Reserve<br />
Standard percentage reserve is not applicable to DE as it is dependent on strongly<br />
<strong>in</strong>terconnected generation capacity with many resources.<br />
Loss of Largest Generator<br />
Loss of largest generator is applicable to DE and is the traditional method of determ<strong>in</strong><strong>in</strong>g system<br />
reliability (sometimes referred to as the “N + 1” philosophy).<br />
51
TRCA Pearson Eco-Bus<strong>in</strong>ess Zone <strong>District</strong> <strong>Energy</strong> <strong>Feasibility</strong> <strong>Study</strong> 10 April 2012<br />
Loss of Load Probability<br />
Loss of load probability has not had a wide application <strong>in</strong> DE; however, it may be more cost<br />
effective.<br />
Loss of load probability measures required reserve as a function of that probability which occurs<br />
whenever the demand exceeds the available generat<strong>in</strong>g capacity. The probability is <strong>in</strong>tended to<br />
express a measure of relative system reliability. The two important elements <strong>in</strong>volved <strong>in</strong><br />
calculat<strong>in</strong>g system reliability are a generation or capacity model and a load model.<br />
The capacity model establishes the probability of capacity available at different levels of load.<br />
The plant capacity available is developed from forced outage rates for each plant. The forced<br />
outage rate can be determ<strong>in</strong>ed from historical records, national experience and/or extrapolation<br />
of data for newer units.<br />
The load model establishes the probability of occurrence of a load at, or higher than a certa<strong>in</strong><br />
level. The load model is developed from historical records of daily peaks with adjustments for<br />
load growth. The load model can be represented by the historical load duration curve adjusted<br />
for projected growth.<br />
Plant reliability can be evaluated by multiply<strong>in</strong>g the probability that a level of capacity is<br />
available times the probability that a level of load occurs. The loss of the largest unit method<br />
does not predict system reliability therefore optimiz<strong>in</strong>g system reliability is not possible. It is<br />
possible to optimize system reliability with the loss of load probability method. In order to<br />
accomplish that, it is first important to determ<strong>in</strong>e what is acceptable system reliability. Relat<strong>in</strong>g<br />
system reliability levels to cost can help that determ<strong>in</strong>ation. Assur<strong>in</strong>g extremely reliable systems<br />
can be very expensive.<br />
Reliability of the distribution system is typically achieved through proper valve location, loop<strong>in</strong>g<br />
and pip<strong>in</strong>g material selection. The reliability of most exist<strong>in</strong>g DE service systems has been<br />
excellent.<br />
However, <strong>in</strong>adequate capacity due to design risks can occur and may result from a number of<br />
problems, <strong>in</strong>clud<strong>in</strong>g:<br />
Poor functionality of <strong>in</strong>tegrated system components due to a lack of expertise <strong>in</strong> DE<br />
Equipment quality problems<br />
Underestimation of customer energy demands<br />
Lower than anticipated thermal storage capacity<br />
Security of Supply of <strong>Energy</strong> Source<br />
This can be an issue where the heat is sourced from another party, especially an <strong>in</strong>dustrial<br />
source, or an <strong>in</strong>dependent CHP operator. The problem is that supply is cont<strong>in</strong>gent on factors<br />
that are not under the control of the DES, except to the limited contractual extent that might be<br />
negotiated by agreement.<br />
The planned heat energy source may shut down at some time <strong>in</strong> the future. This risk must be<br />
managed well <strong>in</strong> order to conv<strong>in</strong>ce customers to sign long term contracts. The short term<br />
impact can be managed through contractual protection of the purchase agreement between the<br />
energy source and the DES. This contractual protection would <strong>in</strong>volve a reasonable notice<br />
period, i.e., two or even five years, before service can be term<strong>in</strong>ated. The long term impact is<br />
mitigated by the planned replacement of the energy source with another source located near the<br />
distribution system.<br />
52
TRCA Pearson Eco-Bus<strong>in</strong>ess Zone <strong>District</strong> <strong>Energy</strong> <strong>Feasibility</strong> <strong>Study</strong> 10 April 2012<br />
Functionality of Design<br />
A successful DES requires the <strong>in</strong>tegration of plants, pip<strong>in</strong>g, valves, and pumps and <strong>in</strong> many<br />
cases thermal storage, <strong>in</strong>to a smoothly function<strong>in</strong>g whole. If the design team lacks experience<br />
and expertise <strong>in</strong> DE, the <strong>in</strong>tegrated components may not function effectively together.<br />
Equipment quality<br />
Risks related to equipment component design or manufactur<strong>in</strong>g can be m<strong>in</strong>imized by:<br />
Ensur<strong>in</strong>g that the design team is thoroughly familiar with district energy equipment and vendor<br />
alternatives<br />
Carefully develop<strong>in</strong>g equipment procurement contracts<br />
Underestimat<strong>in</strong>g <strong>Energy</strong> Demand<br />
As much as energy demand can be accurately anticipated, reliability risks associated with<br />
<strong>in</strong>adequate capacity and economic risks associated with over-capacity can be m<strong>in</strong>imized. The<br />
DE service contract should establish the peak energy capacity that the DES will deliver, based<br />
on stated climate conditions. However, there is a risk that extreme weather events beyond the<br />
stated conditions may occur and the system needs to make a conscious decision regard<strong>in</strong>g the<br />
safety marg<strong>in</strong> for extreme events.<br />
Low Thermal Storage Capacity<br />
Thermal storage systems are sometimes <strong>in</strong>corporated <strong>in</strong> DES to provide cost-effective peak<br />
capacity, <strong>in</strong>crease operational flexibility and reduce peak gas or electric demand. There is a risk<br />
that the reduction <strong>in</strong> peak gas or electric demand turns out to be lower than expected if the daily<br />
energy demand pattern is flatter than anticipated. This does not pose a threat to reliably<br />
meet<strong>in</strong>g customer peaks, but it would reduce the economic value of the system depend<strong>in</strong>g on<br />
the gas or electric rate structure.<br />
Design-Related Economic Risks<br />
There are also long-term economic risks associated with decisions made at the design stage,<br />
<strong>in</strong>clud<strong>in</strong>g:<br />
Installation of more plant capacity than required<br />
Reduced distribution system capacity due to <strong>in</strong>accurate estimation of the temperature difference<br />
(∆T) between supply and return<br />
Direct vs. <strong>in</strong>direct customer connections<br />
Control flexibility<br />
Overestimation of Plant Capacity Requirements<br />
Determ<strong>in</strong>ation of the appropriate plant capacity requires a solid understand<strong>in</strong>g of both the peak<br />
energy demand and the demand patterns of <strong>in</strong>dividual build<strong>in</strong>gs. It is common to f<strong>in</strong>d that the<br />
customer’s consult<strong>in</strong>g eng<strong>in</strong>eer overestimates the peak demand, based on prudent eng<strong>in</strong>eer<strong>in</strong>g<br />
factors which are designed to ensure that the build<strong>in</strong>g needs will always be met. While this<br />
approach is sensible from the standpo<strong>in</strong>t of the consult<strong>in</strong>g eng<strong>in</strong>eer, it generally results <strong>in</strong><br />
overestimation of the peak demand.<br />
Reduced Distribution Capacity<br />
The capacity of the distribution system is directly related to the ΔT between supply and return<br />
water. To the extent that the actual ΔT is lower than anticipated, the capacity of the distribution<br />
53
TRCA Pearson Eco-Bus<strong>in</strong>ess Zone <strong>District</strong> <strong>Energy</strong> <strong>Feasibility</strong> <strong>Study</strong> 10 April 2012<br />
system is dim<strong>in</strong>ished. The ΔT <strong>in</strong> a given build<strong>in</strong>g depends on the design and operation of the<br />
build<strong>in</strong>g energy system.<br />
Risks of <strong>in</strong>adequate ΔT can be m<strong>in</strong>imized by:<br />
Educat<strong>in</strong>g potential customers about the importance of ΔT<br />
Work<strong>in</strong>g with consult<strong>in</strong>g eng<strong>in</strong>eers dur<strong>in</strong>g the design phase to ensure proper design<br />
Implement<strong>in</strong>g ongo<strong>in</strong>g communication and tra<strong>in</strong><strong>in</strong>g with build<strong>in</strong>g operat<strong>in</strong>g personnel<br />
Address<strong>in</strong>g ΔT <strong>in</strong> the customer contract, potentially <strong>in</strong>clud<strong>in</strong>g penalties for low ΔT<br />
Further, pipe siz<strong>in</strong>g should have the ability to serve additional customer load from the<br />
comb<strong>in</strong>ation of production and storage capacity, which may <strong>in</strong>crease for various reasons.<br />
7.1.10 Construction<br />
Underground Congestion<br />
If exist<strong>in</strong>g underground services are congested then <strong>in</strong>tegration of the DES pip<strong>in</strong>g can become a<br />
significant construction hurdle, result<strong>in</strong>g <strong>in</strong> higher than anticipated costs. This risk can be<br />
mitigated by work<strong>in</strong>g closely with exist<strong>in</strong>g utilities and employ<strong>in</strong>g an experienced contractor. If<br />
reliable data on underground service locations is lack<strong>in</strong>g, safety marg<strong>in</strong>s should be <strong>in</strong>corporated<br />
<strong>in</strong>to the construction budget and schedule.<br />
Public Relations<br />
Construction of the DE distribution system results <strong>in</strong> disruptions which can pose public relations<br />
risks. The <strong>in</strong>convenience of restricted traffic and real or imag<strong>in</strong>ed harm to downtown<br />
bus<strong>in</strong>esses can lead to negative feel<strong>in</strong>gs by the public, downtown bus<strong>in</strong>esses and the city<br />
government. Proactively address<strong>in</strong>g potential concerns is <strong>in</strong>credibly important to ma<strong>in</strong>ta<strong>in</strong><strong>in</strong>g<br />
public support.<br />
Recommendations <strong>in</strong>clude:<br />
Communicate early and often with the potentially affected parties<br />
Include affected parties <strong>in</strong> plann<strong>in</strong>g<br />
Listen to and act on concerns whenever possible<br />
Limited construction access to public streets, such as night-time or weekend construction, can<br />
be imposed by the responsible government entity.<br />
Right-of-way Fees<br />
Another potential cost risk is additional fees for construction <strong>in</strong> city street rights-of-way. Cities<br />
generally view DE positively as an <strong>in</strong>vestment <strong>in</strong> downtown <strong>in</strong>frastructure. Right-of-way fees<br />
can reduce the competitiveness of DE so a balance of city objectives is necessary. This risk is<br />
mitigated if the grantor of the right-of-way is the same as the owner of the DES.<br />
Start Up Issues<br />
DES personnel would normally commission the system, together with the build<strong>in</strong>g operators.<br />
This <strong>in</strong>cludes the flush<strong>in</strong>g of the distribution system and start-up of control equipment. It is<br />
important to work closely with the build<strong>in</strong>g operators to avoid any problems dur<strong>in</strong>g this critical<br />
time.<br />
54
TRCA Pearson Eco-Bus<strong>in</strong>ess Zone <strong>District</strong> <strong>Energy</strong> <strong>Feasibility</strong> <strong>Study</strong> 10 April 2012<br />
General Construction Issues<br />
As with any other facility construction project there are risks associated with unforeseen<br />
conditions, accidents or contractor performance, lead<strong>in</strong>g to higher costs, delayed completion or<br />
quality control problems. These risks are addressed for DE <strong>in</strong> much the same way as they<br />
would be for any facility construction project:<br />
Us<strong>in</strong>g reputable contractors and vendors under strong contracts<br />
A thorough procedure of pre-operational equipment and system checks, <strong>in</strong>tegrated with the<br />
construction process<br />
This is especially critical for distribution system construction as this is a more specialized area<br />
and because of the high costs of rectify<strong>in</strong>g problems.<br />
Risks Measures to Control Risks<br />
Completion Turnkey contracts<br />
Liquidated damages<br />
Failure to meet specifications Performance bonds<br />
Costs over budget Control of change orders<br />
Force majeure and other delays Clear criteria for completion<br />
Completion undertak<strong>in</strong>g by<br />
proponents<br />
Thorough and timely report<strong>in</strong>g by<br />
project manager<br />
Table 14 Summary of Construction Risks<br />
7.1.11 Operations<br />
Reliable satisfaction of customer energy demand and system cost-effectiveness also has<br />
performance-related risk factors. Poor reliability performance can have devastat<strong>in</strong>g impacts on<br />
revenue generation and growth while higher than anticipated costs have obvious profitability<br />
implications. For the operational phase, key issues with both reliability and/or cost implications<br />
<strong>in</strong>clude:<br />
General operational competence<br />
Distribution system failure<br />
Low plant efficiency or other equipment performance deficiencies<br />
In addition, there is a potential liability risk associated with possible distribution system failure.<br />
General Operational Competence<br />
Ensur<strong>in</strong>g competent operations is critical, particularly <strong>in</strong> the start-up phase. These risks can be<br />
m<strong>in</strong>imized through a strong pre-operational tra<strong>in</strong><strong>in</strong>g program and employment of experienced<br />
DE operators.<br />
In the past it was not possible for many Canadian DES to recruit experienced personnel as<br />
there were fewer operational systems. However, as the <strong>in</strong>dustry has grown, the number of<br />
experienced operators has <strong>in</strong>creased. One good way to address this risk is to partner with a<br />
company that runs an exist<strong>in</strong>g DES.<br />
55
TRCA Pearson Eco-Bus<strong>in</strong>ess Zone <strong>District</strong> <strong>Energy</strong> <strong>Feasibility</strong> <strong>Study</strong> 10 April 2012<br />
Distribution System Failure<br />
A long term risk is excessive corrosion result<strong>in</strong>g from contam<strong>in</strong>ation or improper water treatment<br />
which results <strong>in</strong> a reduction <strong>in</strong> the distribution system life. Water loss due to failure of the<br />
distribution system results <strong>in</strong> reliability problems as well as an economic cost associated with<br />
refill<strong>in</strong>g the loop with treated water. Risks can be reduced through:<br />
Chemical clean<strong>in</strong>g and flush<strong>in</strong>g of build<strong>in</strong>g energy loops prior to start-up<br />
Us<strong>in</strong>g <strong>in</strong>direct connection where the primary distribution loop is separated from the customers<br />
<strong>in</strong>ternal systems with a heat exchanger<br />
A well-designed water treatment program us<strong>in</strong>g a reputable firm<br />
Low Production System Efficiency<br />
Lower than anticipated plant efficiency may result from problems <strong>in</strong>herent <strong>in</strong> the equipment or<br />
poor operational procedures. Poor performance by auxiliary systems can limit the capacity<br />
available for sale or the reliability of the production facility. Equipment risks can be m<strong>in</strong>imized<br />
through sound procurement contracts and performance guarantees. Operat<strong>in</strong>g procedures<br />
should be developed based on solid DE operational expertise and should be implemented <strong>in</strong><br />
conjunction with a strong staff tra<strong>in</strong><strong>in</strong>g program. Low efficiencies and result<strong>in</strong>g high costs can<br />
also occur <strong>in</strong> meet<strong>in</strong>g customer demand dur<strong>in</strong>g spr<strong>in</strong>g and fall, when loads are generally low but<br />
can be quite variable. Thermal storage helps overcome these problems. However, particularly<br />
<strong>in</strong> the early phases of system development, thermal storage may not be implemented. An<br />
alternative is to <strong>in</strong>clude a small production unit <strong>in</strong> the plant mix.<br />
Liability Due to Distribution Failure<br />
There is a potential risk associated with liability result<strong>in</strong>g from impacts on underground utilities<br />
or build<strong>in</strong>g property due to failure of the district loop or build<strong>in</strong>g systems (<strong>in</strong> direct-connected<br />
build<strong>in</strong>gs). This risk can be m<strong>in</strong>imized through good distribution system design and construction<br />
and strong coord<strong>in</strong>ation with build<strong>in</strong>g representatives dur<strong>in</strong>g design and start-up to ensure the<br />
<strong>in</strong>tegrity of all systems.<br />
Risks Measures to Control Risks<br />
Improper operation Operator Tra<strong>in</strong><strong>in</strong>g<br />
Equipment failures Warranties and Extended<br />
Ma<strong>in</strong>tenance Agreement<br />
Insurance protection<br />
<strong>Energy</strong> source shut-downs, Provide standby/ back up facilities<br />
planned or unplanned<br />
Force majeure by customer Customer Assessment<br />
Volatility of fuel prices Procurement of fuel under a fixed<br />
price contract for several forward<br />
years<br />
Effective fuel price pass through <strong>in</strong><br />
customer contract<br />
Table 15 Summary of Operations Technical Risks<br />
56
TRCA Pearson Eco-Bus<strong>in</strong>ess Zone <strong>District</strong> <strong>Energy</strong> <strong>Feasibility</strong> <strong>Study</strong> 10 April 2012<br />
Delays <strong>in</strong> Convert<strong>in</strong>g Exist<strong>in</strong>g Build<strong>in</strong>gs<br />
Initiation of DE service requires timely action not only by the utility system but also by the<br />
customer, who must convert his build<strong>in</strong>g system for <strong>in</strong>terface with the district loop. As a result,<br />
there are risks of reduced revenues due to delays <strong>in</strong> convert<strong>in</strong>g and connect<strong>in</strong>g build<strong>in</strong>gs.<br />
These risks can be reduced through ongo<strong>in</strong>g customer communication and technical assistance<br />
dur<strong>in</strong>g the build<strong>in</strong>g conversion process, as well as through contract provisions requir<strong>in</strong>g <strong>in</strong>itiation<br />
of payments at a date certa<strong>in</strong>.<br />
Meter<strong>in</strong>g<br />
Appropriate bill<strong>in</strong>g of utility customers requires accurate meter<strong>in</strong>g. Risks related to <strong>in</strong>accurate<br />
meter<strong>in</strong>g <strong>in</strong>clude:<br />
Low revenues, result<strong>in</strong>g <strong>in</strong> dim<strong>in</strong>ished profits<br />
High revenues, result<strong>in</strong>g <strong>in</strong> potential customer relations problems<br />
These risks can be m<strong>in</strong>imized through procurement of high-quality meters and a strong program<br />
for ma<strong>in</strong>ta<strong>in</strong><strong>in</strong>g them.<br />
In general, modern DES meter water flow us<strong>in</strong>g high quality meters that are very accurate. The<br />
electromagnetic flow meter (or magmeter) is a high quality meter. Magmeters have low<br />
pressure drops, good rangeability and accuracy, while requir<strong>in</strong>g very little ma<strong>in</strong>tenance.<br />
All thermal energy meters should comply with the Canadian Standards Association (CSA) heat<br />
meter<strong>in</strong>g standard (CSA C.900), as may be amended or replaced from time to time. This is an<br />
adaptation of European Standard EN1434 with Canadian deviations.<br />
Reduced Build<strong>in</strong>g Occupancy or Conservation Measures<br />
There are risks of reduced revenues due to reduced occupancy or implementation of energy<br />
conservation measures <strong>in</strong> customer build<strong>in</strong>gs. The extent of this risk depends on the rate<br />
structure. A One-part rate (as discussed earlier under Contracts and Pric<strong>in</strong>g, e.g. a price per<br />
MWh) exposes the DES to a variety of risks, <strong>in</strong>clud<strong>in</strong>g revenue reduction result<strong>in</strong>g from low<br />
occupancy rates or energy conservation measures. A Two-part rate can reduce or elim<strong>in</strong>ate<br />
these risks, depend<strong>in</strong>g on the specific rate structure and its relationship to costs.<br />
Build<strong>in</strong>g Shut-Down<br />
There are also risks of reduced revenues due to shut-down or demolition of customer build<strong>in</strong>gs.<br />
These risks can be m<strong>in</strong>imized through contractual provisions requir<strong>in</strong>g recovery of the cost of<br />
connect<strong>in</strong>g the build<strong>in</strong>g and other fixed costs which are unrecovered at the time of the shutdown<br />
or demolition.<br />
General Cost Risks<br />
As with any bus<strong>in</strong>ess, there are risks of <strong>in</strong>flation <strong>in</strong> operat<strong>in</strong>g costs. These risks can be<br />
m<strong>in</strong>imized through escalation provisions <strong>in</strong> the customer contract. Rates typically consist of<br />
various components which are either adjusted with fluctuations <strong>in</strong> the actual cost or by a<br />
standard <strong>in</strong>flation <strong>in</strong>dex. Each rate component and escalation provision would be set by<br />
contract. Fixed operation and ma<strong>in</strong>tenance costs would be escalated by <strong>in</strong>flation while fuel and<br />
other variable costs would be adjusted based on actual cost.<br />
Under the commonly used Two-part rate the fixed operation, ma<strong>in</strong>tenance and adm<strong>in</strong>istration<br />
costs and the fixed amortization costs may be comb<strong>in</strong>ed and all escalated by <strong>in</strong>flation.<br />
57
TRCA Pearson Eco-Bus<strong>in</strong>ess Zone <strong>District</strong> <strong>Energy</strong> <strong>Feasibility</strong> <strong>Study</strong> 10 April 2012<br />
General Credit Risks<br />
As with other energy service bus<strong>in</strong>ess, there are customer credit risks, which can be m<strong>in</strong>imized<br />
through the customer contract provisions allow<strong>in</strong>g service term<strong>in</strong>ation for non-payment, the<br />
post<strong>in</strong>g of bonds or payment of deposits.<br />
Rate of Growth<br />
The pr<strong>in</strong>cipal concern with rate of growth of a DES is that it could be too slow to atta<strong>in</strong> revenue<br />
targets and thereby achieve adequate return on the front-loaded <strong>in</strong>vestment. This risk is<br />
mitigated by careful design and market<strong>in</strong>g as outl<strong>in</strong>ed previously.<br />
Grow<strong>in</strong>g too fast would not generally be a problem with DE, except <strong>in</strong> the specific circumstance<br />
discussed briefly <strong>in</strong> the next few paragraphs. Generally system growth should be <strong>in</strong> response to<br />
specific customer contracts and not undertaken unless sufficient capacity can be economically<br />
provided to meet the new demand.<br />
It may be a problem to f<strong>in</strong>ance the capital required for system growth as fast as some<br />
prospective customers might desire. An <strong>in</strong>stance of this may occur if a potential customer has a<br />
time-sensitive demand, e.g. either new build<strong>in</strong>g construction or an exist<strong>in</strong>g build<strong>in</strong>g that urgently<br />
needs to replace heat<strong>in</strong>g or cool<strong>in</strong>g capacity.<br />
Difficult decisions may be needed if the <strong>in</strong>cremental capacity would trigger expansion of the<br />
generation or distribution assets. Required capital <strong>in</strong>vestment would have to be weighed<br />
aga<strong>in</strong>st not only the expected revenue from the potential immediate new customer(s) but also<br />
additional revenue possibilities that may be opened up by expansion.<br />
But the DES normally has no obligation to serve. Therefore, these decisions can be made<br />
freely accord<strong>in</strong>g to management’s determ<strong>in</strong>ation of what would be <strong>in</strong> best <strong>in</strong>terests of all<br />
concerned. In these cases, senior government fund<strong>in</strong>g assistance may be available, e.g.<br />
through the Federation of Canadian Municipalities, for the purpose of expand<strong>in</strong>g a DES to serve<br />
new customers.<br />
Stability of Customer Base<br />
The customer base of a DES is usually stable. With few exceptions, DE customers stay<br />
connected for the rema<strong>in</strong>der of the build<strong>in</strong>g life. If they were new build<strong>in</strong>gs to beg<strong>in</strong> with they<br />
would not have made provision for on-site heat<strong>in</strong>g and cool<strong>in</strong>g generation and retrofit would be<br />
difficult. Even if the build<strong>in</strong>gs orig<strong>in</strong>ally had onsite equipment, they may have been removed<br />
and the space used for some other purpose.<br />
This is not to say that a DE company can be complacent <strong>in</strong> its customer relations. On the<br />
contrary, proactive engagement of customers to ensure their on-go<strong>in</strong>g satisfaction is a hallmark<br />
of successful DES and an important part of the market<strong>in</strong>g mix for attraction of new customers.<br />
Control of Rates<br />
The ability to control rates is a key risk for a DES. DE is not a monopoly service and is usually<br />
and ideally, based on contracts voluntarily entered <strong>in</strong>to between equals. Customers tend to be<br />
a few owners of large build<strong>in</strong>gs, <strong>in</strong> contrast to many gas and electric utility customers who may<br />
be small residential customers with little barga<strong>in</strong><strong>in</strong>g power.<br />
The dynamics of DE price sett<strong>in</strong>g are such that prices are usually agreed <strong>in</strong> <strong>in</strong>dividual 20 year<br />
contracts, with def<strong>in</strong>ed escalation, on a one-to-one basis between the DES and <strong>in</strong>dividual<br />
customers prior to their commencement of service dates (which are usually not all co<strong>in</strong>cidental).<br />
58
TRCA Pearson Eco-Bus<strong>in</strong>ess Zone <strong>District</strong> <strong>Energy</strong> <strong>Feasibility</strong> <strong>Study</strong> 10 April 2012<br />
This dynamic does not lend itself efficiently to applications for rate revisions, e.g. to a prov<strong>in</strong>cial<br />
authority, which are more suitable for monopolies and rate applications that will affect many<br />
customers, most of whom have low barga<strong>in</strong><strong>in</strong>g power.<br />
In Canada, as far as we are aware, the only prov<strong>in</strong>cial rate regulator with jurisdiction over DE is<br />
the B.C. Utilities Commission. Even <strong>in</strong> BC, city owned utilities are self-regulated.<br />
There are a few cases known to FVB where DE companies have lost control of rates, e.g.<br />
where a customer or customers have significant local political <strong>in</strong>fluence. The results <strong>in</strong>clude<br />
<strong>in</strong>equitable treatment of other customers and a weakened f<strong>in</strong>ancial position for the DE provider<br />
lead<strong>in</strong>g to little or no expansion and therefore sub-optimal achievement of associated<br />
community goals such as energy self-sufficiency, susta<strong>in</strong>ability and economic development.<br />
One approach that can reduce this risk would be to establish a corporate governance structure<br />
for the DES early <strong>in</strong> the development process (i.e. ideally prior to the need to negotiate<br />
customer contracts). This would provide management with legal rights to support the decisions<br />
that the bus<strong>in</strong>ess needs to make, specifically buy<strong>in</strong>g and sell<strong>in</strong>g of energy, and price sett<strong>in</strong>g.<br />
Creat<strong>in</strong>g such a corporate structure allows for the development of a f<strong>in</strong>ancially healthy DES.<br />
<strong>Energy</strong> Commodity Prices<br />
<strong>Energy</strong> commodity prices are usually of the utmost concern to a DE company from the<br />
perspectives of both <strong>in</strong>put costs and customer avoided costs (which affect revenue possibilities).<br />
Over the 20 year life of a typical DE customer contract, both the <strong>in</strong>put energy costs and the<br />
avoided customer energy commodity costs may be the largest components of system costs on<br />
one side and revenue on the other. These costs are unpredictable and can be volatile.<br />
The most commonly used and effective energy commodity price risk mitigation measure is to<br />
adopt a price formula that “passes through” <strong>in</strong>put energy costs to the customers. In many<br />
cases, the customers will still enjoy some mitigation of commodity risk because the DES is more<br />
efficient, us<strong>in</strong>g less energy to provide the required thermal energy needed for heat<strong>in</strong>g and/or<br />
cool<strong>in</strong>g.<br />
As discussed <strong>in</strong> the section on Contracts and Pric<strong>in</strong>g, a Two Part Rate, consist<strong>in</strong>g of a Capacity<br />
Charge and an <strong>Energy</strong> Charge, with the <strong>Energy</strong> Charge tied to <strong>in</strong>put commodity costs, will<br />
protect the DE Company from commodity risk.<br />
The other major commodity price risk mitigation strategy is to <strong>in</strong>vest <strong>in</strong> more efficient and<br />
renewable energy technologies that m<strong>in</strong>imize dependence on energy commodities. This is<br />
someth<strong>in</strong>g that a DES can do on behalf of a whole community more effectively than could<br />
<strong>in</strong>dividual build<strong>in</strong>g owners due to economies of scale and site issues.<br />
For natural gas, commodity price risk mitigation together with many other factors relat<strong>in</strong>g to<br />
m<strong>in</strong>imization of delivery and storage costs would be managed better by a DES to the extent that<br />
economies of scale warrant more management attention, <strong>in</strong>clud<strong>in</strong>g employment of gas<br />
consultants.<br />
For electricity, there is usually less scope for supply management but sometimes scope for<br />
demand management. Aga<strong>in</strong>, the economies of scale of a district wide system may better<br />
justify demand management systems.<br />
59
TRCA Pearson Eco-Bus<strong>in</strong>ess Zone <strong>District</strong> <strong>Energy</strong> <strong>Feasibility</strong> <strong>Study</strong> 10 April 2012<br />
Risks Measures to Control Risks<br />
Failure of any of the participants<br />
whose commitments are relied<br />
upon to perform – (sponsors,<br />
contractors, suppliers, customers,<br />
<strong>in</strong>surers, guarantors)<br />
Performance bonds, letters of credit<br />
per requirements<br />
Involvement of experienced,<br />
competent participants <strong>in</strong> their<br />
respective fields, and, possibly,<br />
turn-key supply/design/build for<br />
power or comb<strong>in</strong>ed heat and power<br />
island)<br />
Credit worthy customers<br />
(government owned build<strong>in</strong>gs are<br />
considered to have high creditworth<strong>in</strong>ess)<br />
Closure of the <strong>Energy</strong> Source Contractual protection <strong>in</strong> energy<br />
purchase agreement<br />
Table 16 Summary of Operations Bus<strong>in</strong>ess Risks<br />
7.2 Risk Summary<br />
The matrix shown <strong>in</strong> Table 18 presents the relative impacts of each of n<strong>in</strong>e risk categories. .<br />
Risk Categories F<strong>in</strong>ancial Impact Operational Impact Customer Impact<br />
Plann<strong>in</strong>g High Low Low<br />
Market<strong>in</strong>g High Low Low<br />
Contracts and Pric<strong>in</strong>g Medium Low Medium<br />
Safety Low Medium Low<br />
Environmental Low Medium Low<br />
Other CHP Related Medium Medium Low<br />
Design Medium High High<br />
Construction High Low Low<br />
Operations Medium High High<br />
Table 17 Matrix Compar<strong>in</strong>g Risk Severity<br />
Assessment of Relative Risk Severity<br />
In any type of commercial utility DES, the market risk is usually one of the most important<br />
hazards to be managed. This arises from realities <strong>in</strong> this <strong>in</strong>dustry. The first is that revenue is<br />
absolutely <strong>in</strong>tr<strong>in</strong>sic. Without a credible projection of sufficient revenue the project will not<br />
proceed. If it does proceed and revenue proves to be <strong>in</strong>adequate there will be <strong>in</strong>sufficient return<br />
on <strong>in</strong>vestment<br />
The second reality is the high front ended nature of the <strong>in</strong>vestment. Once this money is spent,<br />
the economics would be adversely affected should revenue-generat<strong>in</strong>g load fail to be realized.<br />
60
TRCA Pearson Eco-Bus<strong>in</strong>ess Zone <strong>District</strong> <strong>Energy</strong> <strong>Feasibility</strong> <strong>Study</strong> 10 April 2012<br />
The best way to mitigate this risk is to sign sufficient long term customer contracts with fixed<br />
capacity charges before proceed<strong>in</strong>g with implementation of the new DES. However, <strong>in</strong> the case<br />
of greenfield DES rely<strong>in</strong>g on new development, this risk mitigation strategy is not entirely <strong>in</strong> the<br />
control of the DES. The DES developer’s assessment of this risk is <strong>in</strong>fluenced by their level of<br />
confidence <strong>in</strong> the market for the new development.<br />
Another major risk is over <strong>in</strong>vestment. In general, well managed DES practice “just-<strong>in</strong>-time<strong>in</strong>vestment”,<br />
i.e. they attempt to defer <strong>in</strong>vestment until just before the related revenue<br />
generat<strong>in</strong>g load commences service. This can be done with the energy transfer stations and<br />
branch service related pip<strong>in</strong>g, but to a less extent with the ma<strong>in</strong> distribution pipel<strong>in</strong>e and the<br />
energy source.<br />
The commodity risk is an important specific gamble for the DES as it will be buy<strong>in</strong>g and sell<strong>in</strong>g<br />
energy <strong>in</strong> various forms related to commodity prices. Care must be taken that the energy<br />
purchase and sales agreements match sufficiently well <strong>in</strong> terms of future changes <strong>in</strong> price. It is<br />
very important that the customer’s agreements achieve appropriate conta<strong>in</strong>ment and/or lay-off<br />
of risk. Proper structures for pric<strong>in</strong>g and term that make the project return <strong>in</strong>sensitive to<br />
commodity prices and actual volumes of energy produced and sold provide an effective<br />
mitigation strategy if implemented accurately.<br />
7.3 Regulatory Issues<br />
There are some legal and regulatory issues that are specific to the district energy <strong>in</strong>dustry. The<br />
follow<strong>in</strong>g discussion is complementary to a Risk Management Plan as these issues need to be<br />
understood and addressed by DE proponents.<br />
7.3.1 City Policy<br />
Generally, cities have become more and more supportive of DE development, which is aligned<br />
with other policies aimed at build<strong>in</strong>g a high density, mixed use built form and conta<strong>in</strong><strong>in</strong>g sprawl.<br />
7.3.2 Ownership and Operat<strong>in</strong>g Issues<br />
The most likely ownership and operat<strong>in</strong>g model is a municipally owned corporation. The<br />
precedents <strong>in</strong>clude Markham <strong>District</strong> <strong>Energy</strong> Inc., which is owned by Markham Enterprise<br />
Corporation.<br />
A detailed review of the Municipal Act was not undertaken for this study. However, it is<br />
assumed that follow<strong>in</strong>g the precedent of Markham <strong>District</strong> <strong>Energy</strong> that there are no restrictions<br />
on the powers of either of the cities that would prevent them from <strong>in</strong>corporat<strong>in</strong>g and operat<strong>in</strong>g a<br />
DES under the contemplated ownership and operat<strong>in</strong>g model.<br />
Ownership, <strong>in</strong> part or whole, of any bus<strong>in</strong>ess implies legal liability, but there are ways to shield<br />
the owners of an enterprise from legal liability.<br />
The norm <strong>in</strong> the district energy <strong>in</strong>dustry is for terms and conditions of service to customers to be<br />
specified <strong>in</strong> an <strong>Energy</strong> Service Agreement (ESA). The ESA typically provides for exclusivity and<br />
fixed payments from the customer <strong>in</strong> return for firm capacity be<strong>in</strong>g provided by the supplier, with<br />
a term of 20 years and automatic renewal unless 2 years notice is given that a party wishes not<br />
to renew.<br />
The customers typically <strong>in</strong>clude corporations or <strong>in</strong>stitutions that have the ability to act as<br />
counter-parties to such agreements. The district energy company ownership and operat<strong>in</strong>g<br />
61
TRCA Pearson Eco-Bus<strong>in</strong>ess Zone <strong>District</strong> <strong>Energy</strong> <strong>Feasibility</strong> <strong>Study</strong> 10 April 2012<br />
model must provide governance and management staff with the capability to negotiate and<br />
execute such agreements.<br />
The ESA shields the utility from unreasonable risk from failure to supply due to Force Majeure<br />
events, necessary system ma<strong>in</strong>tenance or safety; the ESA def<strong>in</strong>es the liability, remedies and<br />
cure periods.<br />
An additional protection would be the corporation. A corporation is usually exclusively<br />
responsible for its debts and liabilities. The operational advantage of creat<strong>in</strong>g a corporation is to<br />
allow the DES to enter contracts to sell services and to raise debt. This avoids confusion that<br />
might be caused by the bus<strong>in</strong>ess be<strong>in</strong>g conducted <strong>in</strong> the name of the City on behalf of the DES.<br />
There might be City policies, e.g. procurement policies, which would create complications for<br />
the DES.<br />
7.3.3 Electricity Generation or Sales Related To<br />
The generation, transmission, distribution and sale of electricity <strong>in</strong> Canada has traditionally been<br />
closely regulated and often legally restricted to specific utilities. These laws and regulations<br />
may impact a DES that <strong>in</strong>cludes Comb<strong>in</strong>ed Heat & Power (CHP).<br />
The extent and nature of this impact will depend on the technical concept.<br />
Connection requirements would have to be discussed with Enersource.<br />
Affiliate Approval by Ontario <strong>Energy</strong> Board (OEB)<br />
Any generation project developed by an affiliate of a Local (Gas or Electric) Distribution<br />
Company requires the approval of the Ontario <strong>Energy</strong> Board pursuant to Section 80 of the<br />
Ontario <strong>Energy</strong> Board Act.<br />
Generator License<br />
All generators (above 1 MWe) connected to the electricity grid are required to obta<strong>in</strong> a<br />
Generator License regardless of whether they are to become a Market Participant.<br />
Retail License<br />
A retail license may be required if power is to be sold directly to a customer for his own use.<br />
Connection<br />
A Power Generator will be required to enter <strong>in</strong>to a Connection Agreement with the Local<br />
Distribution Company (<strong>in</strong> this case, Enersource). A Connection Impact Assessment must be<br />
completed and before connection of any electrical generat<strong>in</strong>g asset to the prov<strong>in</strong>cial power grid.<br />
Contact with the local utility at an early stage is recommended.<br />
Market Participation<br />
An Embedded Generator that settles at the retail level with the Local Distribution Company is<br />
not required to become a Market Participant.<br />
Wholesale Meter<strong>in</strong>g<br />
Current rules require that all generation, 1 MWe and above, be metered with Wholesale<br />
Meter<strong>in</strong>g equipment per the current Market Rules <strong>in</strong> order to establish net and gross quantities<br />
for transmission charges. To expla<strong>in</strong>, the gross quantity a customer consumes <strong>in</strong> kW, whether<br />
supplied by the grid or by an embedded generator, determ<strong>in</strong>es the load customer’s<br />
Transmission Connection Charge (as opposed to the Transmission Network charge that can be<br />
62
TRCA Pearson Eco-Bus<strong>in</strong>ess Zone <strong>District</strong> <strong>Energy</strong> <strong>Feasibility</strong> <strong>Study</strong> 10 April 2012<br />
billed net of the generator output, as noted above <strong>in</strong> the discussion on parallel or series<br />
connection).<br />
7.3.4 Ontario M<strong>in</strong>istry of Environment Regulations<br />
The follow<strong>in</strong>g M<strong>in</strong>istry of Environment (MOE) regulations and guidel<strong>in</strong>es might potentially apply<br />
to the proposed project.<br />
Regulation 116/01 – Environmental Assessment Requirements for Electricity <strong>Project</strong>s<br />
Regulation 419/05 – Air Pollution – Local Air Quality<br />
Guidel<strong>in</strong>e A-9 – NOX Emissions from Boilers-Heaters<br />
Guidel<strong>in</strong>e A-10 - Procedure for Prepar<strong>in</strong>g an Emission Summary and Dispersion Model<strong>in</strong>g Report<br />
Guidel<strong>in</strong>e A-12 – Guidel<strong>in</strong>e for the Implementation of Air Standards <strong>in</strong> Ontario (GIASO)<br />
Guidel<strong>in</strong>e for the Installation and Operation of Cont<strong>in</strong>uous Emission Monitor<strong>in</strong>g Systems and their<br />
use for report<strong>in</strong>g under the provisions of O. Reg. 127/01<br />
More detail about each regulation can be found <strong>in</strong> Appendix K. The review found that several<br />
MOE regulations and guidel<strong>in</strong>es would possibly apply to a proposed DES with or without a CHP<br />
facility.<br />
Our review of Reg. 116/01 identified that a gas-fired CHP facility of the size anticipated to be<br />
used for DE <strong>in</strong> <strong>Project</strong> <strong>Green</strong> would not require an EA.<br />
Even if a biomass fired plant was to be established later there is a low probability that the<br />
proposed CHP facility would require an EA; specifically, if either someone requests it, or the<br />
facility requires approval under Section 27 of the Environmental Protection Act, because it<br />
requires establishment of a waste management system or disposal site.<br />
A Certificate of Approval – Air & Noise is required from the MOE before construction of the CHP<br />
system. In order to evaluate if the proposed CHP system will demonstrate compliance to Reg.<br />
419/05 predictive air dispersion model<strong>in</strong>g and a noise assessment (as m<strong>in</strong>imum) will be<br />
required.<br />
7.4 F<strong>in</strong>anc<strong>in</strong>g Issues<br />
The follow<strong>in</strong>g sections provide <strong>in</strong>formation on those fund<strong>in</strong>g sources that FVB believes based<br />
on previous <strong>in</strong>dustry experience would be most applicable for this DES.<br />
The different types of f<strong>in</strong>anc<strong>in</strong>g that could be used to develop and construct the DES can be<br />
categorized as:<br />
Grants<br />
Loans<br />
Equity<br />
7.4.1 Grants<br />
The Government of Canada’s Build<strong>in</strong>g Canada Plan is currently the major source of potential<br />
grants to develop DES. This is a $33-billion long-term <strong>in</strong>frastructure <strong>in</strong>itiative and is <strong>in</strong>tended to<br />
provide grants of up to several million dollars. Such a grant could form a solid base from which<br />
to assemble the total project f<strong>in</strong>anc<strong>in</strong>g mix.<br />
Grants may also be available from the <strong>Green</strong> Municipal Fund (GMF), adm<strong>in</strong>istered by the<br />
Federation of Canadian Municipalities (FCM). S<strong>in</strong>ce the ultimate source of funds is the same as<br />
for the Build<strong>in</strong>g Canada Plan (i.e. the federal government), discussions with the adm<strong>in</strong>istrators<br />
of both regard<strong>in</strong>g a specific project would be <strong>in</strong> order. The likely eligibility of a specific project to<br />
63
TRCA Pearson Eco-Bus<strong>in</strong>ess Zone <strong>District</strong> <strong>Energy</strong> <strong>Feasibility</strong> <strong>Study</strong> 10 April 2012<br />
receive assistance from both sources would need to be determ<strong>in</strong>ed. An optimal plan might be<br />
to use GMF grants dur<strong>in</strong>g the development stage and some form of the Build<strong>in</strong>g Canada Plan<br />
for construction.<br />
The GMF also provides loans. These could play a useful supplementary f<strong>in</strong>anc<strong>in</strong>g role to grants<br />
as they are usually cost shar<strong>in</strong>g and not for the total project capital required.<br />
<strong>Green</strong> Infrastructure Fund<br />
The <strong>Green</strong> Infrastructure Fund (GIF), part of the Build<strong>in</strong>g Canada Plan, is <strong>in</strong>tended to support<br />
projects on a cost shared basis. For example, <strong>in</strong> February, 2010, it was announced that the GIF<br />
would provide f<strong>in</strong>ancial support to the City of Sa<strong>in</strong>t John, New Brunswick of up to $9.8 million, a<br />
maximum of one third of the capital costs for construction of a DES. FVB assisted the City of<br />
Sa<strong>in</strong>t John <strong>in</strong> describ<strong>in</strong>g the project, capital cost estimates and benefits.<br />
Early, this year the federal government offered the City of Yellowknife a $14 million grant from<br />
the Clean <strong>Energy</strong> Fund to develop a DES.<br />
The application process starts with a letter describ<strong>in</strong>g the project which, if favourably received is<br />
to be followed up with a more detailed project description. The City may be <strong>in</strong> a position to<br />
<strong>in</strong>itiate the application process follow<strong>in</strong>g this feasibility study and as soon as the technical<br />
concept is identified.<br />
Although other entities, <strong>in</strong>clud<strong>in</strong>g private companies and the Prov<strong>in</strong>ce, are eligible recipients of<br />
assistance under the GIF, a municipality has an especially strong position with respect to DES<br />
as it controls access to rights of way. Any other party would have to secure a municipal access<br />
agreement for the DPS and therefore would require support from the municipality.<br />
The fact that the GIF would probably only fund a part, e.g. <strong>in</strong> some cases a maximum of onethird,<br />
of the project cost implies the ownership and f<strong>in</strong>anc<strong>in</strong>g structure must provide for other<br />
sources of fund<strong>in</strong>g, which may be some comb<strong>in</strong>ation of those described below.<br />
Gas Tax Fund<br />
The Gas Tax Fund (GTF) is another facet of the Build<strong>in</strong>g Canada Plan, which <strong>in</strong>cludes green<br />
energy <strong>in</strong> its focus.<br />
The GTF targets municipalities, exclusively. As an example, the Association of Municipalities of<br />
Ontario awarded its Federal Gas Tax Award <strong>in</strong> 2009 to Markham Council recogniz<strong>in</strong>g excellent<br />
use of GTF, related to Markham’s district energy project, to a large extent designed by FVB.<br />
This source of f<strong>in</strong>anc<strong>in</strong>g would be available only to ownership structures that <strong>in</strong>cluded the City.<br />
S<strong>in</strong>ce its ultimate source is also the Build<strong>in</strong>g Canada Plan, further consultation with<br />
adm<strong>in</strong>istrators of these funds would be recommended <strong>in</strong> order to optimize application for<br />
fund<strong>in</strong>g.<br />
Public Private <strong>Partners</strong>hips<br />
Any project seek<strong>in</strong>g fund<strong>in</strong>g over $50 million under the Build<strong>in</strong>g Canada Plan will be required to<br />
assess the viability of a public private partnership (P3). Fund<strong>in</strong>g assistance is usually not<br />
required <strong>in</strong> the early stages of DE projects because they tend to start small and take many<br />
years to build-out.<br />
7.4.2 Loans<br />
There are different sources of loans potentially available under different ownership models:<br />
64
TRCA Pearson Eco-Bus<strong>in</strong>ess Zone <strong>District</strong> <strong>Energy</strong> <strong>Feasibility</strong> <strong>Study</strong> 10 April 2012<br />
Infrastructure Ontario (IO)<br />
Federation of Canadian Municipalities (FCM)<br />
Commercial Lenders<br />
It should be understood that the pr<strong>in</strong>cipal and <strong>in</strong>terest payments required for any loan must be<br />
paid from the gross profits of the DES.<br />
Infrastructure Ontario<br />
The Infrastructure Ontario (IO) Loan Program is <strong>in</strong>tended for municipalities, universities and<br />
other public sector partners <strong>in</strong> support of modern and efficient public <strong>in</strong>frastructure development.<br />
It has committed to provide over $2.4 billion, of which over $2 billion has been advanced to<br />
date.<br />
Whereas, from recent news reports, it would appear that Prov<strong>in</strong>cial f<strong>in</strong>ances are tight, the capital<br />
amount that could make a crucial difference to development of a DES would be small relative to<br />
the previous commitments.<br />
IO is <strong>in</strong> the process of consider<strong>in</strong>g fund<strong>in</strong>g for at least one other DE development that would be<br />
of a comparable scope to that envisaged for the Pearson Area. Hence, it has moved up the DE<br />
learn<strong>in</strong>g curve to an extent, which may make it more amenable to another DE fund<strong>in</strong>g<br />
application.<br />
Clearly, the implication for ownership structure is that a municipality, or some other public entity,<br />
would have to be <strong>in</strong>volved <strong>in</strong> order to receive IO fund<strong>in</strong>g.<br />
Federation of Canadian Municipalities (FCM)<br />
The GMF, adm<strong>in</strong>istered by FCM, was established by the Government of Canada <strong>in</strong> its 2000<br />
budget to stimulate <strong>in</strong>vestment <strong>in</strong> <strong>in</strong>novative municipal environmental projects that advance the<br />
progress of susta<strong>in</strong>able development.<br />
<strong>District</strong> energy is one of the target sectors for GMF, which can provide up to 80 per cent of costs<br />
to a maximum of $4 million <strong>in</strong> loans comb<strong>in</strong>ed with up to $400,000 <strong>in</strong> grants.<br />
The GMF loans are very attractive, offer<strong>in</strong>g <strong>in</strong>terest rates 1.5% lower than the Government of<br />
Canada bond rate for the equivalent term.<br />
The GMF is <strong>in</strong>tended to be a revolv<strong>in</strong>g fund which limits the pr<strong>in</strong>cipal to $4 million and the term<br />
to 10 years; this may not be enough to entirely fund a DES start-up. But it could be useful as a<br />
component of an overall f<strong>in</strong>anc<strong>in</strong>g mix.<br />
An <strong>in</strong>terest<strong>in</strong>g feature of the GMF loans that has been discussed with FCM officials is the<br />
possibility, subject to appropriate due diligence, of the GMF loan function<strong>in</strong>g as mezzan<strong>in</strong>e<br />
f<strong>in</strong>anc<strong>in</strong>g. This means it would rank ahead of equity but subord<strong>in</strong>ate to commercial debt. The<br />
benefit this br<strong>in</strong>gs is to make it easier to secure commercial debt or, <strong>in</strong> other words, less equity<br />
may be have to be put up to satisfy a commercial lender. Us<strong>in</strong>g this approach if GIF can be<br />
secured, a $30 million project might be f<strong>in</strong>anced as illustrated <strong>in</strong> Figure 4<br />
Caution; Figure 4 is only a hypothetical illustration of how a $30 million project such as this one<br />
might be f<strong>in</strong>anced from a mix of sources – the f<strong>in</strong>ancial feasibility of this specific project can only<br />
be determ<strong>in</strong>ed follow<strong>in</strong>g confirmation of pric<strong>in</strong>g and project scope follow<strong>in</strong>g a market<strong>in</strong>g program<br />
and discussions with representatives of GIF and GMF and potential conventional lenders.<br />
65
TRCA Pearson Eco-Bus<strong>in</strong>ess Zone <strong>District</strong> <strong>Energy</strong> <strong>Feasibility</strong> <strong>Study</strong> 10 April 2012<br />
35 Million $<br />
30 Million $<br />
25 Million $<br />
20 Million $<br />
15 Million $<br />
10 Million $<br />
5 Million $<br />
0 Million $<br />
Illustrative DES F<strong>in</strong>anc<strong>in</strong>g<br />
decreas<strong>in</strong>g<br />
priority of<br />
payment<br />
66<br />
10 Million $<br />
6 Million $<br />
4 Million $<br />
10 Million $<br />
1<br />
GIF<br />
Equity<br />
GMF<br />
Figure 4 Illustrative F<strong>in</strong>anc<strong>in</strong>g Mix<br />
Conventional<br />
Debt<br />
The above illustration is <strong>in</strong>tended to show that a comb<strong>in</strong>ation of a GIF grant and a GMF loan<br />
would reduce the amount of equity and conventional debt needed to levels that may make the<br />
IRR on Equity attractive for private <strong>in</strong>vestors.<br />
Another <strong>in</strong>trigu<strong>in</strong>g possibility that has been discussed <strong>in</strong> the past with FCM officials is shap<strong>in</strong>g<br />
repayments with a balloon payment at the end of the term, which could be 10 years. The<br />
benefit is that DES cash flow usually grows over time. The first few years are the most<br />
challeng<strong>in</strong>g for mak<strong>in</strong>g debt repayments. But by about year 10 the DES would have several<br />
options to retire the balloon payment, <strong>in</strong>clud<strong>in</strong>g more commercial debt or more equity from<br />
partners.<br />
This is illustrated <strong>in</strong> Figure 5 below which is <strong>in</strong>tended to shows that as a DES becomes<br />
established the availability of conventional f<strong>in</strong>anc<strong>in</strong>g improves and the cost decreases.<br />
<strong>Project</strong> Stage<br />
- ><br />
Bus<strong>in</strong>ess Case<br />
- ><br />
Availability of<br />
F<strong>in</strong>anc<strong>in</strong>g<br />
Cost of<br />
F<strong>in</strong>anc<strong>in</strong>g<br />
<strong>Feasibility</strong> <strong>Project</strong><br />
Def<strong>in</strong>ition<br />
In Operation<br />
Embryonic Firm<strong>in</strong>g Up Strong<br />
Low Moderate High<br />
High Moderate Low<br />
Figure 5 Risk of DES vs Stage of <strong>Project</strong><br />
As the level of municipal ownership <strong>in</strong>creases so does the prospects for GMF fund<strong>in</strong>g.
TRCA Pearson Eco-Bus<strong>in</strong>ess Zone <strong>District</strong> <strong>Energy</strong> <strong>Feasibility</strong> <strong>Study</strong> 10 April 2012<br />
Commercial Lenders<br />
Commercial lenders, e.g. banks, <strong>in</strong>surance companies or pension funds, may be a source of<br />
f<strong>in</strong>anc<strong>in</strong>g. When and if available they would be at a higher cost and subject to much more<br />
onerous terms than government f<strong>in</strong>anc<strong>in</strong>g. For example, based on Infrastructure Ontario’s high<br />
credit rat<strong>in</strong>g, its cost of capital tends to be lower and can pass on this advantage to its<br />
borrowers.<br />
But if commercial debt is available for a project it should cost less than private equity. For<br />
illustration, a lender might charge a premium of 2% on Government of Canada 10 year bonds,<br />
which are currently under 3%, so the <strong>in</strong>terest rate could be <strong>in</strong> the order of 5%. The after tax<br />
cost of debt would be even lower for a private company because <strong>in</strong>terest on debt is a tax<br />
deduction, so <strong>in</strong> the case of this example it could be <strong>in</strong> the order of 4%, which is considerably<br />
less costly than the rate of return required by private equity (see below).<br />
A rigorous process is <strong>in</strong>volved <strong>in</strong> obta<strong>in</strong><strong>in</strong>g long-term debt from commercial lenders <strong>in</strong> a<br />
sufficient amount to f<strong>in</strong>ance a large portion of a DES, which could have a total project cost <strong>in</strong> the<br />
range of $20-30 million. It would <strong>in</strong>volve <strong>in</strong>dependent due diligence studies by the lender, paid<br />
for by the applicant with no certa<strong>in</strong>ty of a positive result.<br />
Lend<strong>in</strong>g agreements can cover many issues, <strong>in</strong>clud<strong>in</strong>g term, <strong>in</strong>terest rate, security, debt<br />
coverage ratio, sweeps (the lender has the right to sweep up all the available cash flow if certa<strong>in</strong><br />
performance factors are not achieved). But the complexity of a lend<strong>in</strong>g agreement is not the<br />
most challeng<strong>in</strong>g issue. The primary issue is whether a lender would be will<strong>in</strong>g to lend money<br />
for a DES start-up with all of the associated uncerta<strong>in</strong>ties, especially if the cash flow is weak for<br />
the first few years, which is often the case.<br />
The availability of conventional f<strong>in</strong>anc<strong>in</strong>g will be improved if the bus<strong>in</strong>ess case can be firmed up<br />
and also if other sources of fund<strong>in</strong>g are l<strong>in</strong>ed up after the conventional debt <strong>in</strong> order of<br />
repayment, e.g. grants, equity and GMF loans as illustrated <strong>in</strong> Figure 6.<br />
It is uncerta<strong>in</strong> whether a DES start up <strong>in</strong> a specific situation can be f<strong>in</strong>anced by a private<br />
company without government assistance. Based on experience <strong>in</strong> Canada, it appears that<br />
government fund<strong>in</strong>g is usually needed. Whereas it is possible for a private company to receive<br />
government assistance, it seems to be easier for a prov<strong>in</strong>ce or a municipality.<br />
The implication is that the ownership model must probably <strong>in</strong>volve the Prov<strong>in</strong>ce, the City or both<br />
<strong>in</strong> order to raise sufficient f<strong>in</strong>anc<strong>in</strong>g for the start-up. Commercial debt may then have a role, as<br />
illustrated <strong>in</strong> Figure 6.<br />
In conclusion, commercial debt f<strong>in</strong>anc<strong>in</strong>g might be available for the start-up phase of a DES if<br />
there is sufficient committed revenue from customers who have signed firm long-term contracts.<br />
The prior commitment of government grants and subord<strong>in</strong>ate debt from FCM could improve the<br />
prospects for rais<strong>in</strong>g commercial debt. Prov<strong>in</strong>cial or municipal <strong>in</strong>volvement would enhance the<br />
prospects of obta<strong>in</strong><strong>in</strong>g loans. And obviously a loan guarantee from the City or Prov<strong>in</strong>ce would<br />
help considerably.<br />
However, loans from commercial entities should be contemplated only when government<br />
sourced loan capacity has been exhausted or is unavailable.<br />
7.4.3 Equity<br />
Equity means money <strong>in</strong>vested by shareholders who will be repaid last from any profits.<br />
67
TRCA Pearson Eco-Bus<strong>in</strong>ess Zone <strong>District</strong> <strong>Energy</strong> <strong>Feasibility</strong> <strong>Study</strong> 10 April 2012<br />
Equity <strong>in</strong>vestment is probably a necessary component regardless of the ownership option<br />
because neither grants nor debt, nor a comb<strong>in</strong>ation of the two can usually be expected to<br />
provide 100% of the required capital. In other words, any grantor or lender usually wants to see<br />
a proponent have some of their own money at risk. If there wasn’t, the determ<strong>in</strong>ation and<br />
commitment of the proponent to ensure a successful outcome would be questionable.<br />
Therefore, it is expected that the owner(s) will have to commit some equity as a condition for<br />
receiv<strong>in</strong>g any grants or loans 11<br />
. Further work on f<strong>in</strong>anc<strong>in</strong>g, i.e. with potential grantors and<br />
lenders, will be required to determ<strong>in</strong>e the amount of equity required. This study has assumed<br />
40% equity on approximately $30 million, approximately $12 million.<br />
There are several multi-DES owners that may be <strong>in</strong>terested <strong>in</strong> own<strong>in</strong>g another DES, but the<br />
issue is whether they would want to be <strong>in</strong>volved <strong>in</strong> development and start-up. These <strong>in</strong>clude<br />
Enwave, Dalkia, NRG, Fort Chicago and Corix. The local utilities, Enersource and Enbridge<br />
may also have an <strong>in</strong>terest.<br />
Given the usual municipal requirement for competitive procurement, the <strong>in</strong>terest of any outside<br />
potential owner or partner <strong>in</strong> this specific project might have to be confirmed through a b<strong>in</strong>d<strong>in</strong>g<br />
RFP process, once the feasibility study has developed a reasonably clear def<strong>in</strong>ition of scope<br />
and potential revenues.<br />
If any private equity f<strong>in</strong>anc<strong>in</strong>g were made available at an early stage, it is expected that it would<br />
be expensive. The project start-up hurdle rate for a private company is likely <strong>in</strong> the range of 15<br />
– 20%, or more. Even allow<strong>in</strong>g for some expected leverage with lower cost debt f<strong>in</strong>anc<strong>in</strong>g, the<br />
percentage share required by private equity early on is likely to be high relative to the amount of<br />
money that is contributed (as compared with a case where the DES is generat<strong>in</strong>g significant<br />
revenues).<br />
At a later stage, when more customers have signed contracts, the project scope becomes better<br />
def<strong>in</strong>ed. Then, after firm quotations have been received from suppliers and contractors, the<br />
cost estimates can be ref<strong>in</strong>ed and the expectation of leverage with debt f<strong>in</strong>anc<strong>in</strong>g is higher. At<br />
that stage, the risk would be lower so an equity <strong>in</strong>vestor would be will<strong>in</strong>g to accept a lower<br />
return.<br />
F<strong>in</strong>ally, when the DES is built and up and runn<strong>in</strong>g so that market risks and completion risks<br />
have been largely elim<strong>in</strong>ated and long-term f<strong>in</strong>anc<strong>in</strong>g is <strong>in</strong> place, the cost of private equity could<br />
be similar to a utility rate of return, i.e. <strong>in</strong> the range of 8-12%.<br />
S<strong>in</strong>ce only modest rates of return are generally achievable <strong>in</strong> DE (<strong>in</strong> order to provide competitive<br />
service charges to customers), it is difficult to develop a viable DES project yield<strong>in</strong>g acceptable<br />
rates of return for private equity subject to significant risk, even with committed customers. This<br />
difficulty is reflected <strong>in</strong> the recent history of DES development <strong>in</strong> Canada, which has tended to<br />
be driven by government at the start-up phases with private <strong>in</strong>vestment com<strong>in</strong>g <strong>in</strong> later.<br />
In one case, <strong>in</strong>terviews of about a dozen possible <strong>in</strong>vestors to gauge the appetite of the <strong>in</strong>dustry<br />
for a DES start-up <strong>in</strong> a brown field situation confirmed there was limited <strong>in</strong>terest prior to<br />
customer commitments. Nevertheless, several expressions of <strong>in</strong>terest were submitted but s<strong>in</strong>ce<br />
the process did not cont<strong>in</strong>ue through the b<strong>in</strong>d<strong>in</strong>g proposal stage, it is difficult to say what the<br />
real availability of capital would be <strong>in</strong> this situation.<br />
11<br />
Application can made at an early stage, on the understand<strong>in</strong>g that grant funds would flow on a strictly<br />
cost shar<strong>in</strong>g basis.<br />
68
TRCA Pearson Eco-Bus<strong>in</strong>ess Zone <strong>District</strong> <strong>Energy</strong> <strong>Feasibility</strong> <strong>Study</strong> 10 April 2012<br />
This pattern is likely to cont<strong>in</strong>ue, i.e. more private <strong>in</strong>volvement <strong>in</strong> established DES, while the<br />
majority of new projects will cont<strong>in</strong>ue to be driven by municipalities, often with fund<strong>in</strong>g support<br />
from senior levels of government. Any private <strong>in</strong>vestment <strong>in</strong> a DES will probably cont<strong>in</strong>ue to be<br />
measured <strong>in</strong> relation to customer contracts or other very strong assurances of revenue.<br />
7.4.4 Ontario Power Authority Contracts<br />
CHP is one of the most promis<strong>in</strong>g energy sources for a DE <strong>in</strong> the Pearson Area. This would be<br />
predicated on suitable contracts with the Ontario Power Authority (OPA).<br />
OPA contracts are important for natural gas fired generation to mitigate spark-spread risk. The<br />
OPA has <strong>in</strong>itiated a CHPSOP and has offered contracts under this program to other FVB<br />
clients. The CHPSOP contracts are not power purchase agreements (PPA) <strong>in</strong> the conventional<br />
sense, but rather contracts to provide the Prov<strong>in</strong>ce with capacity. The OPA commits to support<br />
payments to adjust the actual market net revenue to a stated level related to capacity,<br />
specifically $28, 9000 per MWe per month.<br />
The OPA has awarded contracts of this type follow<strong>in</strong>g a RFP process to CHP associated with<br />
DES <strong>in</strong> Markham, Oshawa and London and is currently <strong>in</strong> the process of assess<strong>in</strong>g applications<br />
to the CHPSOP. At least one of FVB’s clients has been notified that it has been awarded a<br />
CHPSOP contract. The advantage of a Standard Offer Program is that it establishes price<br />
certa<strong>in</strong>ty, subject to specified conditions.<br />
The quality of revenue from a CHPSOP is similar to the capacity component of DE service<br />
rates, i.e. it is locked-<strong>in</strong> for 20 years. And the amount of <strong>in</strong>cremental revenue earned by an<br />
appropriately sized CHP Facility is significant <strong>in</strong> relation to the associated DES. For example, <strong>in</strong><br />
this case the projected electricity revenue is approximately $2 million versus approximately $1<br />
million capacity charges for district heat<strong>in</strong>g and $1.5 million energy charges for district heat<strong>in</strong>g.<br />
This relatively large <strong>in</strong>crease <strong>in</strong> firm revenue makes the DES project more f<strong>in</strong>ancially attractive.<br />
8 Bus<strong>in</strong>ess Model Report<br />
A f<strong>in</strong>ancial model has been prepared to exam<strong>in</strong>e the bus<strong>in</strong>ess case of a potential DES to serve<br />
the Phase 1 customers, as described <strong>in</strong> this report. The result<strong>in</strong>g pro-forma f<strong>in</strong>ancial<br />
statements are <strong>in</strong>cluded <strong>in</strong> Appendix H. This Section highlights the key assumptions and results<br />
of the bus<strong>in</strong>ess case model.<br />
The base case has the follow<strong>in</strong>g general assumptions:<br />
Inflation – 3%<br />
Plann<strong>in</strong>g Period for Return on Investment Ratio – 3 years of development plus 25 years of<br />
operation<br />
No local taxes were <strong>in</strong>cluded <strong>in</strong> the analysis at this stage<br />
A nom<strong>in</strong>al land cost was assumed to be $5,500 per month<br />
The follow<strong>in</strong>g f<strong>in</strong>anc<strong>in</strong>g assumptions impact the f<strong>in</strong>ancial statements:<br />
Debt to equity ratio – 60%<br />
Repayment term – 20 years<br />
Interest rate – 6%<br />
However, project viability will be discussed <strong>in</strong> terms of unlevered Internal Rate of Return (IRR),<br />
i.e. before f<strong>in</strong>anc<strong>in</strong>g, as this parameter does not rely on f<strong>in</strong>anc<strong>in</strong>g assumptions. The IRR does<br />
take <strong>in</strong>to account work<strong>in</strong>g capital and tax. Tak<strong>in</strong>g <strong>in</strong>to account tax without f<strong>in</strong>anc<strong>in</strong>g is not a<br />
69
TRCA Pearson Eco-Bus<strong>in</strong>ess Zone <strong>District</strong> <strong>Energy</strong> <strong>Feasibility</strong> <strong>Study</strong> 10 April 2012<br />
serious problem <strong>in</strong> this case because the relatively large amount of available Capital Cost<br />
Allowance results <strong>in</strong> the assumed 30% average tax rate not be<strong>in</strong>g reached until the 12 th year of<br />
operation.<br />
The model has the capability to either <strong>in</strong>clude CHP, or not, and to take <strong>in</strong>to account any level of<br />
government fund<strong>in</strong>g assistance and any level of <strong>in</strong>tended customer sav<strong>in</strong>gs from BaU selfgeneration<br />
costs. Sensitivity analysis can be performed on specified variances <strong>in</strong> capital,<br />
escalation, gas prices, fixed O&M costs, DES energy rates, DES capacity rates and the level of<br />
fund<strong>in</strong>g assistance. The model encompasses multiple phases, each with its own tranche of the<br />
overall f<strong>in</strong>anc<strong>in</strong>g package. I Phases beyond Phase 1 are considered speculative due to the<br />
lower portion of customers visited. However, the <strong>Project</strong> IRR was calculated for Phases 1, 2<br />
and 3 for illustrative purposes. This comparison shows that the expansion does not improve the<br />
IRR. This is because, accord<strong>in</strong>g to this very prelim<strong>in</strong>ary analysis, the additional pipe cost more<br />
than off-sets the lower unit cost of add<strong>in</strong>g production capacity. It is possible this could be<br />
improved by more detailed analysis and optimization of CHP.<br />
Phase 1 2 3<br />
IRR 5% 4% 4%<br />
MW Contract Load 13.6 15.5 22.3<br />
8.1 Thermal Revenue Assumptions<br />
Table 18 IRR by Phase & Contract Capacity<br />
The connected customer heat<strong>in</strong>g capacity is based on the results discussed <strong>in</strong> Section 2:<br />
Customer Demand. The total projected customer capacity is assumed to be connected <strong>in</strong> two<br />
sub-phases. Table 20 shows the phased heat<strong>in</strong>g capacity. Table 21 shows the phase tim<strong>in</strong>g<br />
with customers be<strong>in</strong>g connected <strong>in</strong> phases over a period of two years with the first customer<br />
revenues start<strong>in</strong>g <strong>in</strong> 2015.<br />
Pearson DES<br />
Capacity (kW)<br />
Installed Contracted<br />
Phase 1 A 8,000 4,825<br />
Phase 1 8,000 8,800<br />
Total 16,000 13,625<br />
Rationale kW<br />
total diversified 11,581<br />
rounded up 12,000<br />
redundant boiler 4,000<br />
total capacity 16,000<br />
Table 19 Thermal Capacity Build-up<br />
70
TRCA Pearson Eco-Bus<strong>in</strong>ess Zone <strong>District</strong> <strong>Energy</strong> <strong>Feasibility</strong> <strong>Study</strong> 10 April 2012<br />
Pearson DES<br />
Construction Start Date Commission<strong>in</strong>g Date<br />
Month (1-12) Year (xxxx) Month (1-12) Year (xxxx)<br />
Phase 1 A 1 2014 Jan-14 1 2015 Jan-15<br />
Phase 1<br />
Total<br />
1 2015 Jan-15 1 2016 Jan-16<br />
Table 20 <strong>Project</strong> Phas<strong>in</strong>g<br />
The district heat<strong>in</strong>g service rates are <strong>in</strong> terms of $/MWht for energy and $ per kWt per month for<br />
capacity.<br />
The energy rate <strong>in</strong> $/MWht is derived from the variable production cost for heat<strong>in</strong>g per Section<br />
8.3 below based on the heat be<strong>in</strong>g produced entirely <strong>in</strong> hot water boilers 12<br />
. In other words, it is<br />
a “pass-through” of the DES fuel costs, assum<strong>in</strong>g no CHP.<br />
The capacity rate <strong>in</strong> $ per kWt per month is set equal to an amount that when added to the<br />
energy charge would make the total district heat<strong>in</strong>g service charge equal to the total estimated<br />
customer’s BaU costs per MWht <strong>in</strong> the first year of service. This counts fuel, O&M and avoided<br />
replacement capital per the BaU cost summary worksheet <strong>in</strong> Appendix B. In other words, this is<br />
the “value added” by the DES on top of the cost of fuel. From another perspective, it equals the<br />
customer’s avoided O&M and replacement capital plus the customer sav<strong>in</strong>gs <strong>in</strong> energy costs<br />
compar<strong>in</strong>g BaU fuel bills to DES energy charges only.<br />
In the base case this rate provides no direct monetary sav<strong>in</strong>gs to customers, but is deemed to<br />
be a “competitive” rate, derived on a similar basis to what has been used <strong>in</strong> other DES. If it is<br />
planned to offer customers sav<strong>in</strong>gs from BaU, it would be preferable to implement this by a<br />
reduction <strong>in</strong> the capacity rate and that is how this bus<strong>in</strong>ess model is structured. Whether the<br />
service can be sold at, or with a specified reduction from, the estimated BaU cost <strong>in</strong> this<br />
particular circumstance depends on a host of factors that can only be confirmed or modified <strong>in</strong> a<br />
market<strong>in</strong>g program that would be the next stage of project development.<br />
The derivation of the capacity rate is therefore <strong>in</strong>fluenced by the customer’s avoided fuel cost<br />
us<strong>in</strong>g the same current forecast gas commodity price as <strong>in</strong> the Variable Cost Assumptions (this<br />
is very important), tak<strong>in</strong>g <strong>in</strong>to account the estimated average seasonal customer boiler<br />
efficiency of 60%, the current delivery charges under Enbridge Rate 100 that was recently<br />
calculated to be approximately $2.96/GJ for a typical commercial build<strong>in</strong>g (assum<strong>in</strong>g this will not<br />
change materially <strong>in</strong> constant dollars) and the avoided BaU cost of O&M and replacement<br />
capital as documented the BaU analysis worksheet <strong>in</strong> Appendix B, which came to<br />
$54,840/MWt/year on average for the selected 11 prospective customers.<br />
The calculations are shown <strong>in</strong> Table 22.<br />
12 In reality, the <strong>in</strong>tent is to generate as much heat as possible from heat recovery from the CHP unit, but the fuel saved by heat recovery is credited as revenue<br />
to the CHP <strong>in</strong> a separate CHPSOP model. This CHP revenue and associated expenses are then l<strong>in</strong>ked <strong>in</strong>to the ma<strong>in</strong> DES model at the Income Statement level.<br />
71
TRCA Pearson Eco-Bus<strong>in</strong>ess Zone <strong>District</strong> <strong>Energy</strong> <strong>Feasibility</strong> <strong>Study</strong> 10 April 2012<br />
Development of <strong>District</strong> Heat<strong>in</strong>g rates<br />
BAU Variable Costs<br />
commodity gas cost (2015 <strong>in</strong> 2011 $) 5.18 $/GJ<br />
typical commercial T&D charge (Rate 100) 2.96 $/GJ<br />
assumed delivered gas costs (2015 <strong>in</strong> 2011$) 8.14 $/GJ<br />
Customers Seasonal Efficiency 60%<br />
Avoided customer fuel cost 48.81 $/MWht<br />
BAU Fixed Costs<br />
based on average for Phase 1 build<strong>in</strong>gs 54,840 $/MWt/year<br />
Equivalent Full Load Hours 2,063<br />
fixed cost expressed per unit of energy 26.59 $/MWht<br />
Total BAU cost per unit of energy 75.40<br />
72<br />
$/MWht<br />
Derivation of capacity rate to make total customer DES charges = total BAU<br />
DES energy rate (pass-through production costs) 33.44 $/MWht<br />
Balance of BaU cost as a capacity charge 41.96 $/MWht<br />
Capacity charge per MWt 86,553 $/MWt/year<br />
Customer Sav<strong>in</strong>gs <strong>in</strong>tended at current gas costs 0<br />
$ per year per MW after sav<strong>in</strong>gs 86,553 $/MWt/year<br />
$ per kWt per month (2011$) 7.21 $/kWt/month<br />
8.2 Electricity Revenue<br />
Table 21 DES Rate Derivation<br />
Another significant assumption is that the <strong>Energy</strong> Centre will be a standalone facility not<br />
connected to the GTAA CUP either physically or by way of operat<strong>in</strong>g supervision, even though it<br />
will be located just across the street. S<strong>in</strong>ce no waste heat from the GTAA is assumed <strong>in</strong> this<br />
analysis, it is assumed that, with 12 MWt of heat load, the DES would <strong>in</strong>stall its own CHP<br />
Facility to commence operation upon connection of the balance of Phase 1, i.e. <strong>in</strong> 2016 under a<br />
contract with the OPA based on the current CHP Standard Offer Program (CHPSOP) 13<br />
.<br />
For the purpose of cost<strong>in</strong>g and energy projections, it is assumed that the DES CHP Facility<br />
would <strong>in</strong>clude a nom<strong>in</strong>al 4 MWe Jenbacher JMS 624 reciprocat<strong>in</strong>g eng<strong>in</strong>e generat<strong>in</strong>g a net<br />
13 The September 2011 OPA update on the CHPSOP states that new Applications will not be accepted<br />
until the Launch and Second Tranche Applications have been processed and the OPA has determ<strong>in</strong>ed<br />
whether there is any rema<strong>in</strong><strong>in</strong>g Available Capacity. If it is determ<strong>in</strong>ed that there is rema<strong>in</strong><strong>in</strong>g Available<br />
Capacity, the OPA will provide five Bus<strong>in</strong>ess Days notice on the website of the reopen<strong>in</strong>g of the program<br />
for new Applications. Therefore, strictly, it is uncerta<strong>in</strong> whether a CHPSOP-type contract would be<br />
available, but it is considered likely.
TRCA Pearson Eco-Bus<strong>in</strong>ess Zone <strong>District</strong> <strong>Energy</strong> <strong>Feasibility</strong> <strong>Study</strong> 10 April 2012<br />
output of 3.9 MWe to the grid and 3.76 MWt of useful heat and that it would operate 2,200 hours<br />
per year. This is a conservative assumption of run time made by the OPA based on the past<br />
few years’ gas and electricity prices.<br />
The actual run time would be dictated by economic dispatch accord<strong>in</strong>g to future gas and<br />
electricity prices. However, under the current CHPSOP rules and pric<strong>in</strong>g formula the f<strong>in</strong>ancial<br />
results are relatively <strong>in</strong>-sensitive to run time. The ma<strong>in</strong> benefit from more run time would be<br />
greater greenhouse gas emission reductions.<br />
Addition of a Thermal <strong>Energy</strong> Storage (TES) system, similar to the TES that was recently<br />
commissioned <strong>in</strong> Markham Centre, was considered. Prelim<strong>in</strong>ary modell<strong>in</strong>g suggested that this<br />
would not improve the overall rate of return – probably because of few run hours <strong>in</strong> the shoulder<br />
seasons correspond<strong>in</strong>g to the assumption of 2,200 run hours per year. However, this is a<br />
conclusion that should be re-visited carefully should the project proceed.<br />
FVB’s CHPSOP model confirms that with the estimated heat load of Phase 1, the proposed<br />
CHP Facility would have a Useful Heat Output Percentage of 42%, well above the required<br />
m<strong>in</strong>imum of 15%. Its net average annual heat rate would be 5,600 Btu/kWh, which would<br />
qualify for Class 43.1 30% Capital Cost Allowance (CCA) 14<br />
.<br />
It would be more efficient than the OPA’s Virtual Power Plant, which means that if managed<br />
correctly this CHP project ought to earn a return on <strong>in</strong>vestment <strong>in</strong> the range that the OPA aimed<br />
for with its CHPSOP pric<strong>in</strong>g. In fact, with no <strong>in</strong>cremental operat<strong>in</strong>g staff required (above those<br />
needed anyway for the DES) or <strong>in</strong>cremental heat distribution capital, i.e. as what could be<br />
described as a “bolt on” to the DES, the <strong>Project</strong> (unlevered) IRR of the CHP Facility (alone, as<br />
dist<strong>in</strong>ct from the overall DES) is projected to be 11%. This is <strong>in</strong> l<strong>in</strong>e with several similar CHP<br />
projects that FVB has exam<strong>in</strong>ed <strong>in</strong> recent months.<br />
The challenge is that the DES platform necessary to achieve this IRR for the CHP Facility,<br />
under current assumptions, without any government fund<strong>in</strong>g assistance, and without the benefit<br />
of an external source of energy (so that full new boiler capacity is needed) is projected to have<br />
an unlevered IRR of only 3%, which is improved to 5% by CHP. Although, the DES with CHP<br />
IRR on Equity can be levered to 8% under the base case f<strong>in</strong>anc<strong>in</strong>g assumptions, this is still at<br />
the low end of the range normally considered attractive for DES projects, even with public<br />
ownership, which is generally 8-12% (although some have been constructed know<strong>in</strong>g the IRR<br />
would be less than 8%, because of other benefits). The potential impact of government fund<strong>in</strong>g<br />
on this is discussed further <strong>in</strong> sub-section 8.4.<br />
8.3 Variable Cost Assumptions<br />
8.3.1 Heat<strong>in</strong>g<br />
Natural gas, electricity, water and sewer tariff assumptions for heat<strong>in</strong>g production are shown <strong>in</strong><br />
Table 23. The natural gas cost per unit of heat production <strong>in</strong> the DES is derived from current<br />
forecast 15<br />
gas prices applied to the projected average seasonal customer boiler efficiency of hot<br />
water boilers <strong>in</strong> the <strong>Energy</strong> Centre of 82% and estimated transportation and delivery charges of<br />
14<br />
If the net heat rate were no higher than 4,750 Btu/hour the CHP Facility would qualify for Class 43.2<br />
with a 50% CCA. Cursory modell<strong>in</strong>g suggests the 43.2 heat rate may be difficult to achieve, but this<br />
could be <strong>in</strong>vestigated further at the design development stage if sufficiently important.<br />
15<br />
Sproule AECO-C forecast as of Sept 30, 2011 for 2015 <strong>in</strong> 2011$<br />
73
TRCA Pearson Eco-Bus<strong>in</strong>ess Zone <strong>District</strong> <strong>Energy</strong> <strong>Feasibility</strong> <strong>Study</strong> 10 April 2012<br />
$1.65/GJ, assum<strong>in</strong>g un-bundled delivery rates for the <strong>Energy</strong> Centre boilers comb<strong>in</strong>ed with<br />
CHP.<br />
The production efficiency assumptions are based on FVB’s operat<strong>in</strong>g history experience. The<br />
resultant cost for production for each major variable cost is identified.<br />
Pearson DES<br />
Natural Gas Commodity Cost ($/MMBtu) 5.46<br />
AECO - Dawn Basis 0.65<br />
Estimated T & D costs for CHP ($/MMBtu) 1.00<br />
Total delivered gas price ($/MMBtu) 7.11<br />
Electricity Tariff (CAD/kWh) 0.1270<br />
Water & SewerTariff (CAD/IG) 0.0091<br />
Natural Gas Usage (MMBtu <strong>in</strong>put/MMBtu Out) 1.2195<br />
Electricity Usage (kWh/MMBtu) 7.50<br />
Water & Sewer Usage (IG/MMBtu) 15.00<br />
Natural Gas Cost (CAD/MMBtu) 8.6707<br />
Electricity (CAD/MMBtu) 0.9525<br />
Water & Sewer (CAD/MMBtu) 0.1365<br />
Chemicals (CAD/MMBtu) 0.0400<br />
Total Variable (CAD/MMBtu) 9.7997<br />
Table 22 Heat<strong>in</strong>g Variable Cost Assumptions<br />
8.3.2 Fixed Cost Assumptions<br />
Heat<strong>in</strong>g<br />
Assumptions for fixed costs of heat<strong>in</strong>g production and distribution are shown <strong>in</strong> Table 24.<br />
These assumptions are based on FVB’s experience of support to operations.<br />
74
TRCA Pearson Eco-Bus<strong>in</strong>ess Zone <strong>District</strong> <strong>Energy</strong> <strong>Feasibility</strong> <strong>Study</strong> 10 April 2012<br />
Fixed Costs<br />
Pearson DES<br />
Labour (CAD) (3 FTE) <strong>in</strong> $ per year 184,605<br />
Ma<strong>in</strong>tenance Cost (% capital) 1.00%<br />
Insurance (% of capital cost) 0.25%<br />
Land Lease (CAD) <strong>in</strong> $ per year 66,000<br />
Corporate Overheads (CAD million)<br />
Development Costs 2012-2014 0.15<br />
Salary and G&A expenses 2015 onwards 0.15<br />
75<br />
per year<br />
per year<br />
Plant G&A (CAD million)<br />
Plant G&A (a fixed amount escalat<strong>in</strong>g) 5%<br />
Subject to maximum of 0.10 per year<br />
8.4 F<strong>in</strong>ancial Results<br />
Table 23 Heat<strong>in</strong>g Fixed Cost Assumptions<br />
The Bus<strong>in</strong>ess Model is based on supply<strong>in</strong>g heat only to the 11 identified customers, together<br />
with a 4 MWe CHP Facility per the CHP Standard Offer Program. The projected unlevered<br />
Internal Rate of Return (IRR) is 5% over a 25 year operat<strong>in</strong>g period.<br />
F<strong>in</strong>ancial projections are presented <strong>in</strong> the follow<strong>in</strong>g tables:<br />
Table 25 – Income Statement <strong>Project</strong>ion<br />
Table 26 – Balance Sheet <strong>Project</strong>ion<br />
Table 27 – Cash Flow Statement <strong>Project</strong>ion<br />
These summary tables show the pro forma f<strong>in</strong>ancial statements for ten years of operations. The<br />
pr<strong>in</strong>touts <strong>in</strong> Appendix H show the statements from the start of project development <strong>in</strong> 2012<br />
through 25 years of operation to 2039.
TRCA Pearson Eco-Bus<strong>in</strong>ess Zone <strong>District</strong> <strong>Energy</strong> <strong>Feasibility</strong> <strong>Study</strong> 10 April 2012<br />
Income<br />
Statement<br />
CAD million<br />
2015 2016 2017 2018 2019 2020 2021 2022 2023 2024<br />
Revenue 0.84 4.47 4.58 4.69 4.80 4.91 5.03 5.15 5.28 5.41<br />
Total<br />
operat<strong>in</strong>g<br />
cost<br />
0.88 2.65 2.73 2.81 2.89 2.97 3.06 3.14 3.23 3.33<br />
EBITDA (0.04) 1.82 1.85 1.88 1.91 1.94 1.98 2.01 2.05 2.08<br />
EBIT (0.37) 1.01 1.04 1.07 1.10 1.14 1.17 1.21 1.24 1.28<br />
Net profit (0.37) 0.17 0.23 0.28 0.34 0.40 0.47 0.53 0.60 0.68<br />
Table 24 Pro Forma Income Statement<br />
EBITDA means ‘Earn<strong>in</strong>gs before <strong>in</strong>terest, taxes, depreciation and amortization’<br />
EBIT means ‘Earn<strong>in</strong>gs before <strong>in</strong>terest and taxes”<br />
Net Profit is after <strong>in</strong>terest on f<strong>in</strong>anc<strong>in</strong>g and taxes<br />
76
TRCA Pearson Eco-Bus<strong>in</strong>ess Zone <strong>District</strong> <strong>Energy</strong> <strong>Feasibility</strong> <strong>Study</strong> 10 April 2012<br />
Balance Sheet 2015 2016 2017 2018 2019 2020 2021 2022 2023 2024<br />
CAD million<br />
Fixed Assets 11.89 27.55 26.75 25.94 25.13 24.33 23.52 22.71 21.90 21.10<br />
Current assets 0.11 0.84 1.28 1.73 2.17 2.61 3.05 3.49 3.92 4.34<br />
Total assets 11.99 28.39 28.03 27.67 27.30 26.94 26.57 26.20 25.82 25.44<br />
Current<br />
liabilities<br />
0.15 0.93 0.97 1.02 1.06 1.11 1.16 1.22 1.27 1.33<br />
Long term<br />
liabilities<br />
- 16.00 15.48 14.93 14.35 13.73 13.08 12.39 11.65 10.88<br />
Paid-up capital<br />
Reta<strong>in</strong>ed<br />
12.22 11.75 11.75 11.75 11.75 11.75 11.75 11.75 11.75 11.75<br />
earn<strong>in</strong>gs &<br />
reserves<br />
(0.37) (0.29) (0.17) (0.03) 0.14 0.34 0.58 0.84 1.15 1.48<br />
Equity 11.85 11.46 11.58 11.72 11.89 12.09 12.32 12.59 12.89 13.23<br />
Total liabilities<br />
& equity<br />
11.99 28.39 28.03 27.67 27.30 26.94 26.57 26.20 25.82 25.44<br />
Table 25 Pro Forma Balance Sheet<br />
77
TRCA Pearson Eco-Bus<strong>in</strong>ess Zone <strong>District</strong> <strong>Energy</strong> <strong>Feasibility</strong> <strong>Study</strong> 10 April 2012<br />
Cash Flow Statement 2015 2016 2017 2018 2019 2020 2021 2022 2023 2024<br />
CAD million<br />
Inflows<br />
Cash flows from operations 0.04 0.82 1.04 1.09 1.15 1.21 1.28 1.34 1.41 1.49<br />
Cash flows due to <strong>in</strong>vestments (11.77) (16.48) - - - - - - - -<br />
Cash flows from f<strong>in</strong>anc<strong>in</strong>g 11.77 15.93 (0.60) (0.66) (0.72) (0.78) (0.85) (0.92) (0.99) (1.07)<br />
Net <strong>in</strong>crease <strong>in</strong> cash 0.04 0.27 0.43 0.43 0.43 0.43 0.43 0.42 0.42 0.41<br />
Table 26 Pro Forma Cash Flow<br />
78
TRCA Pearson Eco-Bus<strong>in</strong>ess Zone <strong>District</strong> <strong>Energy</strong> <strong>Feasibility</strong> <strong>Study</strong> 10 April 2012<br />
The f<strong>in</strong>ancial projections are depicted graphically below. Net revenue <strong>in</strong>creases substantially <strong>in</strong><br />
year 2 due to commencement of service to the balance of customers <strong>in</strong> Phase 1 (which are <strong>in</strong><br />
Toronto, east of Highway 427) plus the CHP Facility. The owners operat<strong>in</strong>g cash flow,<br />
exclusive of f<strong>in</strong>anc<strong>in</strong>g, is represented by EBITDA.<br />
6.0<br />
5.0<br />
4.0<br />
3.0<br />
2.0<br />
1.0<br />
0.0<br />
-1.0<br />
8.5 Sensitivity<br />
F<strong>in</strong>ancial <strong>Project</strong>ions (CAD million)<br />
2013 2014 2015 2016 2017 2018 2019 2020 2021 2022 2023 2024<br />
Net Revenues EBITDA<br />
Figure 6 F<strong>in</strong>ancial <strong>Project</strong>ion<br />
The lRR was found to be most sensitive to changes <strong>in</strong> capital, service rates and government<br />
assistance, as shown <strong>in</strong> Table 28. A grant of 30% of the capital cost, approximately $8.5<br />
million, would move the IRR <strong>in</strong>to the generally accepted range of 8 -12%.<br />
DE <strong>Energy</strong><br />
Rate<br />
DE Capacity<br />
Rate<br />
Level of fund<strong>in</strong>g<br />
assistance<br />
4% -15% 10%<br />
Capital Variance<br />
0% 10% 25%<br />
-40% 4% 2% 3% 2% none<br />
-20% 5% 3% 4% 3% 2%<br />
0% 7% 4% 5% 4% 3%<br />
20% 8% 5% 6% 5% 4%<br />
40% 9% 6% 7% 6% 5%<br />
4% -15% 10%<br />
Capital Variance<br />
0% 10% 25%<br />
-40% 3% none none none none<br />
-20% 5% 3% 3% 3% 2%<br />
0% 7% 4% 5% 4% 3%<br />
20% 8% 5% 6% 5% 4%<br />
40% 10% 7% 8% 7% 5%<br />
4% -15% 10%<br />
Capital Variance<br />
0% 10% 25%<br />
0% 7% 4% 5.0% 4% 3%<br />
5% 7% 5% 5.5% 5% 3%<br />
10% 8% 5% 6.1% 5% 4%<br />
15% 9% 6% 6.7% 6% 4%<br />
20% 9% 6% 7.4% 6% 5%<br />
25% 10% 7% 8.2% 7% 6%<br />
30% 11% 8% 9.0% 8% 6%<br />
Table 27 Results of Sensitivity Analysis on Unlevered IRR<br />
The IRR were also be more favourable if a supply from the GTAA were arranged, under the<br />
assumptions outl<strong>in</strong>ed <strong>in</strong> Section 2.2, <strong>in</strong>stead of the proposed new 4 MWe CHP. The<br />
sensitivities of this scenario are shown <strong>in</strong> Table 29.<br />
79
TRCA Pearson Eco-Bus<strong>in</strong>ess Zone <strong>District</strong> <strong>Energy</strong> <strong>Feasibility</strong> <strong>Study</strong> 10 April 2012<br />
Level of fund<strong>in</strong>g<br />
assistance<br />
Capital Variance<br />
8% -15% 10% 0% 10% 25%<br />
0% 11% 8% 8.9% 8% 6%<br />
5% 11% 8% 9.5% 8% 7%<br />
10% 12% 9% 10.1% 9% 8%<br />
15% 13% 10% 10.9% 10% 8%<br />
20% 14% 10% 11.7% 10% 9%<br />
25% 15% 11% 12.5% 11% 10%<br />
30% 16% 12% 13.5% 12% 11%<br />
Table 28 Sensitivity of unlevered IRR to Fund<strong>in</strong>g and Capital with External Supply<br />
9 Implementation Plan<br />
The follow<strong>in</strong>g is not <strong>in</strong>tended to be totally sequential. For example, a private component<br />
ownership might enter at some po<strong>in</strong>t dur<strong>in</strong>g the market<strong>in</strong>g phase and this may be after some<br />
level of fund<strong>in</strong>g has been secured from senior levels of government.<br />
9.1 DES Ownership Model<br />
The first task will be to determ<strong>in</strong>e the owner/operator model and establish suitable governance<br />
(e.g. relationship with the shareholders). As suggested <strong>in</strong> Section 6:Ownership and Operational<br />
Structure, one viable approach may be to start as a municipal entity with the <strong>in</strong>tent of <strong>in</strong>volv<strong>in</strong>g<br />
private capital as the bus<strong>in</strong>ess plan becomes more firm with conditional commitments from<br />
prospective customers.<br />
9.2 Initial Bus<strong>in</strong>ess Plan<br />
The second task will be for the owner to develop an <strong>in</strong>itial Bus<strong>in</strong>ess Plan with a project<br />
schedule, costs/revenue projection and draft a Term Sheet Template and sample Memoranda<br />
of Understand<strong>in</strong>g (MOU’s) and <strong>Energy</strong> Service Agreements (ESA’s). Control of the site for the<br />
first <strong>Energy</strong> Centre should be secured at least with an option. All of this is necessary to prepare<br />
for market<strong>in</strong>g.<br />
9.3 Market<strong>in</strong>g<br />
Each prospective customer should be engaged <strong>in</strong> prelim<strong>in</strong>ary discussions aimed at <strong>in</strong>troduc<strong>in</strong>g<br />
the possibility of district heat<strong>in</strong>g service. The results of the <strong>in</strong>itial feasibility study should be<br />
reviewed with build<strong>in</strong>g owner’s representatives, the potential benefits should be stressed and<br />
the planned process for establish<strong>in</strong>g the DE bus<strong>in</strong>ess expla<strong>in</strong>ed, <strong>in</strong>clud<strong>in</strong>g the expected<br />
schedule.<br />
An important outcome of this activity would be to ga<strong>in</strong> the cooperation and participation of each<br />
build<strong>in</strong>g owner/developer to coord<strong>in</strong>ate their plann<strong>in</strong>g activities with the DE activity.<br />
Another product of the market<strong>in</strong>g activity would be an <strong>in</strong>itial project risk assessment, us<strong>in</strong>g what<br />
is learned through discussions with the build<strong>in</strong>g owners/developers, as well as <strong>in</strong>telligence from<br />
the technical work that will overlap.<br />
While FVB staff could lead this activity, if engaged to do so, it will be critical for the DES<br />
Owner’s staff to participate and lend credibility to the market<strong>in</strong>g effort. In addition it will be<br />
important to have project champions amongst the municipalities and <strong>Partners</strong> <strong>in</strong> <strong>Project</strong> <strong>Green</strong><br />
to promote the importance of develop<strong>in</strong>g a DES for the Pearson Eco-Bus<strong>in</strong>ess Zone.<br />
80
TRCA Pearson Eco-Bus<strong>in</strong>ess Zone <strong>District</strong> <strong>Energy</strong> <strong>Feasibility</strong> <strong>Study</strong> 10 April 2012<br />
Based on the projected customers’ avoidable costs <strong>in</strong>formed by discussions with the<br />
prospective customers, a f<strong>in</strong>al pric<strong>in</strong>g structure will be developed and its acceptability tested <strong>in</strong><br />
discussions with customers.<br />
9.4 <strong>Project</strong> Review<br />
Stock will be taken of the prospects and suggested character of the DES as <strong>in</strong>formed by<br />
ongo<strong>in</strong>g and previous efforts. An especially important step would be to solicit comments on the<br />
current effort from prospective customers, as these will form the basis of MOU’s that they will be<br />
asked to sign. The list of prospective customer peak loads and energy use, and consequently<br />
the cost/revenue may be revised as a result of this work.<br />
9.5 Revised Bus<strong>in</strong>ess Plan<br />
The DE technical concept and Bus<strong>in</strong>ess Plan should be modified as necessary based on the<br />
project review, e.g. system capacity, temperature profile, DPS route, size and schedule of ETS<br />
and expected revenue would all be modified as a result of those discussions. The Capital Cost<br />
Estimate and Bus<strong>in</strong>ess Plan would be adjusted accord<strong>in</strong>gly. Technical plann<strong>in</strong>g and<br />
coord<strong>in</strong>ation with the GTAA as necessary would occur, along with liaison with local community<br />
plann<strong>in</strong>g officials and municipal eng<strong>in</strong>eers responsible for the <strong>in</strong>tended DPS right of way.<br />
9.6 Design Basis Document<br />
As the project becomes better def<strong>in</strong>ed, a Design Basis Document (DBD) should be developed.<br />
The DBD will <strong>in</strong>clude <strong>in</strong>itial siz<strong>in</strong>g of equipment, schematics and layouts, <strong>in</strong>clud<strong>in</strong>g pipe route<br />
and sample pipe details. The capital cost estimates would be ref<strong>in</strong>ed <strong>in</strong> accordance with the<br />
DBD. Application for site plan approval would be submitted based on the DBD.<br />
9.7 Obta<strong>in</strong> Customer Commitment<br />
With a solid bus<strong>in</strong>ess plan (<strong>in</strong>clud<strong>in</strong>g pric<strong>in</strong>g) <strong>in</strong> hand, presentations will be made to senior<br />
representatives of the build<strong>in</strong>g owners aimed at secur<strong>in</strong>g sign-off of MOU’s. Explanations will<br />
be given describ<strong>in</strong>g what it means for a build<strong>in</strong>g to be connected to district energy from both a<br />
technical and bus<strong>in</strong>ess perspective. The land owners/developers will be asked to sign-off on<br />
MOU’s, <strong>in</strong> acknowledgement of draft ESA’s that will also be presented to them.<br />
Experience has been that execution of ESA’s can be a time consum<strong>in</strong>g process. MOU’s<br />
provide the DE owner with some assurance of customer commitment to support application for<br />
capital approvals and construction f<strong>in</strong>anc<strong>in</strong>g, even while f<strong>in</strong>al customer review and execution of<br />
ESA’s are <strong>in</strong> process.<br />
9.8 F<strong>in</strong>alize <strong>Project</strong> Def<strong>in</strong>ition<br />
The project technical def<strong>in</strong>ition (<strong>in</strong> the DBD) and bus<strong>in</strong>ess plan will be reconfigured as<br />
necessary <strong>in</strong> accordance with the MOU’s. This may <strong>in</strong>clude some ref<strong>in</strong>ement to the pric<strong>in</strong>g and<br />
consequently revenue projections.<br />
The f<strong>in</strong>al Bus<strong>in</strong>ess Plan should <strong>in</strong>clude owner/operator options, governance, pric<strong>in</strong>g,<br />
cost/revenue projection, project schedule, risk management plan, environmental and social<br />
performance and samples of MOU and ESA.<br />
81
TRCA Pearson Eco-Bus<strong>in</strong>ess Zone <strong>District</strong> <strong>Energy</strong> <strong>Feasibility</strong> <strong>Study</strong> 10 April 2012<br />
9.9 Secure F<strong>in</strong>anc<strong>in</strong>g<br />
9.9.1 Fund<strong>in</strong>g Sources<br />
It is challeng<strong>in</strong>g to f<strong>in</strong>d conventional f<strong>in</strong>anc<strong>in</strong>g for DE development and <strong>in</strong>deed, for construction,<br />
depend<strong>in</strong>g on the amount of signed customer contracts at the time f<strong>in</strong>anc<strong>in</strong>g is be<strong>in</strong>g sought.<br />
That is why certa<strong>in</strong> recently <strong>in</strong>troduced government grant programs have become so important<br />
to the DES development <strong>in</strong>dustry <strong>in</strong> Canada.<br />
Many of these grants are targeted for <strong>in</strong>frastructure and the municipalities are likely to have a<br />
key role <strong>in</strong> secur<strong>in</strong>g this fund<strong>in</strong>g. Application for any of the grants would require the DES<br />
technical concept to be developed to the po<strong>in</strong>t of a clear def<strong>in</strong>ition of scope.<br />
Suggested sources of f<strong>in</strong>anc<strong>in</strong>g were outl<strong>in</strong>ed <strong>in</strong> Section 7.4 with respect to F<strong>in</strong>anc<strong>in</strong>g Risks.<br />
82
TRCA Pearson Eco-Bus<strong>in</strong>ess Zone <strong>District</strong> <strong>Energy</strong> <strong>Feasibility</strong> <strong>Study</strong> 10 April 2012<br />
10 Economic Conditions for GTAA’s Central Utilities Plant to Supply<br />
Thermal <strong>Energy</strong><br />
Currently the GTAA has a CUP that consists of boilers and a CHP plant. While the boilers are<br />
limited by their physical capacity and GTAA’s demand for heat<strong>in</strong>g and cool<strong>in</strong>g, the CHP is<br />
currently limited by market prices for electricity.<br />
The CHP plant is dispatched when it is profitable based on market rates for electricity and the<br />
cost of natural gas. In order to utilize GTAA’s CHP as the thermal source for the proposed<br />
district energy system, GTAA would need improved contract terms so that it is profitable to run<br />
more often. If this was the case, it is possible that the proposed 4MW dedicated CHP plant<br />
assumed by this study could be avoided.<br />
Contract features that would support the delivery of heat to the Pearson Eco-Bus<strong>in</strong>ess Zone<br />
<strong>District</strong> <strong>Energy</strong> System <strong>in</strong>clude non-dispatchable operation and m<strong>in</strong>imum standby price for<br />
electricity, together with an appropriate spark-spread risk mitigation mechanism. If this was<br />
available, GTAA could potentially be available to provide the thermal energy when needed by<br />
the proposed district energy system.<br />
83
TRCA Pearson Eco-Bus<strong>in</strong>ess Zone <strong>District</strong> <strong>Energy</strong> <strong>Feasibility</strong> <strong>Study</strong> 10 April 2012<br />
Appendices<br />
11 Appendix A: Introduction to <strong>District</strong> <strong>Energy</strong><br />
11.1 General Overview<br />
<strong>District</strong> <strong>Energy</strong> Systems (DES) supply thermal energy from (an) <strong>Energy</strong> Centre(s) (EC) through<br />
a Distribution Pipe System (DPS) to <strong>Energy</strong> Transfer Stations (ETS) located <strong>in</strong> multiple<br />
build<strong>in</strong>gs as illustrated <strong>in</strong> the follow<strong>in</strong>g diagram.<br />
11.2 Services<br />
The primary service provided by DES to customers is heat<strong>in</strong>g and/or cool<strong>in</strong>g. DES may also<br />
generate electricity as a by-product us<strong>in</strong>g Comb<strong>in</strong>ed Heat and Power (CHP, also known as<br />
cogeneration). Alternately, some DES purchase heat energy wholesale from third party CHP<br />
plants, or other facilities that have heat production capacity available.<br />
Electricity generated <strong>in</strong> <strong>Energy</strong> Centres may be self-consumed <strong>in</strong> the <strong>Energy</strong> Centre, <strong>in</strong> another<br />
host facility and/or <strong>in</strong>jected <strong>in</strong>to the local electricity distribution system. This is known as<br />
Distributed Generation, i.e. electricity generation connection to a local distribution system not to<br />
the prov<strong>in</strong>ce-wide transmission system.<br />
11.3 Unique Sales Proposition<br />
DES supply "ready-to-use" thermal services for build<strong>in</strong>gs, as opposed to fuel or electricity that<br />
must be converted to thermal services on-site. Conventional on-site systems typically combust<br />
fuel <strong>in</strong> boilers to provide heat<strong>in</strong>g and domestic hot water; and utilize electrically-driven<br />
equipment to produce chilled water for air condition<strong>in</strong>g. Some build<strong>in</strong>gs use electrically-driven<br />
heat pumps to produce space heat<strong>in</strong>g and electric domestic hot water heaters. The need for<br />
84
TRCA Pearson Eco-Bus<strong>in</strong>ess Zone <strong>District</strong> <strong>Energy</strong> <strong>Feasibility</strong> <strong>Study</strong> 10 April 2012<br />
Appendices<br />
such on-site energy conversion equipment and associated ancillaries like breech<strong>in</strong>g, stacks and<br />
cool<strong>in</strong>g towers is elim<strong>in</strong>ated by the district energy service.<br />
Additionally, DES offers the flexibility of utiliz<strong>in</strong>g potential energy sources, which has been<br />
described as “future-proof<strong>in</strong>g”. This means that no matter what the future holds <strong>in</strong> terms of<br />
changes <strong>in</strong> cost and availability of energy commodities, the DES will always be able to adapt by<br />
switch<strong>in</strong>g energy <strong>in</strong>puts and/or technologies.<br />
11.4 <strong>Energy</strong> Sources<br />
DES can use a diversity of energy resources such as fossil fuels, renewable energy and waste<br />
heat. They are sometimes called “community energy systems”, because a DES can provide<br />
opportunities to connect generators of waste energy (e.g. electric power plants or <strong>in</strong>dustrial<br />
facilities) that already exist with<strong>in</strong> a community to consumers <strong>in</strong> the same community. That is<br />
the essential idea beh<strong>in</strong>d this <strong>Partners</strong> <strong>in</strong> <strong>Project</strong> <strong>Green</strong> feasibility study of the prospect for a<br />
DES <strong>in</strong> the Pearson Econ-Bus<strong>in</strong>ess Zone.<br />
Central storage of hot or cold energy may be useful <strong>in</strong> some cases. For example, <strong>in</strong> Ontario,<br />
which has plentiful base-load nuclear and hydro power, natural gas-fired CHP may be more<br />
economic to operate only at peak times each day. But when it does operate a CHP unit may<br />
generate more useful heat than required by the district heat<strong>in</strong>g system at that <strong>in</strong>stant, especially<br />
dur<strong>in</strong>g the summer and shoulder seasons. Hot thermal energy storage can <strong>in</strong>crease the useful<br />
heat recoverable from CHP by enabl<strong>in</strong>g it to be used dur<strong>in</strong>g the part of the day when the CHP<br />
unit is shutdown. This is a process strategy used by Markham <strong>District</strong> <strong>Energy</strong> Inc.<br />
In some places, district cool<strong>in</strong>g systems store cool<strong>in</strong>g energy that is generated at night for use<br />
dur<strong>in</strong>g the hottest part of the day. This will shift electricity demand to the lower cost hours and<br />
add peak cool<strong>in</strong>g capacity without more chillers. The economic justification for the capital cost<br />
of cold thermal energy storage has generally been found to be difficult <strong>in</strong> Ontario to date.<br />
However, it may be a useful option <strong>in</strong> the future as the difference <strong>in</strong> price between on and offpeak<br />
electricity <strong>in</strong>creases and/or there are more <strong>in</strong>centives offered to optimize electricity<br />
<strong>in</strong>frastructure. There is a significant economy of scale <strong>in</strong> cold thermal energy storage.<br />
Therefore, it is more likely to be more beneficial for a DES than for any <strong>in</strong>dividual build<strong>in</strong>g.<br />
Clearly, the reliability and efficiency of a DES with its multiple centralized boilers and chillers,<br />
ideally backed up with thermal storage will be superior to any standalone build<strong>in</strong>g system. This<br />
is analogous to the <strong>in</strong>tegrated electricity grid as compared with the alternative of hav<strong>in</strong>g gensets<br />
<strong>in</strong> each build<strong>in</strong>g.<br />
To illustrate, consider only one boiler or one chiller <strong>in</strong> a build<strong>in</strong>g, which is sometimes seen<br />
especially one chiller <strong>in</strong> multi-residential build<strong>in</strong>gs. First, there is no back-up. Second, s<strong>in</strong>ce the<br />
one unit must be sized to meet the peak demand, which occurs on only a few days per year, it<br />
will be operat<strong>in</strong>g consistently at a fraction of its design capacity which <strong>in</strong>evitably leads to<br />
<strong>in</strong>efficiency.<br />
Two production units are better, but not by much. For example, us<strong>in</strong>g typical load duration<br />
curves for the GTA (Greater Toronto Area), it can be shown that even two or three units,<br />
depend<strong>in</strong>g on the exact design configuration (e.g. 2 * 50% peak capacity or 3 * 40% peak<br />
capacity) still suffer from significant part-load<strong>in</strong>g. Inefficiency is also frequently exacerbated by<br />
over-estimation of the required peak capacity.<br />
85
TRCA Pearson Eco-Bus<strong>in</strong>ess Zone <strong>District</strong> <strong>Energy</strong> <strong>Feasibility</strong> <strong>Study</strong> 10 April 2012<br />
Appendices<br />
DES would typically have four or five heat<strong>in</strong>g production units and two or more chillers. Part<br />
load<strong>in</strong>g is also reduced by system diversity, which arises because different build<strong>in</strong>g peak<br />
demands are not co<strong>in</strong>cident.<br />
11.5 Distribution Medium<br />
Many older systems <strong>in</strong> North America use steam as a heat transportation medium while modern<br />
district heat<strong>in</strong>g systems almost always use hot water. The ma<strong>in</strong> reason for us<strong>in</strong>g hot water<br />
rather than steam is that even though it’s a lower grade of energy it is still capable of function<strong>in</strong>g<br />
as the source for space heat<strong>in</strong>g and domestic hot water.<br />
Be<strong>in</strong>g a lower grade of energy, hot water is less expensive to produce than steam. Hot water<br />
can be produced from a variety of lower temperatures sources such as waste heat from CHP.<br />
Additionally, staff<strong>in</strong>g requirements are m<strong>in</strong>imized as hot water systems are not subject to as<br />
strict regulation as steam systems with respect to attendance by operat<strong>in</strong>g eng<strong>in</strong>eers.<br />
<strong>District</strong> heat<strong>in</strong>g is more common than district cool<strong>in</strong>g <strong>in</strong> Canada because of the climate. A<br />
m<strong>in</strong>ority of DES <strong>in</strong> Canada supply both heat<strong>in</strong>g and cool<strong>in</strong>g. This <strong>in</strong>volves 4 pipes, specifically<br />
supply and return for each of heat<strong>in</strong>g and cool<strong>in</strong>g. <strong>District</strong> cool<strong>in</strong>g is even more capital <strong>in</strong>tensive<br />
than district heat<strong>in</strong>g because of lower ΔT (difference between supply and return temperatures).<br />
As a consequence, district cool<strong>in</strong>g is typically found <strong>in</strong> high density areas like downtown<br />
Toronto. This study will make a high-level assessment of the potential for district cool<strong>in</strong>g <strong>in</strong> the<br />
study area, but it is considered an unlikely prospect, except perhaps for the Airway Centre<br />
complex. This section will briefly describe the concept of district cool<strong>in</strong>g and what it would imply<br />
for any build<strong>in</strong>gs that were connected.<br />
<strong>District</strong> cool<strong>in</strong>g systems also use water as the energy transport medium. It is simply at a lower<br />
temperature and is used to transport heat away from build<strong>in</strong>gs rather than to build<strong>in</strong>gs. The<br />
supply temperature would be <strong>in</strong> the range of 4 to 8 °C and water at this temperature is called<br />
“chilled water”. Heat from the build<strong>in</strong>g is transferred <strong>in</strong>to the chilled water and then piped to an<br />
<strong>Energy</strong> Centre where the heat is then rejected <strong>in</strong>to the outside air via cool<strong>in</strong>g towers. This<br />
process elim<strong>in</strong>ates the need for air conditioners or chillers and cool<strong>in</strong>g towers <strong>in</strong> the customer<br />
build<strong>in</strong>gs.<br />
11.6 Build<strong>in</strong>g Interface<br />
The DES delivers hot and/or chilled water to energy transfer stations (ETS) usually located <strong>in</strong><br />
the basement of each customer build<strong>in</strong>g.<br />
The key components of ETS generally <strong>in</strong>clude:<br />
Branch l<strong>in</strong>es from connections that have been provided on the thermal distribution system; if both<br />
heat<strong>in</strong>g and cool<strong>in</strong>g are supplied there would be four pipes<br />
Shut-off valves<br />
Controls <strong>in</strong>clud<strong>in</strong>g electrically operated control valves, to regulate flow required to meet the<br />
build<strong>in</strong>g’s energy demand and ma<strong>in</strong>ta<strong>in</strong> the DES return temperatures<br />
Thermal <strong>Energy</strong> meters<br />
Separate heat exchangers for domestic hot water (DHW), space heat<strong>in</strong>g and space cool<strong>in</strong>g (if<br />
applicable)<br />
Miscellaneous fitt<strong>in</strong>gs such as vents, stra<strong>in</strong>ers and thermo-wells for the energy meter (described <strong>in</strong><br />
more detail below)<br />
86
TRCA Pearson Eco-Bus<strong>in</strong>ess Zone <strong>District</strong> <strong>Energy</strong> <strong>Feasibility</strong> <strong>Study</strong> 10 April 2012<br />
Appendices<br />
A typical ETS is illustrated below, with blue used for cool<strong>in</strong>g and red for heat<strong>in</strong>g. Most ETS for<br />
heat<strong>in</strong>g and cool<strong>in</strong>g have three heat exchangers as depicted <strong>in</strong> this figure; (HX-1) space<br />
heat<strong>in</strong>g, (HX-2) domestic hot water and (HX-3) cool<strong>in</strong>g.<br />
The peak demand for heat<strong>in</strong>g a typical build<strong>in</strong>g <strong>in</strong> Ontario is usually slightly higher than for<br />
cool<strong>in</strong>g, as measured <strong>in</strong> equivalent units, e.g. kilo-Watts thermal, but the cool<strong>in</strong>g equipment<br />
would be larger because of lower ΔT.<br />
The illustration shows only the primary side pip<strong>in</strong>g, the district heat<strong>in</strong>g and cool<strong>in</strong>g loops. The<br />
secondary side pipes, which are part of the build<strong>in</strong>g HVAC system, would be connected to the<br />
HX secondary side flanges. In recent projects, FVB has recommended short lengths of pipe<br />
from the HX secondary flanges be <strong>in</strong>cluded <strong>in</strong> DES ownership <strong>in</strong> order to accommodate<br />
temperature measur<strong>in</strong>g <strong>in</strong>strumentation.<br />
The illustration also shows the different heat exchangers as used for DHW and those used for<br />
space heat<strong>in</strong>g. The hot side <strong>in</strong>let temperature for DHW would typically be controlled to 65°C by<br />
recirculation, as that is the requirement on the primary side to produce domestic hot water at<br />
60°C on the secondary side.<br />
The hot side <strong>in</strong>let temperature for space heat<strong>in</strong>g could go as high as 120°C at peak times,<br />
although for a DES designed to serve entirely new build<strong>in</strong>gs the maximum hot side <strong>in</strong>let<br />
temperature might be as low as 95°C.<br />
It might help to appreciate the benefits of district energy service with respect to the simplification<br />
of build<strong>in</strong>g design by compar<strong>in</strong>g the ETS sketch to the follow<strong>in</strong>g figure.<br />
87
TRCA Pearson Eco-Bus<strong>in</strong>ess Zone <strong>District</strong> <strong>Energy</strong> <strong>Feasibility</strong> <strong>Study</strong> 10 April 2012<br />
Appendices<br />
The ETS would replace the boiler, chiller and cool<strong>in</strong>g tower (and cool<strong>in</strong>g tower pumps) as<br />
shown above. Similarly the boiler exhaust breech<strong>in</strong>g and stack (which are not shown) would<br />
also be replaced.<br />
The above figure may be oversimplified by show<strong>in</strong>g only one boiler and one chiller. Normally a<br />
well designed HVAC system would have at least two boilers although a s<strong>in</strong>gle chiller is often all<br />
that is provided for multi-residential build<strong>in</strong>gs. At least two chillers would normally be provided<br />
for commercial office build<strong>in</strong>gs where cool<strong>in</strong>g is regarded as more important to ensure<br />
cont<strong>in</strong>ued staff productivity. The decrease <strong>in</strong> reliability and efficiency due to hav<strong>in</strong>g too few<br />
production units was mentioned earlier. However it is appreciated that cost, complexity and<br />
space requirements <strong>in</strong>crease with more production units.<br />
The ETS will take approximately 20% of the space that would normally be required by an<br />
equivalent sized boiler and chiller. The rest of the HVAC system is essentially the same as<br />
would be used for a central boiler and chiller hydronic system.<br />
11.7 Meter<strong>in</strong>g<br />
The thermal energy meter<strong>in</strong>g system is an important component of the ETS. Heat<strong>in</strong>g and<br />
cool<strong>in</strong>g (if applicable) would have separate <strong>in</strong>strumentation provid<strong>in</strong>g <strong>in</strong>puts, but a s<strong>in</strong>gle data<br />
computer/logger could be specified to handle both. A thermal energy meter consists of<br />
flow/volume meters, temperature sensors on both supply and return and an <strong>in</strong>tegrator/calculator<br />
which also conta<strong>in</strong>s a data logger, as illustrated <strong>in</strong> the follow<strong>in</strong>g figure.<br />
88
TRCA Pearson Eco-Bus<strong>in</strong>ess Zone <strong>District</strong> <strong>Energy</strong> <strong>Feasibility</strong> <strong>Study</strong> 10 April 2012<br />
Appendices<br />
All thermal energy meters used <strong>in</strong> the ETS comply with the Canadian Standards Association<br />
(CSA) heat meter<strong>in</strong>g standard (CSA C.900), as may be amended or replaced from time to time.<br />
CSA C.900 is currently an adaptation of European Standard EN1434 with Canadian deviations.<br />
The energy meter will collect data on:<br />
Cumulative volume <strong>in</strong> cubic meters (m 3 )<br />
Cumulative energy <strong>in</strong> megawatt-hours thermal (MWht)<br />
Thermal power demand <strong>in</strong> kilowatts thermal (kWt)<br />
Flow rate <strong>in</strong> m 3 /hour<br />
Supply and return temperatures<br />
Temperature difference (∆T)<br />
The data from each meter will be transmitted periodically to a central DES computer. This data<br />
will be used for bill<strong>in</strong>g and trouble-shoot<strong>in</strong>g.<br />
Thermal energy meters comply<strong>in</strong>g with CSA C.900 are accurate and reliable but expensive. The<br />
<strong>in</strong>stalled and commissioned cost of a thermal energy meter for a typical build<strong>in</strong>g might be <strong>in</strong> the<br />
order of $15,000. This cost, together with the cost of heat exchangers, control systems, shut-off<br />
valves and branch connections, expla<strong>in</strong>s why district energy service is more suitable for larger<br />
build<strong>in</strong>gs, where the energy cost sav<strong>in</strong>gs justify the capital cost of connection.<br />
89
TRCA Pearson Eco-Bus<strong>in</strong>ess Zone <strong>District</strong> <strong>Energy</strong> <strong>Feasibility</strong> <strong>Study</strong> 10 April 2012<br />
Appendices<br />
11.8 Def<strong>in</strong>itions and Abbreviations<br />
Btu – British thermal unit; the amount of energy required to raise 1 pound (lb) of water by 1°<br />
Fahrenheit (F)<br />
Base Load – that portion of energy demand required constantly; the DE <strong>in</strong>dustry uses a looser<br />
def<strong>in</strong>ition that is essentially the energy demand economically served by high capital/low<br />
operat<strong>in</strong>g cost resources such as CHP or biomass; best illustrated visually by a load duration<br />
curve. In the example shown <strong>in</strong> the graph below, the peak system demand is close to 30 MWt,<br />
but a resource with a capacity of 10 MWt could economically supply approximately 80% of the<br />
thermal energy – the area below the curve and 10 MWt.<br />
Peak Heat<strong>in</strong>g Load (MWt)<br />
30<br />
25<br />
20<br />
15<br />
10<br />
5<br />
Typical<br />
Heat<strong>in</strong>g Load Duration Curve<br />
GTA<br />
0<br />
0 1000 2000 3000 4000<br />
No. of hours<br />
5000 6000 7000 8000 9000<br />
BAU – Bus<strong>in</strong>ess as Usual, i.e. the default scenario if district energy is not implemented<br />
Chiller – a mach<strong>in</strong>e for generat<strong>in</strong>g cool<strong>in</strong>g energy <strong>in</strong> the form of chilled water used <strong>in</strong> air<br />
condition<strong>in</strong>g, its efficiency is often expressed <strong>in</strong> terms of COP (see below).<br />
CHP - Comb<strong>in</strong>ed Heat and Power, also known as cogeneration, means simultaneous<br />
generation of both useful heat and power <strong>in</strong> a s<strong>in</strong>gle process.<br />
Conversion from Degrees (°) Fahrenheit (F) to Celsius (C)– subtract 32 then divide by 1.8;<br />
from °C to °F, do the opposite, i.e. multiply by 1.8 then add 32.<br />
COP – Coefficient of Performance, the ratio of output divided by <strong>in</strong>put; used to express the<br />
efficiency of chillers or heat pumps<br />
90
TRCA Pearson Eco-Bus<strong>in</strong>ess Zone <strong>District</strong> <strong>Energy</strong> <strong>Feasibility</strong> <strong>Study</strong> 10 April 2012<br />
Appendices<br />
DES – <strong>District</strong> <strong>Energy</strong> System means a system to supply heat<strong>in</strong>g and/or cool<strong>in</strong>g to multiple<br />
build<strong>in</strong>gs.<br />
Diversified Peak Demand – the sum of the peak thermal demands (i.e. heat<strong>in</strong>g or cool<strong>in</strong>g) of<br />
all build<strong>in</strong>gs served by a DES multiplied by a factor to reflect the fact that different build<strong>in</strong>gs’<br />
peak demands are not co<strong>in</strong>cident. For district heat<strong>in</strong>g, a factor of 0.8 to 0.85 has been found to<br />
be appropriate.<br />
Degree Days – a measure of how hot or cold a location has been with<strong>in</strong> a stated period of time,<br />
relative to a reference temperature; Heat<strong>in</strong>g Degree Days (HDD) may be quoted below 15°C,<br />
and Cool<strong>in</strong>g Degree Days above 15°C, if that happens to be the outside air temperature below<br />
which heat<strong>in</strong>g is generally turned on and above which cool<strong>in</strong>g is turned on.<br />
DE – <strong>District</strong> <strong>Energy</strong><br />
DEC - <strong>District</strong> <strong>Energy</strong> Centre – a central facility where heat<strong>in</strong>g and/or cool<strong>in</strong>g and/or electricity<br />
are generated; a recently more preferred term to “energy plant” or “central plant”.<br />
DPS - Distribution pip<strong>in</strong>g system for heat<strong>in</strong>g and/or cool<strong>in</strong>g. This system consists of supply and<br />
return pipes (of the same diameter) together with all necessary valves, vents, dra<strong>in</strong>s and fitt<strong>in</strong>gs.<br />
The pipes are usually buried underground, <strong>in</strong>sulated for heat<strong>in</strong>g and situated between the<br />
energy source(s) and customer build<strong>in</strong>gs. Supply and return branches for each customer<br />
build<strong>in</strong>g jo<strong>in</strong> the <strong>in</strong>side pip<strong>in</strong>g that connects the DPS to the build<strong>in</strong>g energy transfer station<br />
(ETS) (see below).<br />
DHW – domestic hot water; district heat<strong>in</strong>g systems usually supply DHW along with space<br />
heat<strong>in</strong>g and it accounts for most of the summer load.<br />
ΔT – delta T – difference <strong>in</strong> temperature, e.g. as between the supply and return l<strong>in</strong>es of a district<br />
heat<strong>in</strong>g or district cool<strong>in</strong>g loop.<br />
<strong>Energy</strong> Centre - A central facility where heat<strong>in</strong>g, cool<strong>in</strong>g and/or electricity is generated. This is<br />
a preferable term to “energy plant” or “central plant”<br />
EFLH - Equivalent Full Load Hours, annual energy consumption divided by peak load. Heat<strong>in</strong>g<br />
EFLH for a build<strong>in</strong>g is a function of the local annual outside air temperature profile, the outside<br />
air temperature when heat<strong>in</strong>g is turned on, domestic hot water consumption and any other nonspace<br />
heat<strong>in</strong>g uses of heat. Cool<strong>in</strong>g EFLH is a function of the local annual outside air<br />
temperature profile, the outside air temperature when cool<strong>in</strong>g is turned on, humidity (it takes<br />
cool<strong>in</strong>g energy to de-humidify) and any other non-space air-condition<strong>in</strong>g uses of cool<strong>in</strong>g.<br />
ETS - energy transfer stations. They are <strong>in</strong> each customer build<strong>in</strong>g and consist of heat<br />
exchangers, energy meters, controls, valves and <strong>in</strong>side pip<strong>in</strong>g.<br />
Heat Pump – a mach<strong>in</strong>e (very similar to a chiller) used for generat<strong>in</strong>g heat from energy sources<br />
that are too low <strong>in</strong> temperature to be useful directly.<br />
GJ – Giga-Joule, a billion Joules, a unit of heat commonly used <strong>in</strong> the natural gas <strong>in</strong>dustry <strong>in</strong><br />
Canada.<br />
HVAC – heat<strong>in</strong>g, ventilation and air condition<strong>in</strong>g; the acronym is an <strong>in</strong>dicator that these<br />
functions must be viewed holistically.<br />
kJ – kilo-Joule, a thousand Joules, 1 kJ per second = 1 kW<br />
kWe – kilo-Watts of electricity<br />
kWt - kilo-Watts thermal, heat or cool<strong>in</strong>g, depend<strong>in</strong>g on context<br />
91
TRCA Pearson Eco-Bus<strong>in</strong>ess Zone <strong>District</strong> <strong>Energy</strong> <strong>Feasibility</strong> <strong>Study</strong> 10 April 2012<br />
Appendices<br />
L/s – litres/second; 1 L/s = approximately 13.2 Imperial Gallons per M<strong>in</strong>ute (IGPM)<br />
MBH – a thousand Btu per hour, commonly used <strong>in</strong> the HVAC <strong>in</strong>dustry to express the capacity<br />
of boilers; can refer to <strong>in</strong>put fuel consumption or output of thermal energy<br />
m – metres; approximately 1,609 m = 1 mile<br />
m 2 – square metres, 1 m 2 = 10.746 square feet, 10,000 m 2 = 1 hectare<br />
MMBtu – 1 million Btu<br />
MWe – Mega-Watts of electricity<br />
MWt – Mega-Watts thermal, heat or cool<strong>in</strong>g, depend<strong>in</strong>g on context<br />
MWhe – Mega-Watt hours of electricity<br />
MWht – MegaWatt hours thermal, heat or cool<strong>in</strong>g, depend<strong>in</strong>g on context; 1 MWht = 3.6 GJ =<br />
3.412 MMBtu<br />
(kWe, kWt. MWe, MWt and MBH are units of peak load or capacity, while kWhe, kWht, MWhe,<br />
MWht, MMBtu and GJ are units of energy)<br />
Primary or Primary Side – refers to the hot water and/or chilled water system on the supplier’s<br />
side of the ETS<br />
Secondary or Secondary Side – refers to the hot water and/or chilled water system on the<br />
customer’s side of the ETS.<br />
Ton – a unit of cool<strong>in</strong>g demand or capacity commonly used <strong>in</strong> the HVAC <strong>in</strong>dustry; 1 ton =<br />
12,000 BTU per hour or 3.516 kWt; 1 MWt = 284 tons<br />
Ton-hour - a unit of cool<strong>in</strong>g energy; 1 ton-hour = 3.516 kWht or 1 MWht = 284 ton-hours<br />
Tonne – a unit of mass = 1,000 kilo-grams<br />
TES – Thermal <strong>Energy</strong> Storage (hot or cold)<br />
VFD – variable frequency drives, allows for pumps to vary water flow accord<strong>in</strong>g to demand <strong>in</strong><br />
heat<strong>in</strong>g and cool<strong>in</strong>g systems on the primary and/or secondary side<br />
92
TRCA Pearson Eco-Bus<strong>in</strong>ess Zone <strong>District</strong> <strong>Energy</strong> <strong>Feasibility</strong> <strong>Study</strong> 10 April 2012<br />
Appendices<br />
12 Appendix B: Build<strong>in</strong>g Surveys<br />
93
Bldg. No.1: Hilton Garden Inn<br />
Basic Build<strong>in</strong>g Data<br />
Build<strong>in</strong>g Name Hilton Garden Inn<br />
Build<strong>in</strong>g Address 3311 Caroga Drive<br />
Build<strong>in</strong>g Use Hotel<br />
Hours of Operation 24/7<br />
Total Build<strong>in</strong>g Area 13,477 m² (145,000 ft²)<br />
No. of Stories 15 above grade/2 below<br />
Current Installed Capacity 1,230 kW heat<strong>in</strong>g/885 kW DHW<br />
Build<strong>in</strong>g Age 2009<br />
Age of Equipment Same<br />
Build<strong>in</strong>g HVAC System Description:<br />
The Hilton Garden Inn has a two-pipe distributed heat pump system that provides heat<strong>in</strong>g and<br />
cool<strong>in</strong>g to the hotel rooms. The heat for the heat pump loop is provided by two (2) Loch<strong>in</strong>var<br />
natural gas fired boilers each rated at 515 kW (1,759.5 MBH output/2,070 MBH <strong>in</strong>put);<br />
additional heat <strong>in</strong> the heat pump loop is rejected through a cool<strong>in</strong>g tower (approximated at 250<br />
ton capacity). The boilers are located <strong>in</strong> the basement mechanical room. There are 290 Trane<br />
water source heat pumps throughout the build<strong>in</strong>g with a total <strong>in</strong>stalled capacity of 1100 kW<br />
heat<strong>in</strong>g and 250 tons cool<strong>in</strong>g.<br />
Two additional hot water boilers, Loch<strong>in</strong>var natural gas boilers rated at 100 kW each (340 MBH<br />
output/400 MBH <strong>in</strong>put) supply the space heat<strong>in</strong>g for the basement levels, the pool/hot tub<br />
heat<strong>in</strong>g, and the snowmelt systems.<br />
There are three (3) separate DHW systems, each comprised of two boilers and two storage<br />
tank; one system each for the laundry, the lower floors (basement to the 6 th floor), the upper<br />
floors (7 th – 15 th floors). The DHW systems are located <strong>in</strong> the basement and penthouse<br />
mechanical room.
Hilton Garden Inn: 3311 Caroga Drive - Self Generation Costs (Annual Costs)<br />
L<strong>in</strong>e Values<br />
1 Peak Load Heat<strong>in</strong>g 825 kW<br />
2 Equivalent Full Load Hours 2,500<br />
3 Annual Heat<strong>in</strong>g <strong>Energy</strong> Requirement 2,063 MWh<br />
4 Seasonal Efficiency 60%<br />
5 Total Annual Fuel Input (Natural Gas, MWh) 3,438 MWh<br />
6 Total Annual Fuel Input (Natural Gas, GJ) 12,375 GJ<br />
7 Current Average Fuel Price $10.94 /GJ<br />
8 Total Fuel Cost (1) (L<strong>in</strong>e 6 x L<strong>in</strong>e 7): $135,400<br />
9 Current Operation & Ma<strong>in</strong>tenance of the Heat<strong>in</strong>g Plant<br />
10 Electricity for Boiler $1,400<br />
11 Water, Sewer, Water Treatment $3,100<br />
12 Equipment Insurance $2,600<br />
13 Preventative Ma<strong>in</strong>tenance & Repair $5,200<br />
14 Adm<strong>in</strong>istration and Management $800<br />
15 Labour Cost (0.125 FTE) $7,500<br />
16 Total Operation & Ma<strong>in</strong>tenance Cost (2): $20,600<br />
17 Capital Replacement Avoidance Cost<br />
18 Escalated Capital Replacement Cost (@3%) $562,000<br />
19<br />
Total S<strong>in</strong>k<strong>in</strong>g Annual Fund Equivalent of Future Replacement<br />
Cost Subtotal (3):<br />
$26,900<br />
20 Total Annual Cost of On-Site Heat<strong>in</strong>g Production (1) + (2) + (3): $182,900<br />
21 Total Annual Non-Fuel Costs (2) + (3): $47,500
Bldg. No.2: Fairfield Inn & Suites (Marriott) Toronto Airport<br />
Basic Build<strong>in</strong>g Data<br />
Build<strong>in</strong>g Name Fairfield Inn & Suites (Marriott) Toronto Airport<br />
Build<strong>in</strong>g Address 3299 Caroga Drive<br />
Build<strong>in</strong>g Use Hotel<br />
Hours of Operation 24/7<br />
Total Build<strong>in</strong>g Area 10,424 m² (112,200 ft²)<br />
No. of Stories 11 above grade<br />
Current Installed Capacity Unknown<br />
Build<strong>in</strong>g Age Unknown<br />
Age of Equipment<br />
Build<strong>in</strong>g HVAC System Description: Unknown<br />
Fairfield Inn & Suites (Marriott) Toronto Airport: 3299 Caroga Drive - Self Generation<br />
Costs (Annual Costs)<br />
L<strong>in</strong>e Values<br />
1 Peak Load Heat<strong>in</strong>g 600 kW<br />
2 Equivalent Full Load Hours 1,300<br />
3 Annual Heat<strong>in</strong>g <strong>Energy</strong> Requirement 780 MWh<br />
4 Seasonal Efficiency 60%<br />
5 Total Annual Fuel Input (Natural Gas, MWh) 1,300 MWh<br />
6 Total Annual Fuel Input (Natural Gas, GJ) 4,680 GJ<br />
7 Current Average Fuel Price $10.94 /GJ<br />
8 Total Fuel Cost (1) (L<strong>in</strong>e 6 x L<strong>in</strong>e 7): $51,200<br />
9 Current Operation & Ma<strong>in</strong>tenance of the Heat<strong>in</strong>g Plant<br />
10 Electricity for Boiler $500<br />
11 Water, Sewer, Water Treatment $1,200<br />
12 Equipment Insurance $1,400<br />
13 Preventative Ma<strong>in</strong>tenance & Repair $2,000<br />
14 Adm<strong>in</strong>istration and Management $800<br />
15 Labour Cost (0.125 FTE) $7,500<br />
16 Total Operation & Ma<strong>in</strong>tenance Cost (2): $13,400<br />
17 Capital Replacement Avoidance Cost<br />
18 Escalated Capital Replacement Cost (@3%) $297,500<br />
19<br />
Total S<strong>in</strong>k<strong>in</strong>g Annual Fund Equivalent of Future Replacement<br />
Cost Subtotal (3):<br />
$14,300<br />
20 Total Annual Cost of On-Site Heat<strong>in</strong>g Production (1) + (2) + (3): $78,900<br />
21 Total Annual Non-Fuel Costs (2) + (3): $27,700
Bldg. No.3: Hampton Inn & Suites<br />
Basic Build<strong>in</strong>g Data<br />
Build<strong>in</strong>g Name Hampton Inn & Suites<br />
Build<strong>in</strong>g Address 3279 Caroga Drive<br />
Build<strong>in</strong>g Use Hotel<br />
Hours of Operation 24/7<br />
Total Build<strong>in</strong>g Area TBD m² (TBD ft²)<br />
No. of Stories 9 above grade/1 below<br />
Current Installed Capacity 156 kW pool/laundry heat<strong>in</strong>g /500 kW DHW<br />
Build<strong>in</strong>g Age 2003<br />
Age of Equipment<br />
Build<strong>in</strong>g HVAC System Description:<br />
Rooms are heated with electric resistance elements, likely <strong>in</strong> through-the-wall package heat<br />
pump or air condition<strong>in</strong>g units. There are two direct fired make up air units with DX cool<strong>in</strong>g<br />
coils that serve the common areas.<br />
The heat<strong>in</strong>g for the pool and laundry are provided by one hot water boiler, Laars 156 kW<br />
output (531 MBH/625 MBH <strong>in</strong>put), located <strong>in</strong> the basement mechanical room.<br />
The domestic hot water system is comprised of two (2) boilers, Laars 250 kW output<br />
(850MBH/1,000 MBH <strong>in</strong>put) and two (2) 1,100 gal. Loch<strong>in</strong>var storage tanks located <strong>in</strong> the<br />
penthouse. mechanical room.
Hampton Inn & Suites: 3279 Caroga Drive - Self Generation Costs (Annual Costs)<br />
L<strong>in</strong>e Values<br />
1 Peak Load Heat<strong>in</strong>g 400 kW<br />
2 Equivalent Full Load Hours 2,000<br />
3 Annual Heat<strong>in</strong>g <strong>Energy</strong> Requirement 800 MWh<br />
4 Seasonal Efficiency 60%<br />
5 Total Annual Fuel Input (Natural Gas, MWh) 1,333 MWh<br />
6 Total Annual Fuel Input (Natural Gas, GJ) 4,800 GJ<br />
7 Current Average Fuel Price $10.94 /GJ<br />
8 Total Fuel Cost (1) (L<strong>in</strong>e 6 x L<strong>in</strong>e 7): $52,500<br />
9 Current Operation & Ma<strong>in</strong>tenance of the Heat<strong>in</strong>g Plant<br />
10 Electricity for Boiler $600<br />
11 Water, Sewer, Water Treatment $1,200<br />
12 Equipment Insurance $600<br />
13 Preventative Ma<strong>in</strong>tenance & Repair $2,000<br />
14 Adm<strong>in</strong>istration and Management $800<br />
15 Labour Cost (0.125 FTE) $7,500<br />
16 Total Operation & Ma<strong>in</strong>tenance Cost (2): $12,700<br />
17 Capital Replacement Avoidance Cost<br />
18 Escalated Capital Replacement Cost (@3%) $132,200<br />
19<br />
Total S<strong>in</strong>k<strong>in</strong>g Annual Fund Equivalent of Future Replacement<br />
Cost Subtotal (3):<br />
$6,300<br />
20 Total Annual Cost of On-Site Heat<strong>in</strong>g Production (1) + (2) + (3): $71,500<br />
21 Total Annual Non-Fuel Costs (2) + (3): $19,000
Bldg. No.4: Airway Centre<br />
Basic Build<strong>in</strong>g Data<br />
Build<strong>in</strong>g Name Airway Centre<br />
Build<strong>in</strong>g Address 5955 Airport Road<br />
Build<strong>in</strong>g Use 4 or 5 Office Build<strong>in</strong>gs<br />
Hours of Operation 24/7<br />
Total Build<strong>in</strong>g Area TBD m² (TBD ft²) 440,000 or 675,000 ft2<br />
No. of Stories<br />
Current Installed Capacity<br />
Build<strong>in</strong>g Age<br />
Age of Equipment<br />
Build<strong>in</strong>g HVAC System Description:<br />
The build<strong>in</strong>g(s) has a heat pump system to provide heat<strong>in</strong>g and cool<strong>in</strong>g. The account manager<br />
<strong>in</strong>dicated that there were a total of fifteen (15) gas fired boilers rated at ~375 kW output (1275<br />
MBH/1500 MBH <strong>in</strong>put) each between the 4-5 office build<strong>in</strong>gs. The build<strong>in</strong>g representative<br />
estimated that there are approximately 20-22 heat pumps per floor of each build<strong>in</strong>g (total<strong>in</strong>g<br />
600-700 units).<br />
No additional <strong>in</strong>formation.
Airway Centre: 5955 Airport Road - Self Generation Costs (Annual Costs)<br />
L<strong>in</strong>e Values<br />
1 Peak Load Heat<strong>in</strong>g 1,400 kW<br />
2 Equivalent Full Load Hours 2,200<br />
3 Annual Heat<strong>in</strong>g <strong>Energy</strong> Requirement 3,080 MWh<br />
4 Seasonal Efficiency 60%<br />
5 Total Annual Fuel Input (Natural Gas, MWh) 5,133 MWh<br />
6 Total Annual Fuel Input (Natural Gas, GJ) 18,480 GJ<br />
7 Current Average Fuel Price $10.94 /GJ<br />
8 Total Fuel Cost (1) (L<strong>in</strong>e 6 x L<strong>in</strong>e 7): $202,200<br />
9 Current Operation & Ma<strong>in</strong>tenance of the Heat<strong>in</strong>g Plant<br />
10 Electricity for Boiler $2,200<br />
11 Water, Sewer, Water Treatment $4,600<br />
12 Equipment Insurance $9,000<br />
13 Preventative Ma<strong>in</strong>tenance & Repair $7,700<br />
14 Adm<strong>in</strong>istration and Management $800<br />
15 Labour Cost (0.125 FTE) $7,500<br />
16 Total Operation & Ma<strong>in</strong>tenance Cost (2): $31,800<br />
17 Capital Replacement Avoidance Cost<br />
18 Escalated Capital Replacement Cost (@3%) $2,042,900<br />
19<br />
Total S<strong>in</strong>k<strong>in</strong>g Annual Fund Equivalent of Future Replacement<br />
Cost Subtotal (3):<br />
$91,300<br />
20 Total Annual Cost of On-Site Heat<strong>in</strong>g Production (1) + (2) + (3): $325,300<br />
21 Total Annual Non-Fuel Costs (2) + (3): $123,100
Bldg. No.5: Hilton Toronto Airport<br />
Basic Build<strong>in</strong>g Data<br />
Build<strong>in</strong>g Name Hilton Toronto Airport<br />
Build<strong>in</strong>g Address 5827 Airport Road<br />
Build<strong>in</strong>g Use Hotel<br />
Hours of Operation 24/7<br />
Total Build<strong>in</strong>g Area 29,000 m² (311,850 ft²)<br />
No. of Stories 11<br />
Current Installed Capacity<br />
Build<strong>in</strong>g Age 1971 south tower/1987 north tower<br />
Age of Equipment<br />
Build<strong>in</strong>g HVAC System Description:<br />
The rooms are equipped with water source heat pumps; the source/s<strong>in</strong>k for the heat pumps is<br />
supplied by central boiler/cool<strong>in</strong>g tower loop. The north tower has two 370 kW (1266 MBH<br />
output) boilers and the south tower has two 350 kW (1200 MBH output) boilers.<br />
The DHW system is supplied by 2 x 350 kW (1200 MBH) boilers <strong>in</strong> the north tower (mezzan<strong>in</strong>e<br />
mechanical room) and 3 x 295 kW (1010 MBH) boilers <strong>in</strong> the south tower basement<br />
mechanical room.<br />
There are multiple direct gas fired MUA units throughout the build<strong>in</strong>g to heat and cool the<br />
common areas (i.e. nigh club, ball room, meet<strong>in</strong> room, lobby etc.) There are approximately 15<br />
units throughout the north and south towers (conference level roof, south 3 rd floor roof, north<br />
mezzan<strong>in</strong>e and 9 th floor roof (total capacity estimated at ~ 1,100 kW (3,785 mBtu – equipment<br />
schedule provided by chief eng<strong>in</strong>eer 2008 survey).
Hilton Toronto Airport: 5827 Airport Road - Self Generation Costs (Annual Costs)<br />
L<strong>in</strong>e Values<br />
1 Peak Load Heat<strong>in</strong>g 1,600 kW<br />
2 Equivalent Full Load Hours 1,750<br />
3 Annual Heat<strong>in</strong>g <strong>Energy</strong> Requirement 2,800 MWh<br />
4 Seasonal Efficiency 60%<br />
5 Total Annual Fuel Input (Natural Gas, MWh) 4,667 MWh<br />
6 Total Annual Fuel Input (Natural Gas, GJ) 16,800 GJ<br />
7 Current Average Fuel Price $10.94 /GJ<br />
8 Total Fuel Cost (1) (L<strong>in</strong>e 6 x L<strong>in</strong>e 7): $183,000<br />
9 Current Operation & Ma<strong>in</strong>tenance of the Heat<strong>in</strong>g Plant<br />
10 Electricity for Boiler $2,000<br />
11 Water, Sewer, Water Treatment $4,200<br />
12 Equipment Insurance $3,100<br />
13 Preventative Ma<strong>in</strong>tenance & Repair $7,000<br />
14 Adm<strong>in</strong>istration and Management $800<br />
15 Labour Cost (0.125 FTE) $7,500<br />
16 Total Operation & Ma<strong>in</strong>tenance Cost (2): $24,600<br />
17 Capital Replacement Avoidance Cost<br />
18 Escalated Capital Replacement Cost (@3%) $606,504<br />
19<br />
Total S<strong>in</strong>k<strong>in</strong>g Annual Fund Equivalent of Future Replacement<br />
Cost Subtotal (3):<br />
$401200<br />
20 Total Annual Cost of On-Site Heat<strong>in</strong>g Production (1) + (2) + (3): $248,500<br />
21 Total Annual Non-Fuel Costs (2) + (3): $64,700
Bldg. No.6: Holiday Inn Toronto Airport<br />
Basic Build<strong>in</strong>g Data<br />
Build<strong>in</strong>g Name Holiday Inn Toronto Airport<br />
Build<strong>in</strong>g Address 970 Dixon Road<br />
Build<strong>in</strong>g Use Hotel<br />
Hours of Operation 24/7<br />
Total Build<strong>in</strong>g Area Est. 18,395 m² (198,000 ft²)<br />
No. of Stories 10<br />
Current Installed Capacity Unknown<br />
Build<strong>in</strong>g Age Unknown<br />
Age of Equipment Unknown<br />
Build<strong>in</strong>g HVAC System Description:<br />
Unknown<br />
Holiday Inn Toronto Airport: 970 Dixon Road - Self Generation Costs (Annual Costs)<br />
L<strong>in</strong>e Values<br />
1 Peak Load Heat<strong>in</strong>g 1,400 kW<br />
2 Equivalent Full Load Hours 2,100<br />
3 Annual Heat<strong>in</strong>g <strong>Energy</strong> Requirement 2,940 MWh<br />
4 Seasonal Efficiency 60%<br />
5 Total Annual Fuel Input (Natural Gas, MWh) 4,900 MWh<br />
6 Total Annual Fuel Input (Natural Gas, GJ) 17,640 GJ<br />
7 Current Average Fuel Price $10.94 /GJ<br />
8 Total Fuel Cost (1) (L<strong>in</strong>e 6 x L<strong>in</strong>e 7): $193,000<br />
9 Current Operation & Ma<strong>in</strong>tenance of the Heat<strong>in</strong>g Plant<br />
10 Electricity for Boiler $2,100<br />
11 Water, Sewer, Water Treatment $4,400<br />
12 Equipment Insurance $2,100<br />
13 Preventative Ma<strong>in</strong>tenance & Repair $7,400<br />
14 Adm<strong>in</strong>istration and Management $800<br />
15 Labour Cost (0.125 FTE) $7,500<br />
16 Total Operation & Ma<strong>in</strong>tenance Cost (2): $24,300<br />
17 Capital Replacement Avoidance Cost<br />
18 Escalated Capital Replacement Cost (@3%) $462,797<br />
19<br />
Total S<strong>in</strong>k<strong>in</strong>g Annual Fund Equivalent of Future Replacement<br />
Cost Subtotal (3):<br />
$22,200<br />
20 Total Annual Cost of On-Site Heat<strong>in</strong>g Production (1) + (2) + (3): $239,500<br />
21 Total Annual Non-Fuel Costs (2) + (3): $46,500
Bldg. No.7: West<strong>in</strong> Bristol Place<br />
Basic Build<strong>in</strong>g Data<br />
Build<strong>in</strong>g Name West<strong>in</strong> Bristol Place<br />
Build<strong>in</strong>g Address 5827 Airport Road<br />
Build<strong>in</strong>g Use Hotel<br />
Hours of Operation 24/7<br />
Total Build<strong>in</strong>g Area 14,870 m² (160,000 ft²)<br />
No. of Stories 14 above/1 below<br />
Current Installed Capacity 2060 kW Htg/1670 kW DHW/300 tons<br />
Build<strong>in</strong>g Age 1974<br />
Age of Equipment ~ 7 years old<br />
Build<strong>in</strong>g HVAC System Description:<br />
Each room is equipped with a 2 pipe fan coil unit that is supplied off the central boiler/chiller<br />
system.<br />
The heat<strong>in</strong>g system is comprised of four boilers each 515 kW (1759 MBH) output. There is a<br />
300 ton cool<strong>in</strong>g tower/chiller. MUA supplied by gas fired rooftop units approx. capacity<br />
accord<strong>in</strong>g to report by EMG = 3000 MBH (880 kW). Property report <strong>in</strong>dicates there are four<br />
gas fired make up air units on the roof total<strong>in</strong>g 3000 MBH (880 kW) capacity.<br />
The DHW is supplied by four DHW boilers 2 x 350 kW (1200 MBH) + 2 x 485 kW (1658 MBH).
West<strong>in</strong> Bristol Place: 5827 Airport Road - Self Generation Costs (Annual Costs)<br />
L<strong>in</strong>e Values<br />
1 Peak Load Heat<strong>in</strong>g 1,600 kW<br />
2 Equivalent Full Load Hours 2,300<br />
3 Annual Heat<strong>in</strong>g <strong>Energy</strong> Requirement 3,680 MWh<br />
4 Seasonal Efficiency 60%<br />
5 Total Annual Fuel Input (Natural Gas, MWh) 6,133 MWh<br />
6 Total Annual Fuel Input (Natural Gas, GJ) 22,080 GJ<br />
7 Current Average Fuel Price $10.94 /GJ<br />
8 Total Fuel Cost (1) (L<strong>in</strong>e 6 x L<strong>in</strong>e 7): $241,600<br />
9 Current Operation & Ma<strong>in</strong>tenance of the Heat<strong>in</strong>g Plant<br />
10 Electricity for Boiler $2,600<br />
11 Water, Sewer, Water Treatment $5,500<br />
12 Equipment Insurance $3,800<br />
13 Preventative Ma<strong>in</strong>tenance & Repair $9,200<br />
14 Adm<strong>in</strong>istration and Management $800<br />
15 Labour Cost (0.125 FTE) $7,500<br />
16 Total Operation & Ma<strong>in</strong>tenance Cost (2): $29,400<br />
17 Capital Replacement Avoidance Cost<br />
18 Escalated Capital Replacement Cost (@3%) $734,300<br />
19<br />
Total S<strong>in</strong>k<strong>in</strong>g Annual Fund Equivalent of Future Replacement<br />
Cost Subtotal (3):<br />
$48,500<br />
20 Total Annual Cost of On-Site Heat<strong>in</strong>g Production (1) + (2) + (3): $319,500<br />
21 Total Annual Non-Fuel Costs (2) + (3): $77,900
Bldg. No. 8: Quality Suites Toronto Airport<br />
Basic Build<strong>in</strong>g Data<br />
Build<strong>in</strong>g Name Quality Suite Toronto Airport<br />
Build<strong>in</strong>g Address 262 Carl<strong>in</strong>gview,<br />
Build<strong>in</strong>g Use Hotel<br />
Hours of Operation 24/7<br />
Total Build<strong>in</strong>g Area 15,645 m² (168,350 ft²)<br />
No. of Stories 12 above grade/1 below<br />
Current Installed Capacity 2,050 kW<br />
Build<strong>in</strong>g Age 1993 (~18 years)<br />
Age of Equipment same<br />
Build<strong>in</strong>g HVAC System Description:<br />
Each room is equipped with a 2 pipe fan coil unit that is supplied off the central boiler/chiller<br />
system. The heat<strong>in</strong>g system is comprised of two boilers each 1025 kW (3500 MBH) output.<br />
Heat<strong>in</strong>g water is supplied at ~76.7 °C(170°F) There is a 150 ton cool<strong>in</strong>g tower/chiller.<br />
Make up air issupplied by hydronic rooftop units off of the boiler loop.<br />
DHW hot water system is provided by 2 x 440 kW (1500 MBH) boilers <strong>in</strong> conjunction with 2 x<br />
120 gal. hot water storage tanks. The equipment is located <strong>in</strong> the penthouse mechanical<br />
room.
Quality Suite Toronto Airport: 262 Carl<strong>in</strong>gview - Self Generation Costs (Annual Costs)<br />
L<strong>in</strong>e Values<br />
1 Peak Load Heat<strong>in</strong>g 900 kW<br />
2 Equivalent Full Load Hours 2,100<br />
3 Annual Heat<strong>in</strong>g <strong>Energy</strong> Requirement 1,890 MWh<br />
4 Seasonal Efficiency 60%<br />
5 Total Annual Fuel Input (Natural Gas, MWh) 3,150 MWh<br />
6 Total Annual Fuel Input (Natural Gas, GJ) 11,340 GJ<br />
7 Current Average Fuel Price $10.94 /GJ<br />
8 Total Fuel Cost (1) (L<strong>in</strong>e 6 x L<strong>in</strong>e 7): $124,100<br />
9 Current Operation & Ma<strong>in</strong>tenance of the Heat<strong>in</strong>g Plant<br />
10 Electricity for Boiler $1,300<br />
11 Water, Sewer, Water Treatment $2,800<br />
12 Equipment Insurance $3,400<br />
13 Preventative Ma<strong>in</strong>tenance & Repair $4,700<br />
14 Adm<strong>in</strong>istration and Management $800<br />
15 Labour Cost (0.125 FTE) $7,500<br />
16 Total Operation & Ma<strong>in</strong>tenance Cost (2): $20,500<br />
17 Capital Replacement Avoidance Cost<br />
18 Escalated Capital Replacement Cost (@3%) $521,700<br />
19<br />
Total S<strong>in</strong>k<strong>in</strong>g Annual Fund Equivalent of Future Replacement<br />
Cost Subtotal (3):<br />
$99,300<br />
20 Total Annual Cost of On-Site Heat<strong>in</strong>g Production (1) + (2) + (3): $243,900<br />
21 Total Annual Non-Fuel Costs (2) + (3): $119,800
Bldg. No. 9: Travel Lodge<br />
Basic Build<strong>in</strong>g Data<br />
Build<strong>in</strong>g Name Travel Lodge<br />
Build<strong>in</strong>g Address 925 Dixon Road, Toronto, ON<br />
Build<strong>in</strong>g Use Hotel<br />
Hours of Operation 24/7<br />
Total Build<strong>in</strong>g Area 15,685 m² (168,760 ft²)<br />
No. of Stories 17 above grade/1 below<br />
Current Installed Capacity<br />
Build<strong>in</strong>g Age 1983<br />
Age of Equipment Same (new DHW – 4 years old)<br />
Build<strong>in</strong>g HVAC System Description:<br />
Rooms have split type air condition<strong>in</strong>g units with electric resistance heat<strong>in</strong>g coils rat<strong>in</strong>g from<br />
7200 – 8200 watts each.<br />
DHW/laundry is provided by 4 x 280 kW (961 MBH) gas fired boilers with 2 x 2000 gal storage<br />
tanks.<br />
Common space heat<strong>in</strong>g is done by gas fired 4 x 470 MBH <strong>in</strong>put + 720 MBH <strong>in</strong>put MUA units.
Travel Lodge: 925 Dixon Road - Self Generation Costs (Annual Costs)<br />
L<strong>in</strong>e Values<br />
1 Peak Load Heat<strong>in</strong>g 600 kW<br />
2 Equivalent Full Load Hours 2,100<br />
3 Annual Heat<strong>in</strong>g <strong>Energy</strong> Requirement 1,260 MWh<br />
4 Seasonal Efficiency 60%<br />
5 Total Annual Fuel Input (Natural Gas, MWh) 2,100 MWh<br />
6 Total Annual Fuel Input (Natural Gas, GJ) 7,560 GJ<br />
7 Current Average Fuel Price $10.94 /GJ<br />
8 Total Fuel Cost (1) (L<strong>in</strong>e 6 x L<strong>in</strong>e 7): $82,700<br />
9 Current Operation & Ma<strong>in</strong>tenance of the Heat<strong>in</strong>g Plant<br />
10 Electricity for Boiler $900<br />
11 Water, Sewer, Water Treatment $1,900<br />
12 Equipment Insurance $800<br />
13 Preventative Ma<strong>in</strong>tenance & Repair $3,200<br />
14 Adm<strong>in</strong>istration and Management $800<br />
15 Labour Cost (0.125 FTE) $7,500<br />
16 Total Operation & Ma<strong>in</strong>tenance Cost (2): $15,100<br />
17 Capital Replacement Avoidance Cost<br />
18 Escalated Capital Replacement Cost (@3%) $155,800<br />
19<br />
Total S<strong>in</strong>k<strong>in</strong>g Annual Fund Equivalent of Future Replacement<br />
Cost Subtotal (3):<br />
$8,700<br />
20 Total Annual Cost of On-Site Heat<strong>in</strong>g Production (1) + (2) + (3): $106,500<br />
21 Total Annual Non-Fuel Costs (2) + (3): $23,800
Bldg. No. 10: Courtyard by Marriott<br />
Basic Build<strong>in</strong>g Data<br />
Build<strong>in</strong>g Name Courtyard by Marriott<br />
Build<strong>in</strong>g Address 231 Carl<strong>in</strong>gview Drive<br />
Build<strong>in</strong>g Use Hotel<br />
Hours of Operation 24/7<br />
Total Build<strong>in</strong>g Area 30,100 m² (324,000 ft²)<br />
No. of Stories 8<br />
Current Installed Capacity<br />
Build<strong>in</strong>g Age<br />
Age of Equipment<br />
Build<strong>in</strong>g HVAC System Description:<br />
Unknown
Courtyard by Marriott: 231 Carl<strong>in</strong>gview Drive - Self Generation Costs (Annual Costs)<br />
L<strong>in</strong>e Values<br />
1 Peak Load Heat<strong>in</strong>g 2,100 kW<br />
2 Equivalent Full Load Hours 2,100<br />
3 Annual Heat<strong>in</strong>g <strong>Energy</strong> Requirement 4,410 MWh<br />
4 Seasonal Efficiency 60%<br />
5 Total Annual Fuel Input (Natural Gas, MWh) 7,350 MWh<br />
6 Total Annual Fuel Input (Natural Gas, GJ) 26,460 GJ<br />
7 Current Average Fuel Price $10.94 /GJ<br />
8 Total Fuel Cost (1) (L<strong>in</strong>e 6 x L<strong>in</strong>e 7): $289,500<br />
9 Current Operation & Ma<strong>in</strong>tenance of the Heat<strong>in</strong>g Plant<br />
10 Electricity for Boiler $3,100<br />
11 Water, Sewer, Water Treatment $6,600<br />
12 Equipment Insurance $4,900<br />
13 Preventative Ma<strong>in</strong>tenance & Repair $11,000<br />
14 Adm<strong>in</strong>istration and Management $800<br />
15 Labour Cost (0.125 FTE) $7,500<br />
16 Total Operation & Ma<strong>in</strong>tenance Cost (2): $33,900<br />
17 Capital Replacement Avoidance Cost<br />
18 Escalated Capital Replacement Cost (@3%) $1,074,400<br />
19<br />
Total S<strong>in</strong>k<strong>in</strong>g Annual Fund Equivalent of Future Replacement<br />
Cost Subtotal (3):<br />
$51,500<br />
20 Total Annual Cost of On-Site Heat<strong>in</strong>g Production (1) + (2) + (3): $374,900<br />
21 Total Annual Non-Fuel Costs (2) + (3): $85,400
Bldg. No. 11: Toronto Marriott Airport Hotel<br />
Basic Build<strong>in</strong>g Data<br />
Build<strong>in</strong>g Name Toronto Marriott Airport Hotel<br />
Build<strong>in</strong>g Address 901 Dixon Road<br />
Build<strong>in</strong>g Use Hotel<br />
Hours of Operation 24/7<br />
Total Build<strong>in</strong>g Area 30,100 m² (324,000 ft²)<br />
No. of Stories<br />
Current Installed Capacity<br />
9<br />
Build<strong>in</strong>g Age<br />
Age of Equipment<br />
1985<br />
Build<strong>in</strong>g HVAC System Description:<br />
Two gas fired Cleaverbrooks boilers each rated at 3000 kW (10.45 MMBtu/hr) <strong>in</strong>put provide the<br />
hot water space heat<strong>in</strong>g for the build<strong>in</strong>g.<br />
The DHW system is comprised of five 230 kW (800 MBH) (<strong>in</strong>put) condens<strong>in</strong>g boilers along with<br />
a 5,000 L storage tank. DHW boilers were newly replaced <strong>in</strong> 2011.<br />
Each room is equipped with a four pipe fan coil. Gas to the heat<strong>in</strong>g system is metered<br />
separately from the gas for the laundry/DHW.
Toronto Marriott Airport Hotel: 901 Dixon Road - Self Generation Costs (Annual Costs)<br />
L<strong>in</strong>e Values<br />
1 Peak Load Heat<strong>in</strong>g 2,200 kW<br />
2 Equivalent Full Load Hours 2,000<br />
3 Annual Heat<strong>in</strong>g <strong>Energy</strong> Requirement 4,400 MWh<br />
4 Seasonal Efficiency 60%<br />
5 Total Annual Fuel Input (Natural Gas, MWh) 7,333 MWh<br />
6 Total Annual Fuel Input (Natural Gas, GJ) 26,400 GJ<br />
7 Current Average Fuel Price $10.94 /GJ<br />
8 Total Fuel Cost (1) (L<strong>in</strong>e 6 x L<strong>in</strong>e 7): $288,800<br />
9 Current Operation & Ma<strong>in</strong>tenance of the Heat<strong>in</strong>g Plant<br />
10 Electricity for Boiler $3,100<br />
11 Water, Sewer, Water Treatment $6,600<br />
12 Equipment Insurance $4,900<br />
13 Preventative Ma<strong>in</strong>tenance & Repair $11,000<br />
14 Adm<strong>in</strong>istration and Management $800<br />
15 Labour Cost (0.125 FTE) $7,500<br />
16 Total Operation & Ma<strong>in</strong>tenance Cost (2): $33,900<br />
17 Capital Replacement Avoidance Cost<br />
18 Escalated Capital Replacement Cost (@3%) $873,500<br />
19<br />
Total S<strong>in</strong>k<strong>in</strong>g Annual Fund Equivalent of Future Replacement<br />
Cost Subtotal (3):<br />
$78,000<br />
20 Total Annual Cost of On-Site Heat<strong>in</strong>g Production (1) + (2) + (3): $400,700<br />
21 Total Annual Non-Fuel Costs (2) + (3): $111,900<br />
Notes:<br />
1) Estimate does not <strong>in</strong>clude GST or PST.<br />
2) Capital replacement for heat<strong>in</strong>g only.
TRCA Pearson Eco-Bus<strong>in</strong>ess Zone <strong>District</strong> <strong>Energy</strong> <strong>Feasibility</strong> <strong>Study</strong> 10 April 2012<br />
Appendices<br />
13 Appendix C: Comparison of Potential <strong>Energy</strong> Sources<br />
The energy sources proposed for the early development phase of the DES <strong>in</strong> the Pearson Area<br />
are electricity and natural gas with deployment of CHP and hot Thermal <strong>Energy</strong> Storage (TES)<br />
optimized <strong>in</strong> l<strong>in</strong>e with build-up of heat load.<br />
The potential roles of other energy sources, which may become appropriate <strong>in</strong> future, are also<br />
briefly reviewed <strong>in</strong> this Section.<br />
13.1 Electricity<br />
<strong>District</strong> <strong>Energy</strong> Centres (DEC) supply<strong>in</strong>g district cool<strong>in</strong>g consume significant quantities of<br />
electrical power for the chillers, chiller pumps, cool<strong>in</strong>g tower pumps, cool<strong>in</strong>g tower fans and<br />
distribution pumps (although less than the aggregate amount of power that would otherwise be<br />
consumed <strong>in</strong> <strong>in</strong>dividual build<strong>in</strong>g cool<strong>in</strong>g generation systems).<br />
CHP can supply some of the DEC electrical load, but this does not dim<strong>in</strong>ish the electricity<br />
<strong>in</strong>frastructure service needs for standby supply to the DEC to ensure reliability.<br />
Coord<strong>in</strong>ation of DEC service needs with both electric and gas utilities is one of the key tasks at<br />
the prelim<strong>in</strong>ary eng<strong>in</strong>eer<strong>in</strong>g stage. The need for large power transformers for district cool<strong>in</strong>g is<br />
one of the challenges <strong>in</strong>volved <strong>in</strong> locat<strong>in</strong>g a DEC. This is the ma<strong>in</strong> motivat<strong>in</strong>g factor <strong>in</strong> FVB’s<br />
recommendation to place the DEC <strong>in</strong> a non-residential low rise build<strong>in</strong>g, such as a park<strong>in</strong>g<br />
garage or bus station.<br />
13.2 Natural Gas<br />
Natural gas-fired CHP of a similar type and scale as used <strong>in</strong> Markham would be an appropriate<br />
base load heat source for the DES envisaged to serve the Pearson Area. This design has<br />
worked well for the DES currently employed at Cornwall, Sudbury, Hamilton and Oshawa.<br />
This technology route would facilitate possible future substitution of “green gas” for natural gas.<br />
<strong>Green</strong> gas, also called pipel<strong>in</strong>e gas, is biogas that has been upgraded to the quality of natural<br />
gas and <strong>in</strong>jected <strong>in</strong>to the natural gas distribution system. The various sources of biogas are<br />
further discussed later <strong>in</strong> this report.<br />
This type of CHP is based on reciprocat<strong>in</strong>g eng<strong>in</strong>es with recovery of heat <strong>in</strong> the form of hot<br />
water. New <strong>in</strong>stallations of this type are expected to <strong>in</strong>clude Selective Catalytic Reduction<br />
(SCR) to control emissions to below the Ontario M<strong>in</strong>istry of Environment (MOE) limit for NOx<br />
from 2011 onwards of 0.4 kg/MWhe. This is a lower limit than the current MOE Guidel<strong>in</strong>e A-5<br />
for Peak<strong>in</strong>g Combustion Turb<strong>in</strong>es and is consistent with the phas<strong>in</strong>g-<strong>in</strong> of this more str<strong>in</strong>gent<br />
limit under the state-of-the-art US Environmental Protection Agency (EPA) New Source<br />
Performance Standards (NSPS) for non-road and stationary emissions.<br />
The load <strong>in</strong> Phase 1 represents an estimated peak heat<strong>in</strong>g load approach<strong>in</strong>g 12 MegaWatts<br />
thermal (MWt), with a base load of approximately 3 MWt. This heat load would optimally<br />
support approximately 4 MegaWatts electrical (MWe) of CHP.<br />
Although this would supply only a third of the peak heat demand it would provide approximately<br />
80% of the system demand for heat energy if it operated constantly. As a natural gas-fired unit,<br />
114
TRCA Pearson Eco-Bus<strong>in</strong>ess Zone <strong>District</strong> <strong>Energy</strong> <strong>Feasibility</strong> <strong>Study</strong> 10 April 2012<br />
Appendices<br />
it would probably not operate constantly but would be dispatched accord<strong>in</strong>g to its heat rate 16<br />
versus the market heat rate 17<br />
. Nevertheless, natural gas fired CHP might still provide <strong>in</strong> the<br />
order of 50% or more of the total system heat energy, depend<strong>in</strong>g on market conditions and<br />
project specific factors.<br />
The CHP would be backed up by natural gas fired standby-peak<strong>in</strong>g boilers. They would supply<br />
the system when the CHP was shutdown and <strong>in</strong> peak periods when the demand exceeds the<br />
useful heat output of the CHP.<br />
The DES would probably be started up with only the standby-peak<strong>in</strong>g boilers as the heat load<br />
will be very low until several large build<strong>in</strong>gs are <strong>in</strong>-service and fully occupied. Stag<strong>in</strong>g of CHP<br />
deployment would be managed <strong>in</strong> concert with build-up of heat load.<br />
Incorporation of CHP <strong>in</strong> the DES is predicated on suitable OPA contracts be<strong>in</strong>g available at the<br />
time that the DES would enter service.<br />
There may be a transition role for a 1 MWt condens<strong>in</strong>g natural gas fired boiler prior to <strong>in</strong>-service<br />
of CHP and to supply the base thermal load whenever the CHP is shut-down.<br />
It should be noted that even the non-condens<strong>in</strong>g boilers <strong>in</strong>stalled <strong>in</strong> a DES would achieve<br />
significantly higher measured efficiency (over 80%) than the reasonable expectation for boilers<br />
<strong>in</strong> <strong>in</strong>dividual build<strong>in</strong>gs, which is 65% (based on field studies of retrofit situations). The DES<br />
boilers have many advantages:<br />
• System diversity (load profiles of different build<strong>in</strong>gs vary somewhat)<br />
• Multiple units, staged to m<strong>in</strong>imize part-load<strong>in</strong>g<br />
• Low excess air burner with oxygen trim controls<br />
• L<strong>in</strong>ear meter<strong>in</strong>g gas valves and combustion fan <strong>in</strong>let control with modulat<strong>in</strong>g motors<br />
capable of accurate ratio control throughout the complete fir<strong>in</strong>g range and are repeatable<br />
• Seasonal reset of outlet water temperature set po<strong>in</strong>t to decrease stack temperature<br />
• Flue gas economizers to further reduce flue gas temperatures and reduce the possibility<br />
of flue gas condensation with<strong>in</strong> the boiler (for non-condens<strong>in</strong>g boilers)<br />
• Automatic stack dampers to reduce standby draft losses<br />
• Automatic water isolation valves to reduce standby water side losses<br />
• Monitor<strong>in</strong>g by Operat<strong>in</strong>g Eng<strong>in</strong>eers either remotely or otherwise to ensure peak<br />
performance of all control systems<br />
13.3 Biomass<br />
Biomass is an excellent energy source for district heat<strong>in</strong>g as it is carbon neutral, renewable,<br />
relatively low cost and could supply the total heat demand of a large DES. It could <strong>in</strong> fact meet<br />
the requirements for the DES if all build<strong>in</strong>gs <strong>in</strong> the envisaged build-out were connected. It is a<br />
possible energy source for this DES at some future time when the benefits of biomass fuel<br />
become more widely appreciated.<br />
Biomass is used for district heat<strong>in</strong>g through either heat-only boilers or CHP. It is often a baseload<br />
energy source because handl<strong>in</strong>g, combustion and pollution control systems are capital<br />
16<br />
Heat rate = fuel consumed per unit of net electricity output; for CHP this should take <strong>in</strong>to account fuel<br />
displaced by useful heat output<br />
17<br />
Market heat rate = maximum heat rate economic to operate <strong>in</strong> any hour<br />
115
TRCA Pearson Eco-Bus<strong>in</strong>ess Zone <strong>District</strong> <strong>Energy</strong> <strong>Feasibility</strong> <strong>Study</strong> 10 April 2012<br />
Appendices<br />
<strong>in</strong>tensive. In this role it would be supplemented by lower capital cost peak<strong>in</strong>g boilers, probably<br />
natural gas <strong>in</strong> this case. Similar to CHP, the high capital cost biomass facility would be<br />
deployed some years after the DES start-up when the heat load had been built up sufficiently so<br />
that fuel sav<strong>in</strong>gs provide the desired return on capital.<br />
Biomass is used <strong>in</strong> heat only boilers <strong>in</strong> district heat<strong>in</strong>g systems FVB has designed and helped<br />
br<strong>in</strong>g <strong>in</strong>-service <strong>in</strong> Oujé Bougoumou, Quebec and Revelstoke, B.C. A heat only boiler us<strong>in</strong>g<br />
gases produced <strong>in</strong> a biomass gasifier is the energy source for a small DES at Dockside <strong>Green</strong><br />
<strong>in</strong> Victoria B.C. A small biomass boiler was considered 18<br />
for the Evergreen (former Don Valley)<br />
Brickworks on Bayview Avenue <strong>in</strong> downtown Toronto.<br />
Biomass fired CHP has traditionally used a steam boiler to drive a steam turb<strong>in</strong>e generator with<br />
low pressure steam extracted and converted to hot water via heat exchangers. This is the<br />
technology used by many Pulp & Paper mills <strong>in</strong> Canada and by <strong>District</strong> <strong>Energy</strong> St Paul (St Paul,<br />
MN), <strong>in</strong> a 25 MWe/65 MWt steam turb<strong>in</strong>e CHP that FVB was <strong>in</strong>volved <strong>in</strong> conceptual design of <strong>in</strong><br />
the early 1990’s.<br />
There is a severe economy of scale <strong>in</strong> steam based processes ma<strong>in</strong>ly because of the high fixed<br />
cost of constant attendance by qualified Operat<strong>in</strong>g Eng<strong>in</strong>eers. The economic “sweet spot” is <strong>in</strong><br />
the order of size as used by <strong>District</strong> <strong>Energy</strong> St Paul, which would be too large for a DES <strong>in</strong> the<br />
Pearson Area.<br />
Organic Rank<strong>in</strong>e Cycle (ORC) technology elim<strong>in</strong>ates the need for attendance by Operat<strong>in</strong>g<br />
Eng<strong>in</strong>eers and is suitable for implementation at the scale that would be appropriate for the<br />
Pearson Area. There is currently only 1 small ORC plant <strong>in</strong> North America, but there are 116<br />
around the world ma<strong>in</strong>ly <strong>in</strong> Europe, the majority based on biomass. There are 39 ORC plants<br />
under construction, so this may truly be described as an emerg<strong>in</strong>g technology that appears to<br />
offer good prospects for implementation for DE.<br />
Another technology <strong>in</strong> an early stage of development gasifiers the wood and uses the “wood<br />
gas” <strong>in</strong> reciprocat<strong>in</strong>g eng<strong>in</strong>es. Wood gasification (<strong>in</strong> heat only mode) is the <strong>in</strong>tended base load<br />
source for a new DES at Dockside <strong>Green</strong> <strong>in</strong> Victoria, B.C. However the gasification component<br />
of this project has yet to prove itself. If it works it could be suitable for implementation <strong>in</strong> a DES<br />
to serve the Pearson Eco-Bus<strong>in</strong>ess Zone.<br />
FVB has encountered public resistance to the suggested deployment of biomass boilers <strong>in</strong><br />
Vancouver and Toronto due to concerns about emissions. However they are widely used <strong>in</strong><br />
urban sett<strong>in</strong>gs <strong>in</strong> Scand<strong>in</strong>avia where the public is environmentally sophisticated. The local<br />
opposition seems to distrust back-end emission controls such as electro-static precipitators,<br />
cyclones and scrubbers. Emission controls are <strong>in</strong>creas<strong>in</strong>gly becom<strong>in</strong>g an essential component<br />
of energy projects, e.g. SCR’s are go<strong>in</strong>g to be required to meet NOx limits from stationary<br />
eng<strong>in</strong>es from 2011 <strong>in</strong> Ontario.<br />
There seems to be no logical reason why biomass energy projects with emission controls<br />
should not become an acceptable technology for DES <strong>in</strong> the GTA. Especially as the<br />
technology becomes more well-known through gradually adoption <strong>in</strong> additional applications, e.g.<br />
through conversion of the coal-fired generat<strong>in</strong>g stations.<br />
18 Personal communication from biomass boiler supplier representative; the idea may have been shelved<br />
because there now appears to be no mention of it on the Evergreen website.<br />
116
TRCA Pearson Eco-Bus<strong>in</strong>ess Zone <strong>District</strong> <strong>Energy</strong> <strong>Feasibility</strong> <strong>Study</strong> 10 April 2012<br />
Appendices<br />
Therefore, although not recommended for the start-up phase, biomass boilers or biomass CHP<br />
should be kept as a potentially acceptable energy source that is relevant to the long-term<br />
plann<strong>in</strong>g horizon of DES development <strong>in</strong> <strong>Project</strong> <strong>Green</strong>.<br />
The form <strong>in</strong> which it would be deployed is likely to be as a satellite plant <strong>in</strong> an <strong>in</strong>dustrial area<br />
with no outside storage. It would employ <strong>in</strong>side vertical day-storage and possibly wood pellets,<br />
briquettes or torrified wood, rather than chipped wood waste, for optimal transport,<br />
storage/handl<strong>in</strong>g and lower emissions. Possible use of ORC technology or gasification either <strong>in</strong><br />
heat-only mode or with reciprocat<strong>in</strong>g eng<strong>in</strong>e based CHP. It would probably operate<br />
cont<strong>in</strong>uously with an output serv<strong>in</strong>g the system base load thereby supply<strong>in</strong>g 80-90% of the total<br />
energy consumption with the orig<strong>in</strong>ally <strong>in</strong>stalled natural gas-fired boilers meet<strong>in</strong>g the peak<br />
demand.<br />
13.4 Thermal <strong>Energy</strong> Storage<br />
Thermal energy storage has been found to work well <strong>in</strong> conjunction with CHP for district<br />
heat<strong>in</strong>g. Natural gas-fired CHP is economic to operate <strong>in</strong> Ontario only at peak times each day.<br />
In the hours it does operate a CHP unit may generate more useful heat than is immediately<br />
required by the district heat<strong>in</strong>g system especially dur<strong>in</strong>g the summer and shoulder seasons.<br />
Similarly, a biomass fired DEC might operate cont<strong>in</strong>uously at a constant output that could be<br />
higher or lower than the co<strong>in</strong>cident system demand.<br />
Hot thermal energy storage can <strong>in</strong>crease the useful heat recoverable from CHP or biomass, by<br />
enabl<strong>in</strong>g heat output to be stored for use when the unit is shutdown or its output is less than the<br />
demand. This is a process strategy used by the CHP based system of Markham <strong>District</strong> <strong>Energy</strong><br />
Inc., and the biomass based system <strong>in</strong> Charlottetown, P.E.I. and by many systems <strong>in</strong> Europe.<br />
These systems store heat energy <strong>in</strong> stratified water tanks.<br />
Some district cool<strong>in</strong>g systems (e.g. several <strong>in</strong> the U.S. and <strong>in</strong> W<strong>in</strong>dsor, Ontario) store cool<strong>in</strong>g<br />
energy that is generated at night for use dur<strong>in</strong>g the hottest part of the day. This shifts electricity<br />
demand to the lower cost hours and adds peak cool<strong>in</strong>g capacity without more chillers. Cold<br />
thermal energy storage technologies <strong>in</strong>clude stratified water and ice.<br />
The economic justification for the capital cost of cold thermal energy storage has generally been<br />
found to be difficult <strong>in</strong> Ontario to date. However it may be a useful option <strong>in</strong> the future as the<br />
difference <strong>in</strong> price between on-peak and off-peak electricity <strong>in</strong>creases and/or there are more<br />
<strong>in</strong>centives offered as a way to optimize electrical <strong>in</strong>frastructure.<br />
There is a significant economy of scale <strong>in</strong> hot and cold thermal energy storage and therefore<br />
they are more likely to be economic for a DES than for any <strong>in</strong>dividual build<strong>in</strong>g.<br />
Hot thermal energy storage is quite likely to be justifiable for the DES <strong>in</strong> the Pearson Area and<br />
<strong>in</strong>stalled some time after the first CHP unit is <strong>in</strong>stalled.<br />
13.5 Raw Sewage Heat Source<br />
The most recent and closest precedent is the 2.7 MWt heat pump recently <strong>in</strong>stalled by the City<br />
of Vancouver’s Southeast False Creek (SFC) Neighbourhood <strong>Energy</strong> Utility at the Cambie<br />
Street lift station <strong>in</strong> SFC as part of the Olympic Athletes Village development. This lift station<br />
handles a comb<strong>in</strong>ation of untreated sewage and storm water. The heat pump was<br />
commissioned recently and is currently <strong>in</strong> the early stages of operation.<br />
The potential advantages of a raw sewage heat source versus geothermal are:<br />
117
TRCA Pearson Eco-Bus<strong>in</strong>ess Zone <strong>District</strong> <strong>Energy</strong> <strong>Feasibility</strong> <strong>Study</strong> 10 April 2012<br />
Appendices<br />
higher efficiency due to higher evaporation temperature as raw sewage may be at higher<br />
temperatures than an alternative geothermal field lower overall capital from not hav<strong>in</strong>g to drill<br />
multiple deep bore holes as for geothermal<br />
However, these factors must be checked for local site conditions.<br />
It must be emphasized that the relative success of the heat pump <strong>in</strong> Vancouver is partly due to<br />
B.C. enjoy<strong>in</strong>g a much more moderate climate than other parts of Canada. This allows the<br />
build<strong>in</strong>gs to be supplied at a lower temperature more of the time. However, another factor is<br />
that the SFC system serves new development designed for lower district heat<strong>in</strong>g supply<br />
temperature; this aspect might be emulated elsewhere for new developments. In fact, FVB<br />
recently considered this heat source for other clients and as a result, there may be a similar<br />
project proceed<strong>in</strong>g <strong>in</strong> the GTA with<strong>in</strong> the next few years.<br />
One of the important requirements is access to a relatively high constant sewage flow, e.g. <strong>in</strong><br />
the order of 200 litres/second for 3 MWt. Therefore, due to the low population density of <strong>Project</strong><br />
<strong>Green</strong> there may be physical capacity limits, similar to geothermal and solar, which would<br />
prevent this technology from serv<strong>in</strong>g a large portion of the potential heat demand.<br />
13.6 Biogas<br />
Biogas consists of approximately 50-60% methane (as compared with 97% for natural gas), with<br />
the balance be<strong>in</strong>g mostly carbon dioxide. There are also some trace contam<strong>in</strong>ants, notably<br />
water vapour and hydrogen sulphide (H2S). After relatively simple dry<strong>in</strong>g and H2S removal<br />
biogas can be used <strong>in</strong> boilers and reciprocat<strong>in</strong>g eng<strong>in</strong>es for CHP much like natural gas. In fact<br />
equipment can be retro-fitted to accept natural gas if orig<strong>in</strong>ally designed to use natural gas. It<br />
may be viewed as a potential future substitute for natural gas.<br />
Biogas is recovered from landfills and <strong>in</strong> anaerobic digesters at wastewater treatment plants.<br />
Another source is from facilities for process<strong>in</strong>g the source separated organic fraction of<br />
municipal solid waste or animal waste on farms. Landfill gas has some challeng<strong>in</strong>g<br />
contam<strong>in</strong>ants, such as siloxanes, but can still be used for power or heat generation.<br />
Waste cook<strong>in</strong>g fats and oils collected from food processors and restaurants are expected to<br />
become another major source of organics for energy production. In fact, Organic Resource<br />
Management Inc. one of the largest companies <strong>in</strong> this bus<strong>in</strong>ess <strong>in</strong> Canada has its head office <strong>in</strong><br />
Woodbridge, on Steeles Avenue West. They currently collect from over 8,000 customers, dewater<br />
the material locally then ship it to Quebec for compost<strong>in</strong>g. <strong>Energy</strong> production via biogas<br />
from anaerobic digestion is seen as the highest value use for such material.<br />
In some European DES, biogas is piped for several kilo-metres from the digesters to CHP units<br />
<strong>in</strong> DEC’s. This practice could be emulated <strong>in</strong> <strong>Project</strong> <strong>Green</strong>, especially given the proximity of<br />
<strong>in</strong>dustrial areas to the planned new commercial development.<br />
Another approach that FVB has suggested to other clients is to purchase “green gas” from<br />
remotely located biogas producers <strong>in</strong> an analogous way to purchas<strong>in</strong>g “green power”.<br />
<strong>Green</strong> gas, also called pipel<strong>in</strong>e gas, is biogas that has been upgraded by removal of carbon<br />
dioxide and other contam<strong>in</strong>ants to the quality of natural gas and <strong>in</strong>jected <strong>in</strong>to the natural gas<br />
distribution system. The City of Toronto is proceed<strong>in</strong>g with two pipel<strong>in</strong>e gas projects at their<br />
planned new anaerobic digesters at the Disco and Duffer<strong>in</strong> Transfer Stations. The City of<br />
Toronto has <strong>in</strong>ternal uses for the green gas and is therefore not <strong>in</strong> the market as a supplier.<br />
However, there may be other potential green gas producers, e.g. farmers, which the DES could<br />
118
TRCA Pearson Eco-Bus<strong>in</strong>ess Zone <strong>District</strong> <strong>Energy</strong> <strong>Feasibility</strong> <strong>Study</strong> 10 April 2012<br />
Appendices<br />
contract with. Thereby fuell<strong>in</strong>g natural gas fired boilers and CHP with green gas <strong>in</strong> order to<br />
achieve a high level of susta<strong>in</strong>ability.<br />
13.7 Geothermal<br />
Geothermal energy was suggested as an alternative energy source <strong>in</strong> the RFP and FVB often<br />
receives questions about its applicability to new DES. Some explanation is given of the<br />
potential application of geothermal systems to the DES envisioned <strong>in</strong> the Pearson Area.<br />
It will help to start by mak<strong>in</strong>g some dist<strong>in</strong>ctions among several different types of geothermal<br />
technology.<br />
The availability of pure geothermal energy directly useful for heat or power is conf<strong>in</strong>ed to certa<strong>in</strong><br />
geological regions such as the so-called “R<strong>in</strong>g of Fire” around the Pacific Ocean (Chile, Peru,<br />
Ecuador, Columbia, Central America, Mexico, California and Alaska, Russia, Japan, Philipp<strong>in</strong>e,<br />
New Gu<strong>in</strong>ea and New Zealand) and Iceland. When the term geothermal is used for application<br />
<strong>in</strong> Ontario it refers to energy extracted from the ground us<strong>in</strong>g heat pumps; these have also been<br />
called ground source heat pumps.<br />
Heat pumps are the same type of mach<strong>in</strong>e that is used <strong>in</strong> household refrigerators or air<br />
conditioners. The key work<strong>in</strong>g part is a compressor driven by electricity. Specifically, a ground<br />
source heat pump would consume about 1 unit of electricity for every 2 units of heat extracted<br />
from the ground. Therefore their susta<strong>in</strong>ability and greenhouse gas emission benefits are<br />
questionable.<br />
There are several different geothermal heat pump system configurations. One important<br />
dist<strong>in</strong>ction is between open and closed loop systems. In open loop systems ground water is<br />
pumped out of one well and usually returned through a second well. This system depends on<br />
be<strong>in</strong>g able to susta<strong>in</strong> a sufficient flow of ground water typically based on a suitable aquifer<br />
underly<strong>in</strong>g the site. It is generally used on a much smaller scale than required for DE,<br />
commonly for s<strong>in</strong>gle family homes. FVB has been <strong>in</strong>volved <strong>in</strong> some open loop geothermal<br />
district cool<strong>in</strong>g projects <strong>in</strong> Sweden. These were really underground thermal energy storage<br />
projects, one based on a deep lake water source.<br />
In closed loop systems there is heat exchange between the ground and a closed loop. For<br />
farms or s<strong>in</strong>gle family homes surrounded by extensive yards, the loop might be laid horizontally<br />
<strong>in</strong> shallow burial. However, for build<strong>in</strong>gs <strong>in</strong> a densely built-up area the required length of heat<br />
exchanger would be achieved by multiple vertical boreholes with U-tubes <strong>in</strong>serted <strong>in</strong> each<br />
borehole. There is an alternative vertical bore-hole version that uses stand<strong>in</strong>g columns of<br />
water, which should have better heat transfer but the comparative feasibility of any specific type<br />
needs confirmation by experts follow<strong>in</strong>g test drill<strong>in</strong>g to confirm ground conditions.<br />
Unlike open-loop systems where required flow can easily be determ<strong>in</strong>ed based on load, source<br />
temperature, and equipment performance, it is much more difficult to calculate loop length for<br />
closed loop systems. Specifically, it is challeng<strong>in</strong>g to predict the <strong>in</strong>-service capacity and<br />
performance of any given size of geothermal field. It is highly dependent upon soil<br />
characteristics <strong>in</strong>clud<strong>in</strong>g temperature, moisture content, particle size and shape, and heat<br />
transfer coefficients.<br />
Geothermal heat pumps <strong>in</strong> Ontario are typically used to provide both heat<strong>in</strong>g and cool<strong>in</strong>g. Heat<br />
rejected from cool<strong>in</strong>g is stored for use <strong>in</strong> the w<strong>in</strong>ter when the mach<strong>in</strong>es are switched to heat<strong>in</strong>g<br />
119
TRCA Pearson Eco-Bus<strong>in</strong>ess Zone <strong>District</strong> <strong>Energy</strong> <strong>Feasibility</strong> <strong>Study</strong> 10 April 2012<br />
Appendices<br />
. This is sometimes called “geo-exchange”. The ideal operation is to ma<strong>in</strong>ta<strong>in</strong> a longterm<br />
equilibrium whereby the heat taken out <strong>in</strong> w<strong>in</strong>ter is not significantly more than the heat put<br />
<strong>in</strong> dur<strong>in</strong>g the summer. Build<strong>in</strong>gs <strong>in</strong> Ontario need significantly more heat than cool<strong>in</strong>g energy<br />
and higher heat<strong>in</strong>g capacity. Be<strong>in</strong>g capital <strong>in</strong>tensive, the optimal design is to meet the required<br />
cool<strong>in</strong>g capacity which is <strong>in</strong>sufficient to meet the required heat<strong>in</strong>g capacity for the same<br />
build<strong>in</strong>gs. There is also an energy balance issue, i.e. heat energy extracted <strong>in</strong> w<strong>in</strong>ter could<br />
exceed that charged <strong>in</strong> summer, albeit supplemented to a small degree by solar ga<strong>in</strong> and<br />
ascend<strong>in</strong>g heat flux, result<strong>in</strong>g <strong>in</strong> possible long-term cool<strong>in</strong>g of the field with degradation of<br />
heat<strong>in</strong>g capacity.<br />
mode 19<br />
As a capital <strong>in</strong>tensive technology it would make more sense to be designed to meet only the<br />
base load, so the geothermal system would optimally not be the entire energy source (even if<br />
there were no mis-match between heat<strong>in</strong>g and cool<strong>in</strong>g). Furthermore, heat pumps do not<br />
provide a sufficiently high temperature output to satisfy peak demands <strong>in</strong> the severe Canadian<br />
w<strong>in</strong>ter. This system needs to be supplemented with boilers and chillers. To be fair, so does<br />
CHP (though not due to temperature limitations). The question is which is more favourable from<br />
economic and environmental perspectives and this can only be determ<strong>in</strong>ed by a project specific<br />
feasibility study.<br />
In m<strong>in</strong>i-feasibility studies recently performed by FVB it has been found that, us<strong>in</strong>g reasonable<br />
generic assumptions, CHP should have a shorter economic payback than geo-exchange and a<br />
comparative emissions analysis also favours CHP.<br />
There is far more <strong>in</strong>dustry experience with CHP than with geo-exchange and no geo-exchange<br />
experience on the scale that would be large enough to supply a DES for the <strong>Project</strong> <strong>Green</strong> plan.<br />
The largest geo-exchange systems built to date would supply only a fraction of the total floor<br />
area envisioned.<br />
As a local example, FVB is currently work<strong>in</strong>g on a geo-exchange project for a university that will<br />
provide approximately 0.7 MWt of heat<strong>in</strong>g and 0.7 MWt of cool<strong>in</strong>g.<br />
The referenced 0.7 MWt system currently <strong>in</strong> the design phase is envisaged to use 80 boreholes<br />
each 152 metres deep on 6 metre centres. It is very important that the borehole spac<strong>in</strong>g not be<br />
too close. In this case, the field area is approximately 0.2 hectares. This gives a perspective on<br />
the challenge of coord<strong>in</strong>at<strong>in</strong>g land use and easements for a geothermal loop large enough to<br />
serve the Pearson Area.<br />
Geothermal heat<strong>in</strong>g and cool<strong>in</strong>g systems for <strong>in</strong>dividual build<strong>in</strong>gs would be less of a challenge<br />
than for a large DES. However, then those build<strong>in</strong>gs would be locked-<strong>in</strong> to that technology,<br />
based on grid electricity, for the life of the build<strong>in</strong>g. By contrast, one of the key benefits of DE is<br />
that the supply technology, whether geothermal or any other as discussed <strong>in</strong> this section can be<br />
<strong>in</strong>corporated or changed at any time should it prove to be advantageous.<br />
In summary, the potential for geothermal energy is expected to be, at best, a fraction of the<br />
overall thermal energy for a DES <strong>in</strong> the Pearson Area and its economic and environmental<br />
benefit must be subject to critical review <strong>in</strong> a site specific feasibility study.<br />
19 Switch<strong>in</strong>g to heat<strong>in</strong>g mode <strong>in</strong>volves chang<strong>in</strong>g the position of valves such that the flow from the<br />
geothermal field goes through the evaporator of the heat pump and the heat<strong>in</strong>g loop flow goes through<br />
the condenser. Conversely <strong>in</strong> cool<strong>in</strong>g mode, the flow from the geothermal field goes through the<br />
condenser and the cool<strong>in</strong>g loop flow goes through the evaporator.<br />
120
TRCA Pearson Eco-Bus<strong>in</strong>ess Zone <strong>District</strong> <strong>Energy</strong> <strong>Feasibility</strong> <strong>Study</strong> 10 April 2012<br />
Appendices<br />
13.8 Solar Thermal<br />
FVB has <strong>in</strong>vestigated solar thermal possibilities for more than one local client recently and was<br />
<strong>in</strong>volved some years ago as a peer reviewer of the Drakes Land<strong>in</strong>g Solar Community project <strong>in</strong><br />
Okotoks, Alberta. All of these projects have been very small scale, i.e. less than 1 MWt.<br />
From these experiences FVB has concluded that solar thermal cannot be viewed as a large<br />
scale economic thermal energy source <strong>in</strong> Ontario. Although it may seem there is a greenhouse<br />
gas reduction justification this becomes weaker when CHP is <strong>in</strong>corporated. CHP typically<br />
results <strong>in</strong> excess useful heat be<strong>in</strong>g available <strong>in</strong> the summer. It is better to maximize CHP run–<br />
hours, thereby not only produc<strong>in</strong>g heat for zero on-site <strong>in</strong>cremental greenhouse gas emission<br />
impact but also simultaneously displac<strong>in</strong>g grid electricity com<strong>in</strong>g from central coal-fired<br />
generation.<br />
121
TRCA Pearson Eco-Bus<strong>in</strong>ess Zone <strong>District</strong> <strong>Energy</strong> <strong>Feasibility</strong> <strong>Study</strong> 10 April 2012<br />
Appendices<br />
14 Appendix D: GTAA Cogeneration Plant Operations<br />
The CUP has an associated Cogeneration Plant with the capability to extract steam for heat<strong>in</strong>g<br />
purposes. A published case study 20<br />
identifies a high pressure (HP) steam (760 psia) flow of<br />
175,000 lbs/hr, plus a low pressure (LP) steam (179 psia) flow of 11,000 lbs /hr from each of<br />
two Once through Steam Generators. The HP steam is used to drive a steam turb<strong>in</strong>e, from<br />
which steam can be extracted for heat<strong>in</strong>g purposes, whereas the LP steam is used directly for<br />
heat<strong>in</strong>g or to drive steam turb<strong>in</strong>e driven chillers.<br />
The potential steam production from the Cogeneration Plant varies accord<strong>in</strong>g to: (a) whether the<br />
Cogeneration Plant is runn<strong>in</strong>g or not, (b) the po<strong>in</strong>t <strong>in</strong> its startup cycle, (c) outside ambient air<br />
temperature, with greater steam potential <strong>in</strong> w<strong>in</strong>ter when air is denser, (d) the extent to which<br />
duct fir<strong>in</strong>g is be<strong>in</strong>g used, and (e) the particulars of design of the steam turb<strong>in</strong>e, e.g. m<strong>in</strong>imum<br />
flow requirements to cool the downstream blades.<br />
A conservative assumption was made of 40 MWt applied constantly throughout the year for<br />
simplicity. Us<strong>in</strong>g this steam quantity, with a reasonable runn<strong>in</strong>g time assumption (2,586 hours<br />
per year) and a typical annual hourly demand profile applied to the both the airport and the DES<br />
heat loads, and Thermal <strong>Energy</strong> Storage with a design and size similar to that <strong>in</strong>stalled <strong>in</strong> 2009<br />
by Markham <strong>District</strong> <strong>Energy</strong>, it was estimated that 48% of the thermal energy for the DES could<br />
be recovered from CHP. It must be emphasized that there is considerable uncerta<strong>in</strong>ty <strong>in</strong> this<br />
estimate due to the large number of assumptions.<br />
It was further assumed, based on general experience for this type of plant, that extraction of<br />
each MWt would result <strong>in</strong> de-rat<strong>in</strong>g of power generation by 0.25 MWe, from which a variable<br />
cost estimate for steam from the Cogeneration Plant could be derived from the variable price<br />
forecast to be received for electricity. Hence the total average variable cost of production of<br />
steam could be estimated as a weighted average based on the percentage of steam from CHP<br />
and its cost and the balance of steam from boilers and its cost, which would be tied to gas<br />
prices and boiler efficiency.<br />
The GTAA cautioned that the price expected to be received by the Cogeneration Plant for<br />
electricity is very uncerta<strong>in</strong> and might <strong>in</strong>crease considerably <strong>in</strong> future when Locational Marg<strong>in</strong>al<br />
Pric<strong>in</strong>g comes <strong>in</strong>to effect. Moreover, the GTAA advised it would not be prudent to base the<br />
bus<strong>in</strong>ess plan on an assumed supply from the Cogeneration Plant because of both the<br />
uncerta<strong>in</strong> value of electricity <strong>in</strong> future and other uncerta<strong>in</strong>ties impact<strong>in</strong>g the availability of steam.<br />
20 IST – SNC Laval<strong>in</strong> Constructors Inc, Greater Toronto Airports Authority, GTAA Cogeneration Plant<br />
122
TRCA Pearson Eco-Bus<strong>in</strong>ess Zone <strong>District</strong> <strong>Energy</strong> <strong>Feasibility</strong> <strong>Study</strong> 10 April 2012<br />
Appendices<br />
15 Appendix E: Proposed <strong>Energy</strong> Centre Layout<br />
123
TRCA Pearson Eco-Bus<strong>in</strong>ess Zone <strong>District</strong> <strong>Energy</strong> <strong>Feasibility</strong> <strong>Study</strong> 10 April 2012<br />
Appendices<br />
16 Appendix F: Distribution System Route<br />
125
TRCA Pearson Eco-Bus<strong>in</strong>ess Zone <strong>District</strong> <strong>Energy</strong> <strong>Feasibility</strong> <strong>Study</strong> 10 April 2012<br />
Appendices<br />
17 Appendix G: <strong>Energy</strong> Transfer Station Schematic<br />
127
TRCA Pearson Eco-Bus<strong>in</strong>ess Zone <strong>District</strong> <strong>Energy</strong> <strong>Feasibility</strong> <strong>Study</strong> 10 April 2012<br />
Appendices<br />
18 Appendix H: Pro Forma F<strong>in</strong>ancial <strong>Project</strong>ions<br />
129
Pro Forma F<strong>in</strong>ancial Statements <strong>Project</strong> <strong>Green</strong> <strong>District</strong> <strong>Energy</strong> System<br />
(Amounts <strong>in</strong> CAD million) 2012 2013 2014 2015 2016 2017 2018<br />
Operat<strong>in</strong>g Year 1 2 3 4<br />
Pro Forma Income Statement<br />
Revenue<br />
Heat<strong>in</strong>g Revenues -<br />
-<br />
-<br />
0.84<br />
Electricity Revenues -<br />
Total revenue -<br />
-<br />
-<br />
0.84<br />
Operat<strong>in</strong>g Cost<br />
Heat<strong>in</strong>g plant expenditure -<br />
-<br />
-<br />
0.72<br />
1.61<br />
CHP expenditure -<br />
0.88<br />
Development/Corporate Overheads 0.00 0.00 0.00 0.16 0.16<br />
Total expenses 0.00 0.00 0.00 0.88 2.65<br />
EBITDA 0.00 0.00 0.00 (0.04) 1.82<br />
1.85<br />
1.88<br />
EBITDA % of Revenue -5% 41% 40% 40%<br />
Depreciation & Amortisation -<br />
-<br />
-<br />
0.34 0.81<br />
EBIT 0.00 0.00 0.00 (0.37) 1.01<br />
Interest cost 0.00 0.00 0.00 0.00 0.84<br />
EBT 0.00 0.00 0.00 (0.37) 0.17<br />
Taxes -<br />
-<br />
-<br />
-<br />
-<br />
-<br />
-<br />
Net profit 0.00 0.00 0.00 (0.37) 0.17<br />
0.23<br />
0.28<br />
Net profit % Revenue 0.00 0.00 0.00 (0.44) 4% 5% 6%<br />
Dividend - lower of: % of NP 50% -<br />
-<br />
-<br />
-<br />
0.09<br />
% of capital 5%<br />
Reta<strong>in</strong>ed earn<strong>in</strong>gs 0.00 0.00 0.00 (0.37) 0.09<br />
Private & Confidential 1<br />
2.46<br />
2.01<br />
4.47<br />
2.53<br />
2.05<br />
4.58<br />
1.65<br />
0.91<br />
0.17<br />
2.73<br />
0.81<br />
1.04<br />
0.81<br />
0.23<br />
0.11<br />
0.11<br />
2.61<br />
2.08<br />
4.69<br />
1.70<br />
0.93<br />
0.17<br />
2.81<br />
0.81<br />
1.07<br />
0.79<br />
0.28<br />
0.14<br />
0.14
Pro Forma F<strong>in</strong>ancial Statements <strong>Project</strong> <strong>Green</strong> <strong>District</strong> <strong>Energy</strong> System<br />
(Amounts <strong>in</strong> CAD million)<br />
Operat<strong>in</strong>g Year<br />
Pro Forma Income Statement<br />
Revenue<br />
Heat<strong>in</strong>g Revenues<br />
Electricity Revenues<br />
Total revenue<br />
Operat<strong>in</strong>g Cost<br />
Heat<strong>in</strong>g plant expenditure<br />
CHP expenditure<br />
Development/Corporate Overheads<br />
Total expenses<br />
EBITDA<br />
EBITDA % of Revenue<br />
Depreciation & Amortisation<br />
EBIT<br />
Interest cost<br />
EBT<br />
Taxes<br />
Net profit<br />
Net profit % Revenue<br />
Dividend - lower of: % of NP<br />
% of capital<br />
Reta<strong>in</strong>ed earn<strong>in</strong>gs<br />
2019 2020 2021 2022 2023 2024 2025 2026<br />
5 6 7 8 9 10 11 12<br />
2.68<br />
2.11<br />
4.80<br />
1.75<br />
0.96<br />
0.18<br />
2.89<br />
2.76<br />
2.15<br />
4.91<br />
1.79<br />
0.99<br />
0.18<br />
2.97<br />
2.85<br />
2.18<br />
5.03<br />
1.84<br />
1.02<br />
0.19<br />
3.06<br />
2.93<br />
2.22<br />
5.15<br />
1.90<br />
1.05<br />
0.20<br />
3.14<br />
1.91<br />
1.94<br />
1.98<br />
2.01<br />
2.05<br />
2.08<br />
2.12<br />
2.16<br />
40% 40% 39% 39% 39% 39% 38% 38%<br />
0.81<br />
1.10<br />
0.76<br />
0.34<br />
0.81<br />
1.14<br />
0.73<br />
0.40<br />
Private & Confidential 2<br />
0.81<br />
1.17<br />
0.70<br />
0.47<br />
0.81<br />
1.21<br />
0.67<br />
0.53<br />
-<br />
-<br />
-<br />
-<br />
-<br />
-<br />
-<br />
-<br />
0.34<br />
0.40<br />
0.47<br />
0.53<br />
0.60<br />
0.68<br />
0.75<br />
0.83<br />
7% 8% 9% 10% 11% 13% 14% 15%<br />
0.17<br />
0.17<br />
0.20<br />
0.20<br />
0.23<br />
0.23<br />
0.27<br />
0.27<br />
3.02<br />
2.26<br />
5.28<br />
1.95<br />
1.08<br />
0.20<br />
3.23<br />
0.81<br />
1.24<br />
0.64<br />
0.60<br />
0.30<br />
0.30<br />
3.11<br />
2.30<br />
5.41<br />
2.00<br />
1.12<br />
0.21<br />
3.33<br />
0.81<br />
1.28<br />
0.60<br />
0.68<br />
0.34<br />
0.34<br />
3.21<br />
2.34<br />
5.55<br />
2.06<br />
1.15<br />
0.21<br />
3.42<br />
0.81<br />
1.32<br />
0.56<br />
0.75<br />
0.38<br />
0.38<br />
3.30<br />
2.38<br />
5.68<br />
2.12<br />
1.18<br />
0.22<br />
3.52<br />
0.81<br />
1.35<br />
0.52<br />
0.83<br />
0.42<br />
0.42
Pro Forma F<strong>in</strong>ancial Statements <strong>Project</strong> <strong>Green</strong> <strong>District</strong> <strong>Energy</strong> System<br />
(Amounts <strong>in</strong> CAD million)<br />
Operat<strong>in</strong>g Year<br />
Pro Forma Income Statement<br />
Revenue<br />
Heat<strong>in</strong>g Revenues<br />
Electricity Revenues<br />
Total revenue<br />
Operat<strong>in</strong>g Cost<br />
Heat<strong>in</strong>g plant expenditure<br />
CHP expenditure<br />
Development/Corporate Overheads<br />
Total expenses<br />
EBITDA<br />
EBITDA % of Revenue<br />
Depreciation & Amortisation<br />
EBIT<br />
Interest cost<br />
EBT<br />
Taxes<br />
Net profit<br />
Net profit % Revenue<br />
Dividend - lower of: % of NP<br />
% of capital<br />
Reta<strong>in</strong>ed earn<strong>in</strong>gs<br />
2027 2028 2029 2030 2031 2032 2033 2034<br />
13 14 15 16 17 18 19 20<br />
3.40<br />
2.42<br />
5.83<br />
2.18<br />
1.22<br />
0.23<br />
3.62<br />
3.50<br />
2.47<br />
5.97<br />
2.24<br />
1.26<br />
0.23<br />
3.73<br />
3.61<br />
2.51<br />
6.12<br />
2.30<br />
1.29<br />
0.24<br />
3.84<br />
3.72<br />
2.56<br />
6.28<br />
2.37<br />
1.33<br />
0.25<br />
3.95<br />
2.20<br />
2.24<br />
2.29<br />
2.33<br />
2.37<br />
2.42<br />
2.47<br />
2.52<br />
38% 38% 37% 37% 37% 37% 36% 36%<br />
0.81<br />
1.39<br />
0.48<br />
0.91<br />
0.81<br />
1.44<br />
0.44<br />
1.00<br />
Private & Confidential 3<br />
0.81<br />
1.48<br />
0.39<br />
1.09<br />
0.81<br />
1.52<br />
0.34<br />
1.18<br />
-<br />
-<br />
-<br />
-<br />
-<br />
0.20 0.60 0.64<br />
0.91<br />
1.00<br />
1.09<br />
1.18<br />
1.28<br />
1.19<br />
0.90<br />
0.97<br />
16% 17% 18% 19% 20% 18% 13% 14%<br />
0.46<br />
0.46<br />
0.50<br />
0.50<br />
0.55<br />
0.55<br />
0.59<br />
0.60<br />
3.83<br />
2.61<br />
6.44<br />
2.44<br />
1.37<br />
0.26<br />
4.06<br />
0.81<br />
1.57<br />
0.28<br />
1.28<br />
0.59<br />
0.70<br />
3.94<br />
2.66<br />
6.60<br />
2.51<br />
1.41<br />
0.26<br />
4.18<br />
0.81<br />
1.61<br />
0.23<br />
1.39<br />
0.59<br />
0.60<br />
4.06<br />
2.71<br />
6.77<br />
2.58<br />
1.46<br />
0.27<br />
4.30<br />
0.81<br />
1.66<br />
0.17<br />
1.49<br />
0.45<br />
0.45<br />
4.18<br />
2.76<br />
6.95<br />
2.65<br />
1.50<br />
0.28<br />
4.43<br />
0.81<br />
1.71<br />
0.10<br />
1.61<br />
0.48<br />
0.48
Pro Forma F<strong>in</strong>ancial Statements <strong>Project</strong> <strong>Green</strong> <strong>District</strong> <strong>Energy</strong> System<br />
(Amounts <strong>in</strong> CAD million)<br />
Operat<strong>in</strong>g Year<br />
Pro Forma Income Statement<br />
Revenue<br />
Heat<strong>in</strong>g Revenues<br />
Electricity Revenues<br />
Total revenue<br />
Operat<strong>in</strong>g Cost<br />
Heat<strong>in</strong>g plant expenditure<br />
CHP expenditure<br />
Development/Corporate Overheads<br />
Total expenses<br />
EBITDA<br />
EBITDA % of Revenue<br />
Depreciation & Amortisation<br />
EBIT<br />
Interest cost<br />
EBT<br />
Taxes<br />
Net profit<br />
Net profit % Revenue<br />
Dividend - lower of: % of NP<br />
% of capital<br />
Reta<strong>in</strong>ed earn<strong>in</strong>gs<br />
2035 2036 2037 2038 2039<br />
21 22 23 24 25<br />
4.31<br />
2.82<br />
7.13<br />
2.73<br />
1.54<br />
0.29<br />
4.56<br />
4.44<br />
2.82<br />
7.26<br />
2.81<br />
1.54<br />
0.30<br />
4.65<br />
4.57<br />
2.82<br />
7.39<br />
2.89<br />
1.54<br />
0.30<br />
4.74<br />
4.71<br />
2.82<br />
7.53<br />
2.60<br />
1.54<br />
0.31<br />
4.46<br />
4.85<br />
2.82<br />
7.67<br />
2.68<br />
1.54<br />
0.32<br />
4.55<br />
2.57 2.61 2.65 3.06 3.12<br />
36% 36% 36% 41% 41%<br />
0.81<br />
1.76<br />
0.03<br />
1.72<br />
Private & Confidential 4<br />
0.81<br />
1.80<br />
0.00<br />
1.80<br />
0.81<br />
1.84<br />
0.00<br />
1.84<br />
0.81<br />
2.26<br />
0.00<br />
2.26<br />
0.81<br />
2.31<br />
0.00<br />
2.31<br />
0.68 0.72 0.73 0.87 0.89<br />
1.04 1.09 1.11 1.39 1.43<br />
15% 15% 15% 19% 19%<br />
0.52<br />
0.52<br />
0.54<br />
0.54<br />
0.55<br />
0.55<br />
0.59<br />
0.80<br />
0.59<br />
0.84
Pro Forma F<strong>in</strong>ancial Statements <strong>Project</strong> <strong>Green</strong> <strong>District</strong> <strong>Energy</strong> System<br />
(Amounts <strong>in</strong> CAD million) 2012 2013 2014 2015 2016 2017 2018<br />
Operat<strong>in</strong>g Year 1 2 3 4<br />
Pro Forma Balance Sheet<br />
Assets<br />
Cash & cash equivalents -<br />
Receivables -<br />
Operat<strong>in</strong>g cash balances -<br />
Total Current Assets -<br />
Gross Fixed Assets & CWIP 0.15<br />
Less: Accumulated Depreciation -<br />
Total Fixed Assets 0.15<br />
Total Assets 0.15<br />
Liabilities and Equity<br />
Accounts payable -<br />
Current portion of long term debt -<br />
Total Current Liabilities -<br />
Non-Current portion of long term debt -<br />
Non-Current portion of connection fee -<br />
Total Long-Term Liabilities -<br />
Share capital 0.15<br />
Reta<strong>in</strong>ed Earn<strong>in</strong>gs -<br />
Total equity 0.15<br />
Total Liabilities & Equity 0.15<br />
-<br />
-<br />
-<br />
-<br />
0.30<br />
-<br />
0.30<br />
0.30<br />
-<br />
-<br />
-<br />
-<br />
-<br />
-<br />
0.30<br />
-<br />
0.30<br />
Private & Confidential 5<br />
0.30<br />
-<br />
-<br />
-<br />
-<br />
0.45<br />
-<br />
0.45<br />
0.45<br />
-<br />
-<br />
-<br />
-<br />
-<br />
-<br />
0.45<br />
-<br />
0.45<br />
0.45<br />
0.04<br />
0.14<br />
(0.07)<br />
0.11<br />
12.22<br />
(0.34)<br />
11.89<br />
11.99<br />
0.15<br />
-<br />
0.15<br />
-<br />
-<br />
-<br />
12.22<br />
(0.37)<br />
11.85<br />
11.99<br />
0.31<br />
0.75<br />
(0.22)<br />
0.84<br />
28.70<br />
(1.14)<br />
27.55<br />
28.39<br />
0.44<br />
0.49<br />
0.93<br />
16.00<br />
-<br />
16.00<br />
11.75<br />
(0.29)<br />
11.46<br />
28.39<br />
0.75<br />
0.76<br />
(0.23)<br />
1.28<br />
28.70<br />
(1.95)<br />
26.75<br />
28.03<br />
0.45<br />
0.52<br />
0.97<br />
15.48<br />
-<br />
15.48<br />
11.75<br />
(0.17)<br />
11.58<br />
28.03<br />
1.18<br />
0.78<br />
(0.23)<br />
1.73<br />
28.70<br />
(2.76)<br />
25.94<br />
27.67<br />
0.47<br />
0.55<br />
1.02<br />
14.93<br />
-<br />
14.93<br />
11.75<br />
(0.03)<br />
11.72<br />
27.67
Pro Forma F<strong>in</strong>ancial Statements <strong>Project</strong> <strong>Green</strong> <strong>District</strong> <strong>Energy</strong> System<br />
(Amounts <strong>in</strong> CAD million)<br />
Operat<strong>in</strong>g Year<br />
Pro Forma Balance Sheet<br />
Assets<br />
Cash & cash equivalents<br />
Receivables<br />
Operat<strong>in</strong>g cash balances<br />
Total Current Assets<br />
Gross Fixed Assets & CWIP<br />
Less: Accumulated Depreciation<br />
Total Fixed Assets<br />
Total Assets<br />
Liabilities and Equity<br />
Accounts payable<br />
Current portion of long term debt<br />
Total Current Liabilities<br />
Non-Current portion of long term debt<br />
Non-Current portion of connection fee<br />
Total Long-Term Liabilities<br />
Share capital<br />
Reta<strong>in</strong>ed Earn<strong>in</strong>gs<br />
Total equity<br />
Total Liabilities & Equity<br />
2019 2020 2021 2022 2023 2024 2025 2026<br />
5 6 7 8 9 10 11 12<br />
1.61<br />
0.80<br />
(0.24)<br />
2.17<br />
28.70<br />
(3.56)<br />
25.13<br />
27.30<br />
0.48<br />
0.58<br />
1.06<br />
14.35<br />
-<br />
14.35<br />
11.75<br />
0.14<br />
11.89<br />
27.30<br />
2.04<br />
0.82<br />
(0.25)<br />
2.61<br />
28.70<br />
(4.37)<br />
24.33<br />
26.94<br />
0.49<br />
0.62<br />
1.11<br />
13.73<br />
-<br />
13.73<br />
11.75<br />
0.34<br />
12.09<br />
26.94<br />
Private & Confidential 6<br />
2.47<br />
0.84<br />
(0.25)<br />
3.05<br />
28.70<br />
(5.18)<br />
23.52<br />
26.57<br />
0.51<br />
0.65<br />
1.16<br />
13.08<br />
-<br />
13.08<br />
11.75<br />
0.58<br />
12.32<br />
26.57<br />
2.89<br />
0.86<br />
(0.26)<br />
3.49<br />
28.70<br />
(5.99)<br />
22.71<br />
26.20<br />
0.52<br />
0.69<br />
1.22<br />
12.39<br />
-<br />
12.39<br />
11.75<br />
0.84<br />
12.59<br />
26.20<br />
3.31<br />
0.88<br />
(0.27)<br />
3.92<br />
28.70<br />
(6.79)<br />
21.90<br />
25.82<br />
0.54<br />
0.73<br />
1.27<br />
11.65<br />
-<br />
11.65<br />
11.75<br />
1.15<br />
12.89<br />
25.82<br />
3.72<br />
0.90<br />
(0.28)<br />
4.34<br />
28.70<br />
(7.60)<br />
21.10<br />
25.44<br />
0.55<br />
0.78<br />
1.33<br />
10.88<br />
-<br />
10.88<br />
11.75<br />
1.48<br />
13.23<br />
25.44<br />
4.13<br />
0.92<br />
(0.29)<br />
4.76<br />
28.70<br />
(8.41)<br />
20.29<br />
25.05<br />
0.57<br />
0.83<br />
1.40<br />
10.05<br />
-<br />
10.05<br />
11.75<br />
1.86<br />
13.61<br />
25.05<br />
4.52<br />
0.95<br />
(0.29)<br />
5.18<br />
28.70<br />
(9.21)<br />
19.48<br />
24.66<br />
0.59<br />
0.87<br />
1.46<br />
9.18<br />
-<br />
9.18<br />
11.75<br />
2.28<br />
14.02<br />
24.66
Pro Forma F<strong>in</strong>ancial Statements <strong>Project</strong> <strong>Green</strong> <strong>District</strong> <strong>Energy</strong> System<br />
(Amounts <strong>in</strong> CAD million)<br />
Operat<strong>in</strong>g Year<br />
Pro Forma Balance Sheet<br />
Assets<br />
Cash & cash equivalents<br />
Receivables<br />
Operat<strong>in</strong>g cash balances<br />
Total Current Assets<br />
Gross Fixed Assets & CWIP<br />
Less: Accumulated Depreciation<br />
Total Fixed Assets<br />
Total Assets<br />
Liabilities and Equity<br />
Accounts payable<br />
Current portion of long term debt<br />
Total Current Liabilities<br />
Non-Current portion of long term debt<br />
Non-Current portion of connection fee<br />
Total Long-Term Liabilities<br />
Share capital<br />
Reta<strong>in</strong>ed Earn<strong>in</strong>gs<br />
Total equity<br />
Total Liabilities & Equity<br />
2027 2028 2029 2030 2031 2032 2033 2034<br />
13 14 15 16 17 18 19 20<br />
4.92<br />
0.97<br />
(0.30)<br />
5.59<br />
28.70<br />
(10.02)<br />
18.68<br />
24.26<br />
0.60<br />
0.93<br />
1.53<br />
8.25<br />
-<br />
8.25<br />
11.75<br />
2.73<br />
14.48<br />
24.26<br />
5.30<br />
1.00<br />
(0.31)<br />
5.98<br />
28.70<br />
(10.83)<br />
17.87<br />
23.85<br />
0.62<br />
0.98<br />
1.60<br />
7.27<br />
-<br />
7.27<br />
11.75<br />
3.23<br />
14.98<br />
23.85<br />
Private & Confidential 7<br />
5.67<br />
1.02<br />
(0.32)<br />
6.37<br />
28.70<br />
(11.64)<br />
17.06<br />
23.43<br />
0.64<br />
1.04<br />
1.68<br />
6.22<br />
-<br />
6.22<br />
11.75<br />
3.78<br />
15.53<br />
23.43<br />
6.03<br />
1.05<br />
(0.33)<br />
6.75<br />
28.70<br />
(12.44)<br />
16.26<br />
23.01<br />
0.66<br />
1.10<br />
1.76<br />
5.12<br />
-<br />
5.12<br />
11.75<br />
4.37<br />
16.12<br />
23.01<br />
6.43<br />
1.07<br />
(0.34)<br />
7.17<br />
28.70<br />
(13.25)<br />
15.45<br />
22.62<br />
0.68<br />
1.17<br />
1.85<br />
3.95<br />
-<br />
3.95<br />
11.75<br />
5.07<br />
16.82<br />
22.62<br />
6.68<br />
1.10<br />
(0.35)<br />
7.43<br />
28.70<br />
(14.06)<br />
14.64<br />
22.07<br />
0.70<br />
1.24<br />
1.94<br />
2.71<br />
-<br />
2.71<br />
11.75<br />
5.67<br />
17.42<br />
22.07<br />
6.69<br />
1.13<br />
(0.36)<br />
7.46<br />
28.70<br />
(14.86)<br />
13.83<br />
21.30<br />
0.72<br />
1.32<br />
2.03<br />
1.39<br />
-<br />
1.39<br />
11.75<br />
6.12<br />
17.87<br />
21.30<br />
6.67<br />
1.16<br />
(0.37)<br />
7.46<br />
28.70<br />
(15.67)<br />
13.03<br />
20.49<br />
0.74<br />
1.39<br />
2.13<br />
0.00<br />
-<br />
0.00<br />
11.75<br />
6.60<br />
18.35<br />
20.49
Pro Forma F<strong>in</strong>ancial Statements <strong>Project</strong> <strong>Green</strong> <strong>District</strong> <strong>Energy</strong> System<br />
(Amounts <strong>in</strong> CAD million)<br />
Operat<strong>in</strong>g Year<br />
Pro Forma Balance Sheet<br />
Assets<br />
Cash & cash equivalents<br />
Receivables<br />
Operat<strong>in</strong>g cash balances<br />
Total Current Assets<br />
Gross Fixed Assets & CWIP<br />
Less: Accumulated Depreciation<br />
Total Fixed Assets<br />
Total Assets<br />
Liabilities and Equity<br />
Accounts payable<br />
Current portion of long term debt<br />
Total Current Liabilities<br />
Non-Current portion of long term debt<br />
Non-Current portion of connection fee<br />
Total Long-Term Liabilities<br />
Share capital<br />
Reta<strong>in</strong>ed Earn<strong>in</strong>gs<br />
Total equity<br />
Total Liabilities & Equity<br />
2035 2036 2037 2038 2039<br />
21 22 23 24 25<br />
6.61<br />
1.19<br />
(0.38)<br />
7.41<br />
28.70<br />
(16.48)<br />
12.22<br />
19.63<br />
0.76<br />
-<br />
0.76<br />
0.00<br />
-<br />
0.00<br />
11.75<br />
7.12<br />
18.87<br />
19.63<br />
Private & Confidential 8<br />
7.96<br />
1.21<br />
(0.39)<br />
8.78<br />
28.70<br />
(17.28)<br />
11.41<br />
20.19<br />
0.77<br />
-<br />
0.77<br />
0.00<br />
-<br />
0.00<br />
11.75<br />
7.67<br />
19.42<br />
20.19<br />
9.32<br />
1.23<br />
(0.39)<br />
10.15<br />
28.70<br />
(18.09)<br />
10.61<br />
20.76<br />
0.79<br />
-<br />
0.79<br />
0.00<br />
-<br />
0.00<br />
11.75<br />
8.22<br />
19.97<br />
20.76<br />
10.84<br />
1.25<br />
(0.37)<br />
11.72<br />
28.70<br />
(18.90)<br />
9.80<br />
21.52<br />
0.74<br />
-<br />
0.74<br />
0.00<br />
-<br />
0.00<br />
11.75<br />
9.03<br />
20.78<br />
21.52<br />
12.48<br />
1.28<br />
(0.38)<br />
13.38<br />
28.70<br />
(19.71)<br />
8.99<br />
22.37<br />
0.76<br />
-<br />
0.76<br />
0.00<br />
-<br />
0.00<br />
11.75<br />
9.87<br />
21.61<br />
22.37
Pro Forma F<strong>in</strong>ancial Statements <strong>Project</strong> <strong>Green</strong> <strong>District</strong> <strong>Energy</strong> System<br />
(Amounts <strong>in</strong> CAD million) 2012 2013 2014 2015 2016 2017 2018<br />
Operat<strong>in</strong>g Year 1 2 3 4<br />
Pro Forma Cash Flow Statement<br />
Cash flows from operations<br />
Net Income -<br />
Add: Depreciation & amortization -<br />
(Increase)/Decrease <strong>in</strong> work<strong>in</strong>g capital -<br />
Cash flows from operations -<br />
Cash flows from <strong>in</strong>vestments<br />
(Purchase)/Sale of <strong>in</strong>vestments (0.15)<br />
Cash flows from <strong>in</strong>vestments (0.15)<br />
Cash flows from f<strong>in</strong>anc<strong>in</strong>g<br />
-<br />
-<br />
-<br />
-<br />
(0.15)<br />
(0.15)<br />
Increase <strong>in</strong> equity<br />
Increase <strong>in</strong> shareholder loans<br />
(Repayment) of shareholder loans<br />
0.15<br />
0.15<br />
Draw-down of fund<strong>in</strong>g -<br />
Draw-down of bank debt -<br />
-<br />
(Repayment) of bank debt -<br />
-<br />
(Payment) of dividends -<br />
-<br />
Cash flows from f<strong>in</strong>anc<strong>in</strong>g 0.15<br />
0.15<br />
Net Increase /(decrease) <strong>in</strong> cash -<br />
Open<strong>in</strong>g cash balance -<br />
Clos<strong>in</strong>g cash balance -<br />
Private & Confidential 9<br />
-<br />
-<br />
-<br />
-<br />
-<br />
-<br />
-<br />
(0.15)<br />
(0.15)<br />
0.15<br />
-<br />
-<br />
-<br />
-<br />
0.15<br />
-<br />
-<br />
-<br />
(0.37)<br />
0.34<br />
0.08<br />
0.04<br />
(11.77)<br />
(11.77)<br />
11.77<br />
-<br />
-<br />
-<br />
-<br />
11.77<br />
0.04<br />
-<br />
0.04<br />
0.17<br />
0.81<br />
(0.16)<br />
0.82<br />
(16.48)<br />
(16.48)<br />
(0.47)<br />
-<br />
16.95<br />
(0.46)<br />
(0.09)<br />
15.93<br />
0.27<br />
0.04<br />
0.31<br />
0.23<br />
0.81<br />
0.00<br />
1.04<br />
-<br />
-<br />
-<br />
-<br />
-<br />
(0.49)<br />
(0.11)<br />
(0.60)<br />
0.43<br />
0.31<br />
0.75<br />
0.28<br />
0.81<br />
0.00<br />
1.09<br />
-<br />
-<br />
-<br />
-<br />
-<br />
(0.52)<br />
(0.14)<br />
(0.66)<br />
0.43<br />
0.75<br />
1.18
Pro Forma F<strong>in</strong>ancial Statements <strong>Project</strong> <strong>Green</strong> <strong>District</strong> <strong>Energy</strong> System<br />
(Amounts <strong>in</strong> CAD million)<br />
Operat<strong>in</strong>g Year<br />
Pro Forma Cash Flow Statement<br />
Cash flows from operations<br />
Net Income<br />
Add: Depreciation & amortization<br />
(Increase)/Decrease <strong>in</strong> work<strong>in</strong>g capital<br />
Cash flows from operations<br />
Cash flows from <strong>in</strong>vestments<br />
(Purchase)/Sale of <strong>in</strong>vestments<br />
Cash flows from <strong>in</strong>vestments<br />
Cash flows from f<strong>in</strong>anc<strong>in</strong>g<br />
Increase <strong>in</strong> equity<br />
Increase <strong>in</strong> shareholder loans<br />
(Repayment) of shareholder loans<br />
Draw-down of fund<strong>in</strong>g<br />
Draw-down of bank debt<br />
(Repayment) of bank debt<br />
(Payment) of dividends<br />
Cash flows from f<strong>in</strong>anc<strong>in</strong>g<br />
Net Increase /(decrease) <strong>in</strong> cash<br />
Open<strong>in</strong>g cash balance<br />
Clos<strong>in</strong>g cash balance<br />
2019 2020 2021 2022 2023 2024 2025 2026<br />
5 6 7 8 9 10 11 12<br />
0.34<br />
0.81<br />
0.00<br />
1.15<br />
-<br />
-<br />
-<br />
-<br />
-<br />
(0.55)<br />
(0.17)<br />
(0.72)<br />
0.43<br />
1.18<br />
1.61<br />
0.40<br />
0.81<br />
0.00<br />
1.21<br />
-<br />
-<br />
-<br />
-<br />
-<br />
(0.58)<br />
(0.20)<br />
(0.78)<br />
0.43<br />
1.61<br />
2.04<br />
Private & Confidential 10<br />
0.47<br />
0.81<br />
0.00<br />
1.28<br />
-<br />
-<br />
-<br />
-<br />
-<br />
(0.62)<br />
(0.23)<br />
(0.85)<br />
0.43<br />
2.04<br />
2.47<br />
0.53<br />
0.81<br />
0.00<br />
1.34<br />
-<br />
-<br />
-<br />
-<br />
-<br />
(0.65)<br />
(0.27)<br />
(0.92)<br />
0.42<br />
2.47<br />
2.89<br />
0.60<br />
0.81<br />
0.00<br />
1.41<br />
-<br />
-<br />
-<br />
-<br />
-<br />
(0.69)<br />
(0.30)<br />
(0.99)<br />
0.42<br />
2.89<br />
3.31<br />
0.68<br />
0.81<br />
0.00<br />
1.49<br />
-<br />
-<br />
-<br />
-<br />
-<br />
(0.73)<br />
(0.34)<br />
(1.07)<br />
0.41<br />
3.31<br />
3.72<br />
0.75<br />
0.81<br />
0.00<br />
1.56<br />
-<br />
-<br />
-<br />
-<br />
-<br />
(0.78)<br />
(0.38)<br />
(1.15)<br />
0.41<br />
3.72<br />
4.13<br />
0.83<br />
0.81<br />
0.00<br />
1.64<br />
-<br />
-<br />
-<br />
-<br />
-<br />
(0.83)<br />
(0.42)<br />
(1.24)<br />
0.40<br />
4.13<br />
4.52
Pro Forma F<strong>in</strong>ancial Statements <strong>Project</strong> <strong>Green</strong> <strong>District</strong> <strong>Energy</strong> System<br />
(Amounts <strong>in</strong> CAD million)<br />
Operat<strong>in</strong>g Year<br />
Pro Forma Cash Flow Statement<br />
Cash flows from operations<br />
Net Income<br />
Add: Depreciation & amortization<br />
(Increase)/Decrease <strong>in</strong> work<strong>in</strong>g capital<br />
Cash flows from operations<br />
Cash flows from <strong>in</strong>vestments<br />
(Purchase)/Sale of <strong>in</strong>vestments<br />
Cash flows from <strong>in</strong>vestments<br />
Cash flows from f<strong>in</strong>anc<strong>in</strong>g<br />
Increase <strong>in</strong> equity<br />
Increase <strong>in</strong> shareholder loans<br />
(Repayment) of shareholder loans<br />
Draw-down of fund<strong>in</strong>g<br />
Draw-down of bank debt<br />
(Repayment) of bank debt<br />
(Payment) of dividends<br />
Cash flows from f<strong>in</strong>anc<strong>in</strong>g<br />
Net Increase /(decrease) <strong>in</strong> cash<br />
Open<strong>in</strong>g cash balance<br />
Clos<strong>in</strong>g cash balance<br />
2027 2028 2029 2030 2031 2032 2033 2034<br />
13 14 15 16 17 18 19 20<br />
0.91<br />
0.81<br />
0.00<br />
1.72<br />
-<br />
-<br />
-<br />
-<br />
-<br />
(0.87)<br />
(0.46)<br />
(1.33)<br />
0.39<br />
4.52<br />
4.92<br />
1.00<br />
0.81<br />
0.00<br />
1.81<br />
-<br />
-<br />
-<br />
-<br />
-<br />
(0.93)<br />
(0.50)<br />
(1.43)<br />
0.38<br />
4.92<br />
5.30<br />
Private & Confidential 11<br />
1.09<br />
0.81<br />
0.00<br />
1.90<br />
-<br />
-<br />
-<br />
-<br />
-<br />
(0.98)<br />
(0.55)<br />
(1.53)<br />
0.37<br />
5.30<br />
5.67<br />
1.18<br />
0.81<br />
0.00<br />
1.99<br />
-<br />
-<br />
-<br />
-<br />
-<br />
(1.04)<br />
(0.59)<br />
(1.63)<br />
0.36<br />
5.67<br />
6.03<br />
1.28<br />
0.81<br />
0.00<br />
2.09<br />
-<br />
-<br />
-<br />
-<br />
-<br />
(1.10)<br />
(0.59)<br />
(1.69)<br />
0.40<br />
6.03<br />
6.43<br />
1.19<br />
0.81<br />
0.00<br />
2.00<br />
-<br />
-<br />
-<br />
-<br />
-<br />
(1.17)<br />
(0.59)<br />
(1.76)<br />
0.24<br />
6.43<br />
6.68<br />
0.90<br />
0.81<br />
0.00<br />
1.71<br />
-<br />
-<br />
-<br />
-<br />
-<br />
(1.24)<br />
(0.45)<br />
(1.69)<br />
0.02<br />
6.68<br />
6.69<br />
0.97<br />
0.81<br />
0.00<br />
1.78<br />
-<br />
-<br />
-<br />
-<br />
-<br />
(1.32)<br />
(0.48)<br />
(1.80)<br />
(0.02)<br />
6.69<br />
6.67
Pro Forma F<strong>in</strong>ancial Statements <strong>Project</strong> <strong>Green</strong> <strong>District</strong> <strong>Energy</strong> System<br />
(Amounts <strong>in</strong> CAD million)<br />
Operat<strong>in</strong>g Year<br />
Pro Forma Cash Flow Statement<br />
Cash flows from operations<br />
Net Income<br />
Add: Depreciation & amortization<br />
(Increase)/Decrease <strong>in</strong> work<strong>in</strong>g capital<br />
Cash flows from operations<br />
Cash flows from <strong>in</strong>vestments<br />
(Purchase)/Sale of <strong>in</strong>vestments<br />
Cash flows from <strong>in</strong>vestments<br />
Cash flows from f<strong>in</strong>anc<strong>in</strong>g<br />
Increase <strong>in</strong> equity<br />
Increase <strong>in</strong> shareholder loans<br />
(Repayment) of shareholder loans<br />
Draw-down of fund<strong>in</strong>g<br />
Draw-down of bank debt<br />
(Repayment) of bank debt<br />
(Payment) of dividends<br />
Cash flows from f<strong>in</strong>anc<strong>in</strong>g<br />
Net Increase /(decrease) <strong>in</strong> cash<br />
Open<strong>in</strong>g cash balance<br />
Clos<strong>in</strong>g cash balance<br />
2035 2036 2037 2038 2039<br />
21 22 23 24 25<br />
1.04<br />
0.81<br />
0.00<br />
1.85<br />
-<br />
-<br />
-<br />
-<br />
-<br />
(1.39)<br />
(0.52)<br />
(1.91)<br />
(0.06)<br />
6.67<br />
6.61<br />
Private & Confidential 12<br />
1.09<br />
0.81<br />
0.00<br />
1.89<br />
-<br />
-<br />
-<br />
-<br />
-<br />
-<br />
(0.54)<br />
(0.54)<br />
1.35<br />
6.61<br />
7.96<br />
1.11<br />
0.81<br />
0.00<br />
1.92<br />
-<br />
-<br />
-<br />
-<br />
-<br />
-<br />
(0.55)<br />
(0.55)<br />
1.36<br />
7.96<br />
9.32<br />
1.39<br />
0.81<br />
(0.09)<br />
2.11<br />
-<br />
-<br />
-<br />
-<br />
-<br />
-<br />
(0.59)<br />
(0.59)<br />
1.52<br />
9.32<br />
10.84<br />
1.43<br />
0.81<br />
(0.00)<br />
2.23<br />
-<br />
-<br />
-<br />
-<br />
-<br />
-<br />
(0.59)<br />
(0.59)<br />
1.64<br />
10.84<br />
12.48
TRCA Pearson Eco-Bus<strong>in</strong>ess Zone <strong>District</strong> <strong>Energy</strong> <strong>Feasibility</strong> <strong>Study</strong> 10 April 2012<br />
Appendices<br />
19 Appendix I: Detailed Cost<strong>in</strong>g for Distribution Pipe System and<br />
<strong>Energy</strong> Transfer Stations<br />
142
<strong>Project</strong>: Pearson Eco Bus<strong>in</strong>ess Zone<br />
<strong>Project</strong> #: 210252<br />
Location: Ontario<br />
Client: <strong>Partners</strong> <strong>in</strong> <strong>Project</strong> <strong>Green</strong><br />
Date: September 22, 2011<br />
Revision #: 1<br />
Prepared by: S.Yee<br />
Reviewed by:<br />
Model #: 43<br />
Data Source: Means 2011 Q1, LOGSTOR Material Pric<strong>in</strong>g from Feb 2011, FVB Database<br />
Description:<br />
Cool<strong>in</strong>g Heat<strong>in</strong>g<br />
All Phases:<br />
Distribution Pip<strong>in</strong>g<br />
($) ($)<br />
Mechanical - Material & Installation 6,950 m $9,551,000 $5,653,000<br />
Civil - Excavation, Backfill & Re<strong>in</strong>statement 6,950 m $5,323,000 $4,992,000<br />
DPS Subtotal $14,874,000 $10,645,000<br />
Construction Soft Costs<br />
Contractor Adm<strong>in</strong>., Bond<strong>in</strong>g, Insurance & OH&P 15.0% $2,231,000 $1,597,000<br />
Construction Management & Supervision 3.0% $521,000 $377,000<br />
Construction Change Allowance 2.0% $298,000 $213,000<br />
Prov<strong>in</strong>cial Sales Tax 0.0% $0 $0<br />
Goods & Services Tax 0.0% $0 $0<br />
Harmonized Sales Tax 13.0% $1,935,000 $1,384,000<br />
Construction Soft Costs Subtotal<br />
Owner's Soft Costs<br />
$4,985,000 $3,571,000<br />
Eng<strong>in</strong>eer<strong>in</strong>g (Design & Construction Support) 8.0% $1,589,000 $1,138,000<br />
Cont<strong>in</strong>gency (Design & Pric<strong>in</strong>g) 10.0% $1,985,000 $1,420,000<br />
Owner's Soft Costs Subtotal $3,574,000 $2,558,000<br />
DPS Total $23,433,000 $16,774,000<br />
Notes:<br />
1) Shor<strong>in</strong>g trench box allowance <strong>in</strong>cluded for trenches deeper than 1.2 m.<br />
2) Trench depth allows for 1200 mm cover to top of pipe.<br />
3) Cost per meter <strong>in</strong>cludes material supply, mechanical <strong>in</strong>stallation and all civil works. No allowance for offsite<br />
haulage/U-fill backfill.<br />
4) Price <strong>in</strong>cludes for supply and return l<strong>in</strong>es.<br />
5) Mechanical and civil costs <strong>in</strong>clude allowance for mobilization, specialist subcontractors, bond<strong>in</strong>g and <strong>in</strong>surance.<br />
6) Cost does not <strong>in</strong>clude soil remediation or costs related to obta<strong>in</strong><strong>in</strong>g right-of-ways/easements etc.<br />
7) Estimate provided is prelim<strong>in</strong>ary and based on FVB draw<strong>in</strong>gs.<br />
CONFIDENTIAL<br />
1 of 3 22/09/2011 at 5:00 PM
Cool<strong>in</strong>g Heat<strong>in</strong>g<br />
Phase 1A: ($) ($)<br />
Distribution Pip<strong>in</strong>g<br />
Mechanical - Material & Installation 1,950 m $3,248,000 $1,740,000<br />
Civil - Excavation, Backfill & Re<strong>in</strong>statement 1,950 m $1,596,000 $1,451,000<br />
DPS Subtotal $4,844,000 $3,191,000<br />
Construction Soft Costs<br />
Contractor Adm<strong>in</strong>., Bond<strong>in</strong>g, Insurance & OH&P 15.0% $727,000 $479,000<br />
Construction Management & Supervision 3.0% $145,000 $96,000<br />
Construction Change Allowance 2.0% $97,000 $64,000<br />
Prov<strong>in</strong>cial Sales Tax 0.0% $0 $0<br />
Goods & Services Tax 0.0% $0 $0<br />
Harmonized Sales Tax 13.0% $630,000 $415,000<br />
Construction Soft Costs Subtotal $1,599,000 $1,054,000<br />
Owner's Soft Costs<br />
Eng<strong>in</strong>eer<strong>in</strong>g (Design & Construction Support) 8.0% $515,000 $340,000<br />
Cont<strong>in</strong>gency (Design & Pric<strong>in</strong>g) 10.0% $644,000 $424,000<br />
Owner's Soft Costs Subtotal $1,159,000 $764,000<br />
Phase 1 DPS Total $7,602,000 $5,009,000<br />
Phase 1 DPS Total w/o taxes $6,972,000 $4,594,000<br />
Cool<strong>in</strong>g Heat<strong>in</strong>g<br />
Phase 1: ($) ($)<br />
Distribution Pip<strong>in</strong>g<br />
Mechanical - Material & Installation 1,240 m $1,600,000 $922,000<br />
Civil - Excavation, Backfill & Re<strong>in</strong>statement 1,240 m $906,000 $841,000<br />
DPS Subtotal $2,506,000 $1,763,000<br />
Construction Soft Costs<br />
Contractor Adm<strong>in</strong>., Bond<strong>in</strong>g, Insurance & OH&P 15.0% $376,000 $264,000<br />
Construction Management & Supervision 3.0% $75,000 $53,000<br />
Construction Change Allowance 2.0% $50,000 $35,000<br />
Prov<strong>in</strong>cial Sales Tax 0.0% $0 $0<br />
Goods & Services Tax 0.0% $0 $0<br />
Harmonized Sales Tax 13.0% $326,000 $229,000<br />
Construction Soft Costs Subtotal $827,000 $581,000<br />
Owner's Soft Costs<br />
Eng<strong>in</strong>eer<strong>in</strong>g (Design & Construction Support) 8.0% $267,000 $188,000<br />
Cont<strong>in</strong>gency (Design & Pric<strong>in</strong>g) 10.0% $333,000 $234,000<br />
Owner's Soft Costs Subtotal $600,000 $422,000<br />
Phase 2 DPS Total $3,933,000 $2,766,000<br />
Phase 2 DPS Total w/o taxes $3,607,000 $2,537,000<br />
CONFIDENTIAL<br />
2 of 3 22/09/2011 at 5:00 PM
Cool<strong>in</strong>g Heat<strong>in</strong>g<br />
Phase 2: ($) ($)<br />
Distribution Pip<strong>in</strong>g<br />
Mechanical - Material & Installation 1,650 m $2,566,000 $1,548,000<br />
Civil - Excavation, Backfill & Re<strong>in</strong>statement 1,650 m $1,376,000 $1,298,000<br />
DPS Subtotal $3,942,000 $2,846,000<br />
Construction Soft Costs<br />
Contractor Adm<strong>in</strong>., Bond<strong>in</strong>g, Insurance & OH&P 15.0% $591,000 $427,000<br />
Construction Management & Supervision 4.0% $158,000 $114,000<br />
Construction Change Allowance 2.0% $79,000 $57,000<br />
Prov<strong>in</strong>cial Sales Tax 0.0% $0 $0<br />
Goods & Services Tax 0.0% $0 $0<br />
Harmonized Sales Tax 13.0% $513,000 $370,000<br />
Construction Soft Costs Subtotal $1,341,000 $968,000<br />
Owner's Soft Costs<br />
Eng<strong>in</strong>eer<strong>in</strong>g (Design & Construction Support) 8.0% $423,000 $305,000<br />
Cont<strong>in</strong>gency (Design & Pric<strong>in</strong>g) 10.0% $528,000 $381,000<br />
Owner's Soft Costs Subtotal $951,000 $686,000<br />
Phase 3 DPS Total $6,234,000 $4,500,000<br />
Phase 3 DPS Total w/o taxes $5,721,000 $4,130,000<br />
Cool<strong>in</strong>g Heat<strong>in</strong>g<br />
Phase 3: ($) ($)<br />
Distribution Pip<strong>in</strong>g<br />
Mechanical - Material & Installation 2,110 m $2,137,000 $1,443,000<br />
Civil - Excavation, Backfill & Re<strong>in</strong>statement 2,110 m $1,445,000 $1,402,000<br />
DPS Subtotal $3,582,000 $2,845,000<br />
Construction Soft Costs<br />
Contractor Adm<strong>in</strong>., Bond<strong>in</strong>g, Insurance & OH&P 15.0% $537,000 $427,000<br />
Construction Management & Supervision 4.0% $143,000 $114,000<br />
Construction Change Allowance 2.0% $72,000 $57,000<br />
Prov<strong>in</strong>cial Sales Tax 0.0% $0 $0<br />
Goods & Services Tax 0.0% $0 $0<br />
Harmonized Sales Tax 13.0% $466,000 $370,000<br />
Construction Soft Costs Subtotal $1,218,000 $968,000<br />
Owner's Soft Costs<br />
Eng<strong>in</strong>eer<strong>in</strong>g (Design & Construction Support) 8.0% $384,000 $305,000<br />
Cont<strong>in</strong>gency (Design & Pric<strong>in</strong>g) 10.0% $480,000 $381,000<br />
Owner's Soft Costs Subtotal $864,000 $686,000<br />
Phase 4 DPS Total $5,664,000 $4,499,000<br />
Phase 4 DPS Total w/o taxes $5,198,000 $4,129,000<br />
CONFIDENTIAL<br />
3 of 3 22/09/2011 at 5:00 PM
<strong>Project</strong>: Pearson Eco Bus<strong>in</strong>ess Zone<br />
<strong>Project</strong> #: 210252<br />
Location: Ontario<br />
Client: <strong>Partners</strong> <strong>in</strong> <strong>Project</strong> <strong>Green</strong><br />
Date: 2011-Sep-20<br />
Revision #: 2<br />
Prepared by: S.Yee<br />
Reviewed by:<br />
Model #: 6<br />
Data Source: FVB Database<br />
Description:<br />
Pearson Eco Bus<strong>in</strong>ess Zone - Total ETS Cost Estimate Cool<strong>in</strong>g Heat<strong>in</strong>g<br />
All Phases ($) ($)<br />
22300 kW of Heat<strong>in</strong>g and 6200 Tons of Cool<strong>in</strong>g (23 Heat<strong>in</strong>g & 23 Cool<strong>in</strong>g ETS's)<br />
Owner Supplied<br />
Heat Exchangers $682,500 $363,600<br />
Isolation Valves $0 $69,200<br />
Controls & Meter<strong>in</strong>g $545,100 $517,700<br />
Additional Primary & Secondary Modifications<br />
NOT INCLUDED<br />
Owner Supplied Subtotal $1,227,600 $950,500<br />
Contractor Supplied<br />
Mechanical & Electrical Material and Installation $2,466,500 $1,894,800<br />
Contractor Supplied Subtotal $2,466,500 $1,894,800<br />
Construction Soft Costs<br />
General Contractor Overhead and Profit Included Included<br />
Construction Management and Supervision 4% $147,800 $113,800<br />
Prov<strong>in</strong>cial Sales Tax 0% $0 $0<br />
Goods & Services Tax 0% $0 $0<br />
Harmonized Sales Tax 13% $480,200 $369,900<br />
Subtotal Construction $628,000 $483,700<br />
Owner's Soft Costs<br />
Eng<strong>in</strong>eer<strong>in</strong>g (Design, Construction and Commission<strong>in</strong>g Support) 15% $648,300 $499,400<br />
Cont<strong>in</strong>gency 10% $432,200 $332,900<br />
Subtotal Owner's Soft Costs $1,080,500 $832,300<br />
Total ETS Cost (w/o Taxes) $4,922,400 $3,791,400<br />
Total ETS Cost (w/ Taxes) $5,402,600 $4,161,300<br />
Pearson Eco Bus<strong>in</strong>ess Zone - ETS Cost Estimate Cool<strong>in</strong>g Heat<strong>in</strong>g<br />
Phase 1 ($) ($)<br />
4800 kW of Heat<strong>in</strong>g and 1830 Tons of Cool<strong>in</strong>g (8 Heat<strong>in</strong>g & 8 Cool<strong>in</strong>g ETS's)<br />
Owner Supplied<br />
Heat Exchangers $219,700 $117,000<br />
Isolation Valves $0 $18,300<br />
Controls & Meter<strong>in</strong>g $165,900 $153,800<br />
Additional Primary & Secondary Pip<strong>in</strong>g Modifications $0 $0<br />
Owner Supplied Subtotal $385,600 $289,100<br />
Contractor Supplied<br />
Mechanical & Electrical Material and Installation $770,200 $519,900<br />
Contractor Supplied Subtotal $770,200 $519,900<br />
Construction Soft Costs<br />
General Contractor Overhead and Profit Included Included<br />
Construction Management and Supervision 4% $46,200 $32,400<br />
Prov<strong>in</strong>cial Sales Tax 0% $0 $0<br />
Goods & Services Tax 0% $0 $0<br />
Harmonized Sales Tax 13% $150,300 $105,200<br />
Subtotal Construction $196,500 $137,600<br />
Owner's Soft Costs<br />
Eng<strong>in</strong>eer<strong>in</strong>g (Design, Construction and Commission<strong>in</strong>g Support) 15% $202,900 $142,000<br />
Cont<strong>in</strong>gency 10% $135,200 $94,700<br />
Subtotal Owner's Soft Costs $338,100 $236,700<br />
Total ETS Cost (w/o Taxes) $1,540,100 $1,078,100<br />
Total ETS Cost (w/ Taxes) $1,690,400 $1,183,300
Pearson Eco Bus<strong>in</strong>ess Zone - ETS Cost Estimate Cool<strong>in</strong>g Heat<strong>in</strong>g<br />
Phase 1A ($) ($)<br />
9000 kW of Heat<strong>in</strong>g and 2510 Tons of Cool<strong>in</strong>g (6 Heat<strong>in</strong>g & 6 Cool<strong>in</strong>g ETS's)<br />
Owner Supplied<br />
Heat Exchangers $282,700 $114,700<br />
Isolation Valves $0 $23,200<br />
Controls & Meter<strong>in</strong>g $166,300 $136,300<br />
Additional Primary & Secondary Pip<strong>in</strong>g Modifications $0 $0<br />
Owner Supplied Subtotal $449,000 $274,200<br />
Contractor Supplied<br />
Mechanical & Electrical Material and Installation $870,200 $644,900<br />
Contractor Supplied Subtotal $870,200 $644,900<br />
Construction Soft Costs<br />
General Contractor Overhead and Profit Included Included<br />
Construction Management and Supervision 4% $52,800 $36,800<br />
Prov<strong>in</strong>cial Sales Tax 0% $0 $0<br />
Goods & Services Tax 0% $0 $0<br />
Harmonized Sales Tax 13% $171,500 $119,500<br />
Subtotal Construction $224,300 $156,300<br />
Owner's Soft Costs<br />
Eng<strong>in</strong>eer<strong>in</strong>g (Design, Construction and Commission<strong>in</strong>g Support) 15% $231,500 $161,300<br />
Cont<strong>in</strong>gency 10% $154,300 $107,500<br />
Subtotal Owner's Soft Costs $385,800 $268,800<br />
Total ETS Cost (w/o Taxes) $1,757,800 $1,224,700<br />
Total ETS Cost (w/ Taxes) $1,929,300 $1,344,200<br />
Pearson Eco Bus<strong>in</strong>ess Zone - ETS Cost Estimate Cool<strong>in</strong>g Heat<strong>in</strong>g<br />
Phase 2 ($) ($)<br />
1900 kW of Heat<strong>in</strong>g and 850 Tons of Cool<strong>in</strong>g (5 Heat<strong>in</strong>g & 5 Cool<strong>in</strong>g ETS's)<br />
Owner Supplied<br />
Heat Exchangers $91,100 $41,100<br />
Isolation Valves $0 $9,500<br />
Controls & Meter<strong>in</strong>g $111,700 $109,300<br />
Additional Primary & Secondary Pip<strong>in</strong>g Modifications $0 $0<br />
Owner Supplied Subtotal $202,800 $159,900<br />
Contractor Supplied<br />
Mechanical & Electrical Material and Installation $370,500 $283,600<br />
Contractor Supplied Subtotal $370,500 $283,600<br />
Construction Soft Costs<br />
General Contractor Overhead and Profit Included Included<br />
Construction Management and Supervision 4% $22,900 $17,700<br />
Prov<strong>in</strong>cial Sales Tax 0% $0 $0<br />
Goods & Services Tax 0% $0 $0<br />
Harmonized Sales Tax 13% $74,500 $57,700<br />
Subtotal Construction $97,400 $75,400<br />
Owner's Soft Costs<br />
Eng<strong>in</strong>eer<strong>in</strong>g (Design, Construction and Commission<strong>in</strong>g Support) 15% $100,600 $77,800<br />
Cont<strong>in</strong>gency 10% $67,100 $51,900<br />
Subtotal Owner's Soft Costs $167,700 $129,700<br />
Total ETS Cost (w/o Taxes) $763,900 $590,900<br />
Total ETS Cost (w/ Taxes) $838,400 $648,600
1.<br />
2.<br />
3.<br />
4.<br />
5.<br />
6.<br />
7.<br />
8.<br />
9.<br />
10.<br />
11.<br />
12.<br />
Pearson Eco Bus<strong>in</strong>ess Zone - ETS Cost Estimate Cool<strong>in</strong>g Heat<strong>in</strong>g<br />
Phase 3 ($) ($)<br />
6600 kW of Heat<strong>in</strong>g and 1160 Tons of Cool<strong>in</strong>g (4 Heat<strong>in</strong>g & 4 Cool<strong>in</strong>g ETS's)<br />
Owner Supplied<br />
Heat Exchangers $89,000 $90,800<br />
Isolation Valves $0 $18,100<br />
Controls & Meter<strong>in</strong>g $101,200 $118,300<br />
Additional Primary & Secondary Pip<strong>in</strong>g Modifications $0 $0<br />
Owner Supplied Subtotal $190,200 $227,200<br />
Contractor Supplied<br />
Mechanical & Electrical Material and Installation $455,600 $446,500<br />
Contractor Supplied Subtotal $455,600 $446,500<br />
Construction Soft Costs<br />
General Contractor Overhead and Profit Included Included<br />
Construction Management and Supervision 4% $25,800 $26,900<br />
Prov<strong>in</strong>cial Sales Tax 0% $0 $0<br />
Goods & Services Tax 0% $0 $0<br />
Harmonized Sales Tax 13% $84,000 $87,600<br />
Subtotal Construction $109,800 $114,500<br />
Owner's Soft Costs<br />
Eng<strong>in</strong>eer<strong>in</strong>g (Design, Construction and Commission<strong>in</strong>g Support) 15% $113,300 $118,200<br />
Cont<strong>in</strong>gency 10% $75,600 $78,800<br />
Subtotal Owner's Soft Costs $188,900 $197,000<br />
Notes:<br />
Total ETS Cost (w/o Taxes) $860,500 $897,600<br />
Total ETS Cost (w/ Taxes) $944,500 $985,200<br />
ETS Costs reflects primary side with secondary side modification EXCLUDED. 1 ETS per build<strong>in</strong>g<br />
Pric<strong>in</strong>g assumes sufficient floor space <strong>in</strong> a ground or basement level mechanical room and limits the ETS location to a maximum of<br />
10 m. from an outside wall.<br />
The cost estimates provided are Class C and thus are prelim<strong>in</strong>ary.<br />
Pric<strong>in</strong>g reflects 1 heat exchanger at 120% for heat<strong>in</strong>g and 1 heat exchanger for DHW and cool<strong>in</strong>g respectively.<br />
Pric<strong>in</strong>g reflects a comb<strong>in</strong>ed commercial control system and meter<strong>in</strong>g.<br />
ETS Cost reflects an <strong>in</strong>-direct connection based on 30°C district heat<strong>in</strong>g differential temperature.<br />
ETS Cost reflects an <strong>in</strong>-direct connection based on 8.3°C district cool<strong>in</strong>g differenital temperature.<br />
Pric<strong>in</strong>g is based on calculated peak loads for heat<strong>in</strong>g as shown <strong>in</strong> the load table.<br />
Estimate of 13% HST <strong>in</strong>cluded <strong>in</strong> prelim<strong>in</strong>ary capital costs.<br />
Communication cable, material and <strong>in</strong>stallation from ma<strong>in</strong>l<strong>in</strong>e <strong>in</strong> street to build<strong>in</strong>g wall not <strong>in</strong>cluded <strong>in</strong> pric<strong>in</strong>g. These costs are<br />
No cost allowance for secondary modifications/pipe risers to boiler rooms.<br />
Airway Centre is consideredto be comprised of four (4) build<strong>in</strong>gs (4 ETSs).
TRCA Pearson Eco-Bus<strong>in</strong>ess Zone <strong>District</strong> <strong>Energy</strong> <strong>Feasibility</strong> <strong>Study</strong> 10 April 2012<br />
Appendices<br />
20 Appendix J: Canadian Experience of DES Development<br />
20.1 Larger New DE Utility Systems<br />
Table 30 lists owners and operators of the larger utility DES that have commenced operation <strong>in</strong><br />
Canada with<strong>in</strong> the past two decades. They are all planned to serve over 20 MWt of heat<strong>in</strong>g or<br />
cool<strong>in</strong>g demand (MWt). Smaller systems will also be discussed <strong>in</strong> the next subsection. The<br />
Systems shown <strong>in</strong> Table 4 are a comparable size and complexity to that envisaged for the<br />
<strong>Project</strong> <strong>Green</strong> DES and offer relevant experiences.<br />
DES Name COD (*) Owners and Operators, where different<br />
Calgary <strong>District</strong> Heat<strong>in</strong>g 2010 ENMAX Corporation, owned by the City of Calgary<br />
Southeast False Creek<br />
<strong>Energy</strong> Utility<br />
2009 City of Vancouver<br />
Regent Park <strong>Energy</strong> 2008 60% Toronto Community Hous<strong>in</strong>g Corporation (TCHC, an<br />
agency of the City of Toronto), 40% Corix Utilities<br />
Enwave, Deep Lake<br />
Water Cool<strong>in</strong>g<br />
2004 Ontario Municipal Employees Retirement System<br />
(OMERS) (majority), City of Toronto (m<strong>in</strong>ority)<br />
Markham <strong>District</strong> <strong>Energy</strong> 2001 Town of Markham, through Markham Enterprises<br />
Corporation (a for-profit corporation)<br />
<strong>District</strong> <strong>Energy</strong> W<strong>in</strong>dsor 1996 City of W<strong>in</strong>dsor, through W<strong>in</strong>dsor Utilities Commission –<br />
distribution assets only; the EC is owned by OMERS<br />
Table 29 Ownership of Larger DES<br />
*COD = Commencement of Operation Date<br />
Only “utility“ DES serv<strong>in</strong>g multiple <strong>in</strong>dependent customers are <strong>in</strong>cluded <strong>in</strong> this review, as<br />
opposed to DES that serve multiple build<strong>in</strong>gs all under common ownership, e.g. at a university<br />
or military base. The bus<strong>in</strong>ess dynamics are different. The utility type of DES is most relevant<br />
to this study.<br />
Examples of private acquisitions of established DES dur<strong>in</strong>g the previous two decades <strong>in</strong>clude<br />
Charlottetown, London, Cornwall, W<strong>in</strong>dsor (the <strong>Energy</strong> Centre) and Enwave <strong>in</strong> Toronto. In<br />
some cases, private <strong>in</strong>vestment provided capital needed for a specific <strong>in</strong>tegration or expansion<br />
opportunity, e.g. <strong>in</strong> the cases of Charlottetown and Enwave (for deep lake water cool<strong>in</strong>g).<br />
The follow<strong>in</strong>g notes on the experience of the development of the new DES listed <strong>in</strong> Table 4<br />
provide context for the <strong>Project</strong> <strong>Green</strong> DES.<br />
20.1.1 Calgary<br />
The <strong>in</strong>itial impetus for the DES <strong>in</strong> Calgary came from the City Build<strong>in</strong>gs Department related to<br />
City goals for GHG reduction and energy self-sufficiency for City owned build<strong>in</strong>gs. The orig<strong>in</strong>al<br />
150
TRCA Pearson Eco-Bus<strong>in</strong>ess Zone <strong>District</strong> <strong>Energy</strong> <strong>Feasibility</strong> <strong>Study</strong> 10 April 2012<br />
Appendices<br />
plan was to serve a group of downtown municipal build<strong>in</strong>gs. The <strong>in</strong>itial ownership model was<br />
seen as either a City owned utility or as a division of ENMAX Corporation, which is the City<br />
owned local electricity Distribution Company.<br />
<strong>District</strong> heat<strong>in</strong>g with CHP is a complementary bus<strong>in</strong>ess to distributed generation which ENMAX<br />
was <strong>in</strong>terested <strong>in</strong> develop<strong>in</strong>g. Hence, it became natural for ENMAX to take over development of<br />
the DES with a plan to build distributed generation <strong>in</strong> the form of CHP supply<strong>in</strong>g the district<br />
heat<strong>in</strong>g base load.<br />
A parallel path <strong>in</strong> <strong>Project</strong> <strong>Green</strong> would be for Enersource to develop the DES. This model,<br />
where the local electricity distribution company was the vehicle that took on a DE development<br />
project was seen mostly <strong>in</strong> Ontario <strong>in</strong> the mid-90’s up to 2003. These were <strong>in</strong> Cornwall and<br />
(from a management perspective) W<strong>in</strong>dsor and Sudbury, as well as <strong>in</strong> Markham and Hamilton.<br />
This type of ownership and operat<strong>in</strong>g model was possible, especially for relatively small projects<br />
because the municipally owned electric utilities had access to capital and could also tap federal<br />
fund<strong>in</strong>g, e.g. through the Federation of Canadian Municipalities. Furthermore, they had relevant<br />
utility plann<strong>in</strong>g and management skills.<br />
In all those cases, the <strong>in</strong>itial <strong>in</strong>terest arose <strong>in</strong> relation to distributed generation. But hav<strong>in</strong>g DE<br />
as a division of an electric utility can result <strong>in</strong> limitations to growth. DE is not primarily about<br />
distributed generation (DG). It is about heat<strong>in</strong>g and/or cool<strong>in</strong>g, ma<strong>in</strong>ly heat<strong>in</strong>g <strong>in</strong> Canada. DG<br />
<strong>in</strong> the form of CHP is just one option for heat generation and not the ma<strong>in</strong> focus of DE<br />
development.<br />
The bus<strong>in</strong>ess dynamics of electricity distribution and DE are different as DE is not regulated<br />
(except <strong>in</strong> BC) and is not a monopoly. DE must compete for customers and must self-generate<br />
or source locally all of its energy. It has a narrower customer base, i.e. a specific group of<br />
commercial build<strong>in</strong>gs and would be a small component of an electric utility, possibly suffer<strong>in</strong>g<br />
from its status as a relatively low priority for the larger utility.<br />
In the case of Markham, when Markham Hydro became part of PowerStream owned by<br />
Vaughan, Markham and Barrie, the DES was left with the Town of Markham.<br />
20.1.2 Southeast False Creek<br />
The City of Vancouver has embarked on revitalization of former <strong>in</strong>dustrial lands known as<br />
Southeast False Creek (SFC). Some of the lands are owned by the City.<br />
After consider<strong>in</strong>g other ownership models a Neighbourhood <strong>Energy</strong> Utility (NEU), directly owned<br />
and operated by the City was selected as the preferred option to supply heat<strong>in</strong>g <strong>in</strong> SFC. This<br />
decision may have been <strong>in</strong>fluenced by the imperative to commence operations <strong>in</strong> time for the<br />
2010 W<strong>in</strong>ter Olympics.<br />
Another factor favour<strong>in</strong>g public ownership <strong>in</strong> the early stages is that while the Olympic Athletes<br />
Village was committed, the rate of build-out of the rest of SFC was uncerta<strong>in</strong>. The cash flow for<br />
a DES is uncerta<strong>in</strong> <strong>in</strong> these circumstances. The DES will become more attractive to private<br />
<strong>in</strong>vestment as the market develops over the years.<br />
BC is the only Prov<strong>in</strong>ce where DE is regulated. City owned DES <strong>in</strong> BC, such as the SFC NEU,<br />
are regulated by their respective city governments. DES not under municipal ownership (such<br />
as Central Heat <strong>in</strong> Vancouver and Dockside <strong>Green</strong> <strong>in</strong> Victoria) are regulated by the BC Utilities<br />
Commission.<br />
151
TRCA Pearson Eco-Bus<strong>in</strong>ess Zone <strong>District</strong> <strong>Energy</strong> <strong>Feasibility</strong> <strong>Study</strong> 10 April 2012<br />
Appendices<br />
When the SFC NEU reaches a certa<strong>in</strong> stage of development it is likely that the City of<br />
Vancouver will be able to transfer some or all of the assets to a regulated private utility, if it so<br />
chooses.<br />
A parallel path for the Pearson Area DES would be for a City or Region bylaw to create a wholly<br />
City or Region owned utility to build, own and operate the DES, hir<strong>in</strong>g or contract<strong>in</strong>g for the<br />
required management and operat<strong>in</strong>g skills. At some stage <strong>in</strong> its build-out, all or some of the<br />
shares of the DES could be sold to other parties.<br />
Whether DE rate regulation, as <strong>in</strong> BC, will ever be necessary <strong>in</strong> Ontario is questionable. It may<br />
not be necessary if fair and reasonable rates through contracts have become the accepted<br />
practice. If rate regulation was desired by the City or Region, but not established by the OEB,<br />
the municipality could establish its own rate regulation process through bylaw as the cities of<br />
Vancouver and North Vancouver have done.<br />
The other possibility is that the OEM may allow Enbridge to conduct the DE bus<strong>in</strong>ess on a<br />
regulated utility model. If the DES had already be<strong>in</strong>g established by the municipality Enbridge<br />
may be <strong>in</strong>terested <strong>in</strong> acquir<strong>in</strong>g it as a go<strong>in</strong>g concern and operat<strong>in</strong>g it as a regulated utility.<br />
20.1.3 Regent Park <strong>Energy</strong> (RPE)<br />
RPE is similar to the other DES based on new developments. It differs <strong>in</strong> that a third of the new<br />
development <strong>in</strong> Regent Park is to be public hous<strong>in</strong>g replac<strong>in</strong>g exist<strong>in</strong>g build<strong>in</strong>gs. Those<br />
build<strong>in</strong>gs are to be demolished and replaced <strong>in</strong> six phases.<br />
The other two-thirds of the new development will be private condom<strong>in</strong>iums whose rate of<br />
development is subject to the market. The condom<strong>in</strong>ium market <strong>in</strong> downtown Toronto has been<br />
strong <strong>in</strong> recent years. In fact, the private portion of Phase 1 sold out to a pre-subscribed list of<br />
preferred potential customers before it was even released for sale to the general public.<br />
There are prospects of serv<strong>in</strong>g additional loads <strong>in</strong> several nearby exist<strong>in</strong>g large build<strong>in</strong>gs owned<br />
by TCHC. For the above reasons, the real estate development risk fac<strong>in</strong>g RPE appears to be<br />
less than for other DES serv<strong>in</strong>g new development. This may have helped TCHC recruit a<br />
private partner.<br />
Other success factors were that the co-development agreement with Daniels for the total real<br />
estate development, prelim<strong>in</strong>ary design, bus<strong>in</strong>ess case and TCHC Board approval for the DES<br />
were all <strong>in</strong> place before the private partner procurement process had progressed very far.<br />
There was no uncerta<strong>in</strong>ty about location of the <strong>Energy</strong> Centre, s<strong>in</strong>ce it had long been decided to<br />
locate the <strong>Energy</strong> Centre <strong>in</strong> the basement of the first build<strong>in</strong>g, which would be owned by TCHC.<br />
Furthermore, TCHC elected to keep 60% of the DES ownership and had access to low cost<br />
f<strong>in</strong>anc<strong>in</strong>g.<br />
This all gave the potential DE partners comfort and clarity on the nature of the project and their<br />
expected <strong>in</strong>volvement. Even so, the partner recruitment process took over two years; that<br />
<strong>in</strong>cluded time required to negotiate the f<strong>in</strong>al agreement after Corix Utilities had been selected as<br />
the preferred partner and operat<strong>in</strong>g contractor.<br />
This experience suggests that municipalities can recruit private partners for DE development<br />
and that the chances of success would be improved if the real estate development plans are<br />
transparent and if the ownership model and the scope of the DE project are well def<strong>in</strong>ed.<br />
As <strong>in</strong> Regent Park, the private partners might appropriately be m<strong>in</strong>ority partners <strong>in</strong>itially so that<br />
the municipality could reta<strong>in</strong> control dur<strong>in</strong>g the early formative stages. It may be convenient for<br />
the m<strong>in</strong>ority private partner to operate the DES under contract.<br />
152
TRCA Pearson Eco-Bus<strong>in</strong>ess Zone <strong>District</strong> <strong>Energy</strong> <strong>Feasibility</strong> <strong>Study</strong> 10 April 2012<br />
Appendices<br />
When consider<strong>in</strong>g a public private partnership of this type it is important to recognize the<br />
<strong>in</strong>herently different goals of the partners and take care <strong>in</strong> structur<strong>in</strong>g.<br />
20.1.4 Enwave<br />
Enwave <strong>Energy</strong> Corporation was established under the 1998 <strong>Energy</strong> Competition Act based on<br />
the assets of the Toronto <strong>District</strong> Heat<strong>in</strong>g Corporation (TDHC). It is <strong>in</strong>cluded <strong>in</strong> this review of<br />
new DES because s<strong>in</strong>ce its <strong>in</strong>ception as a regular bus<strong>in</strong>ess corporation Enwave has developed<br />
a district cool<strong>in</strong>g system based on deep lake water.<br />
Re-organization and <strong>in</strong>clusion of OMERS 21<br />
, which <strong>in</strong>itially became a 50% partner with the City<br />
of Toronto, gave access to equity that allowed the deep lake water cool<strong>in</strong>g system to be built.<br />
This is similar to the scenario <strong>in</strong> Charlottetown (which was developed <strong>in</strong> the mid-1980’s), where<br />
acquisition by a private utility provided f<strong>in</strong>anc<strong>in</strong>g for <strong>in</strong>tegration of three exist<strong>in</strong>g separate<br />
systems that were all formerly publicly owned.<br />
A similar scenario could eventually unfold for <strong>Project</strong> <strong>Green</strong> if the <strong>in</strong>itial nucleus of a DES is<br />
developed by a corporation controlled by public sector entities. When the heat load has grown<br />
sufficiently there may be an opportunity for an <strong>in</strong>vestment to expand the system or build a new<br />
base load, non-conventional energy source <strong>in</strong> one of the surround<strong>in</strong>g <strong>in</strong>dustrial areas. The<br />
<strong>in</strong>itial conventional EC could then serve peak<strong>in</strong>g and standby duty.<br />
20.1.5 Markham<br />
Markham <strong>District</strong> <strong>Energy</strong> (MDE) was the first of the larger Canadian DES that have been<br />
developed <strong>in</strong> the past two decades to serve a planned new development area. MDE<br />
commenced operation <strong>in</strong> 2001. (This scenario was followed by Regent Park <strong>in</strong> 2008 and SFC<br />
<strong>in</strong> 2009 and, to an extent, the Calgary downtown district heat<strong>in</strong>g system, which is planned to<br />
supply new development <strong>in</strong> the East Village, <strong>in</strong> addition to the exist<strong>in</strong>g municipal build<strong>in</strong>gs that<br />
formed its anchor load).<br />
As with W<strong>in</strong>dsor <strong>in</strong> 1996, the first plant was committed follow<strong>in</strong>g the pledge of anchor<br />
customers. For example, <strong>in</strong> the case of W<strong>in</strong>dsor, this was the new Cas<strong>in</strong>o W<strong>in</strong>dsor. In the case<br />
of Markham it was the IBM Software Laboratory and Motorola. Similarly, a possible scenario for<br />
the <strong>Project</strong> <strong>Green</strong> DES would be that the <strong>in</strong>itial nucleus of a DES might be triggered by a first<br />
large commercial real estate development on one or more of the development parcels that were<br />
identified (the circles without numbers <strong>in</strong> Figure 2).<br />
MDE was <strong>in</strong>itiated and its development and early operation were managed by the former<br />
Markham Hydro. At that time, this had been the most common model for new DES <strong>in</strong> Ontario,<br />
as previously discussed. When Markham Hydro became part of PowerStream, the Town<br />
decided to keep MDE under their wholly owned subsidiary, Markham Enterprises Corporation.<br />
The current ownership and governance of MDE is a precedent for a possible model whereby the<br />
DES would be owned and operated as a bus<strong>in</strong>ess corporation wholly owned by one or more of<br />
the three <strong>in</strong>volved municipalities (i.e. the cities of Mississauga and Toronto and the Region of<br />
Peel). The advantages <strong>in</strong>clude access to senior government fund<strong>in</strong>g assistance as a municipal<br />
entity and a close relationship with the municipalities.<br />
21 Ontario Municipal Employees Retirement System<br />
153
TRCA Pearson Eco-Bus<strong>in</strong>ess Zone <strong>District</strong> <strong>Energy</strong> <strong>Feasibility</strong> <strong>Study</strong> 10 April 2012<br />
Appendices<br />
Strong support from the Town is a success factor <strong>in</strong> Markham, e.g. build<strong>in</strong>g developers are<br />
given po<strong>in</strong>ts for susta<strong>in</strong>ability by plann<strong>in</strong>g to connect to DE, which facilitates their development<br />
approvals.<br />
Another success factor is that the heart of the service territory is a green field development<br />
known as Markham Centre. This has the advantage of hav<strong>in</strong>g only one land developer, namely<br />
the Rem<strong>in</strong>gton Group.<br />
20.1.6 W<strong>in</strong>dsor<br />
The DES <strong>in</strong> W<strong>in</strong>dsor is a little smaller than the ultimate build-out planned for the other systems<br />
reviewed <strong>in</strong> this subsection. But at 15 MWt of hot water, 6 MWt of steam, 5,660 tons of chilled<br />
water, ice storage and 6 MWe of emergency power, it is larger and more complex than the<br />
smaller utility DES developed <strong>in</strong> the last two decades as reviewed <strong>in</strong> the next subsection.<br />
It is of special <strong>in</strong>terest as it is one of the few, if not the only, DES <strong>in</strong> Canada to have an<br />
ownership model that splits the distribution assets from the <strong>Energy</strong> Centre. <strong>District</strong> <strong>Energy</strong><br />
W<strong>in</strong>dsor (DEW, owned by the W<strong>in</strong>dsor Utilities Commission) buys energy wholesale from BPC<br />
<strong>District</strong> <strong>Energy</strong> Inc., a subsidiary of OMERS. BPC acquired the <strong>Energy</strong> Centre from the orig<strong>in</strong>al<br />
developers.<br />
The experience of W<strong>in</strong>dsor suggests this unusual ownership structure is challeng<strong>in</strong>g. It tends to<br />
remove the <strong>in</strong>centive for growth from both sides because each has to deal with the other to<br />
effect growth. Hence, if the DES contemplated for the Pearson area was to become dependent<br />
on the GTAA for energy, the bus<strong>in</strong>ess relationships should be considered very carefully,<br />
<strong>in</strong>clud<strong>in</strong>g the pric<strong>in</strong>g structure. Lessons could be learned from the W<strong>in</strong>dsor experience.<br />
Also, ownership of the DES by the water utility (the W<strong>in</strong>dsor Utilities Commission <strong>in</strong>cludes the<br />
water utility) is not recommended from an organizational perspective as these utilities operate<br />
on completely different bus<strong>in</strong>ess models. The provision of potable water and fire protection is a<br />
mandated municipal service with a monopoly and an obligation to serve. But a DES is a service<br />
that must compete for customers. A successful DES might enjoy a small monopoly for its own<br />
specific area but that is only a by-product of hav<strong>in</strong>g successfully established reliable service.<br />
DE assets appear to be similar to water assets, i.e. buried pipe. But a complete DES <strong>in</strong>cludes<br />
the <strong>Energy</strong> Centre which <strong>in</strong>volves very different technology. It may be partly because of special<br />
technologies used <strong>in</strong> <strong>Energy</strong> Centres, along with their high capital requirements, that there is a<br />
temptation to contract out, e.g. through Design Build, F<strong>in</strong>ance Own and Ma<strong>in</strong>ta<strong>in</strong> (DBFOM) type<br />
contracts.<br />
There are will<strong>in</strong>g counter-parties to DBFOM contracts but risk is not really transferred. The<br />
wholesale energy purchase agreements have firm payment obligations that are the equivalent<br />
of debt obligations. Furthermore, the DE utility is still responsible for reliable service to the end<br />
users with less control than if it owned the <strong>Energy</strong> Centre.<br />
In summary, the experience of DEW raised concerns about split ownership of the distribution<br />
and energy source and aga<strong>in</strong>st roll<strong>in</strong>g DE <strong>in</strong>to the water utility.<br />
20.2 Smaller New DE Utility Systems<br />
Brief case histories of smaller DES over 1 MWt are <strong>in</strong>cluded <strong>in</strong> this subsection <strong>in</strong> order to<br />
present an exhaustive review of all of the utility DES of any significant size that have been<br />
developed <strong>in</strong> Canada over the past two decades. Cornwall, Hamilton and Sudbury serve <strong>in</strong> the<br />
order of 10 MWt, whereas the others <strong>in</strong> Table 31 are <strong>in</strong> the range of 1 to 5 MWt.<br />
154
TRCA Pearson Eco-Bus<strong>in</strong>ess Zone <strong>District</strong> <strong>Energy</strong> <strong>Feasibility</strong> <strong>Study</strong> 10 April 2012<br />
Appendices<br />
Some smaller DES developed <strong>in</strong> remote communities are not <strong>in</strong>cluded <strong>in</strong> this review as they<br />
were typically based on site specific circumstances, e.g. CHP us<strong>in</strong>g exist<strong>in</strong>g diesel generators,<br />
lead<strong>in</strong>g to a predom<strong>in</strong>ant role for the electric utility that owned the generators, and they typically<br />
supply heat only as and when the diesel generators are runn<strong>in</strong>g, so the customers have to keep<br />
their own boilers <strong>in</strong> operation.<br />
DES Name COD Owners and Operators, where different<br />
Dockside <strong>Green</strong><br />
<strong>Energy</strong><br />
Strathcona<br />
Community <strong>Energy</strong><br />
System<br />
Revelstoke<br />
Community <strong>Energy</strong><br />
Lonsdale <strong>Energy</strong><br />
Corporation<br />
Hamilton Community<br />
<strong>Energy</strong><br />
Sudbury <strong>District</strong><br />
<strong>Energy</strong> Corporation<br />
Cornwall <strong>District</strong><br />
Heat<strong>in</strong>g (CDH)<br />
2009 <strong>Partners</strong>hip of land developers with energy companies<br />
(operated by one of the energy companies, Corix Utilities)<br />
2006 Strathcona County (a specialized municipality <strong>in</strong> Alberta)<br />
2005 City of Revelstoke<br />
Oujé Bougoumou 1993 Cree First Nation<br />
Table 30 Ownership of Smaller DES<br />
2004 City of North Vancouver (operated by Terasen Utility<br />
Services)<br />
2003 City of Hamilton, through Hamilton Utilities Corporation (a<br />
for-profit corporation)<br />
1998 50% City of Sudbury, 50% Toromont <strong>Energy</strong><br />
1994 Fortis Ontario, orig<strong>in</strong>ally developed by Cornwall Electric,<br />
wholly owned by City of Cornwall<br />
The follow<strong>in</strong>g notes on the experience of each DES listed <strong>in</strong> Table 5 have less relevance to<br />
<strong>Project</strong> <strong>Green</strong> than those <strong>in</strong> Table 4, as most are significantly smaller than even Phase 1 as<br />
envisaged for <strong>Project</strong> <strong>Green</strong>. Nevertheless, it is useful for <strong>Partners</strong> <strong>in</strong> <strong>Project</strong> <strong>Green</strong> to be<br />
aware of this history.<br />
20.2.1 Dockside <strong>Green</strong> <strong>Energy</strong><br />
The most recent ownership structure of Dockside <strong>Green</strong> <strong>Energy</strong> (DGE) LLP as reported on its<br />
website is composed of Vancity Capital, Corix Utilities and Terasen <strong>Energy</strong> Services. It is<br />
operated under contract by Corix Utilities. It is a private utility with rates regulated by the<br />
prov<strong>in</strong>ce as described <strong>in</strong> its rate application 22<br />
.<br />
22 In their December 2007 application to the British Columbia Utilities Commission for a Certificate of<br />
Public Convenience and Necessity to construct the DES and approval of levelized rates based on their<br />
155
TRCA Pearson Eco-Bus<strong>in</strong>ess Zone <strong>District</strong> <strong>Energy</strong> <strong>Feasibility</strong> <strong>Study</strong> 10 April 2012<br />
Appendices<br />
Vancity is the largest credit union <strong>in</strong> Canada and currently the sole owner of the real estate<br />
development company, Dockside <strong>Green</strong> Limited <strong>Partners</strong>hip.<br />
Corix Utilities have ownership and operat<strong>in</strong>g <strong>in</strong>terests <strong>in</strong> a number of power and thermal<br />
distribution systems, <strong>in</strong>clud<strong>in</strong>g military bases <strong>in</strong> Alaska and 40% of RPE.<br />
Terasen <strong>Energy</strong> Services (TES) is a division of Terasen Gas, formerly BC Gas, now owned by<br />
Fortis Inc (which also owns Fortis Ontario, the current owner of Cornwall Electric and Cornwall<br />
<strong>District</strong> Heat<strong>in</strong>g). On their web-site, TES list four other DE projects they are <strong>in</strong>volved with. They<br />
are all <strong>in</strong> BC, appear to be very small-scale and at a prelim<strong>in</strong>ary stage of development.<br />
Both the DES and the real estate development company orig<strong>in</strong>ally <strong>in</strong>cluded another company,<br />
W<strong>in</strong>dmill Developments, which has moved on to pursue other <strong>in</strong>terests. It is worthy to note that<br />
change of ownership has occurred <strong>in</strong> almost all DES <strong>in</strong> Canada that have <strong>in</strong>cluded a private<br />
component (e.g. the DES <strong>in</strong> Charlottetown, Cornwall, London, Ajax and the <strong>Energy</strong> Centre <strong>in</strong><br />
W<strong>in</strong>dsor). When consider<strong>in</strong>g private <strong>in</strong>volvement <strong>in</strong> DE, possible change <strong>in</strong> ownership should<br />
be anticipated.<br />
DGE is an <strong>in</strong>terest<strong>in</strong>g example as it is the only totally private, recent DES start-up above 1 MWt<br />
<strong>in</strong> Canada. An analogous DE development structure for <strong>Project</strong> <strong>Green</strong> might <strong>in</strong>volve a<br />
partnership of land developers or build<strong>in</strong>g owners with energy companies, possibly Enbridge or<br />
Corix Utilities. However, there are enough differences <strong>in</strong> circumstances to view this option as<br />
unlikely for <strong>Project</strong> <strong>Green</strong>.<br />
First as noted above, DE is regulated <strong>in</strong> BC and this appears to suit the energy companies<br />
<strong>in</strong>volved <strong>in</strong> DGE and would be expected to suit Enbridge or Corix Utilities, but there is no<br />
regulatory regime for DE <strong>in</strong> Ontario. If regulation came <strong>in</strong> the future, the chances of a DGE type<br />
of ownership model <strong>in</strong> <strong>Project</strong> <strong>Green</strong> might improve. In that event, if the DES had started under<br />
a municipal model it could transition to the regulated private model.<br />
The biomass fired district heat<strong>in</strong>g system is an important plank <strong>in</strong> the market<strong>in</strong>g mix that<br />
stresses the susta<strong>in</strong>able character of Dockside <strong>Green</strong>. The developers were required to commit<br />
to this approach under the Master Development Agreement with the City of Victoria. The City<br />
purchased the Dockside Lands, a brown-field site from the Prov<strong>in</strong>ce <strong>in</strong> 1989. Then the City<br />
went on to assess development opportunities and select the land developer through a RFP with<br />
a view to creat<strong>in</strong>g a green community as was suited to the high-end ocean view location. This<br />
scenario cannot unfold <strong>in</strong> the Pearson area because the municipalities do not own the land.<br />
Whereas it is not obvious that a similar ownership model to Dockside <strong>Green</strong> would be possible<br />
or appropriate for <strong>Project</strong> <strong>Green</strong>, the land and build<strong>in</strong>gs owners should be consulted and<br />
canvassed for their <strong>in</strong>terest <strong>in</strong> participation <strong>in</strong> DE. As illustrated by the <strong>in</strong>itiator role played by<br />
W<strong>in</strong>dmill Developments <strong>in</strong> Dockside <strong>Green</strong>, private companies may start th<strong>in</strong>gs then move on<br />
but this may still be useful <strong>in</strong> gett<strong>in</strong>g the DES up and runn<strong>in</strong>g.<br />
Land developers may be <strong>in</strong>terested for a time period equivalent to the real estate development<br />
phase. The capital and risks <strong>in</strong>volved <strong>in</strong> the DES development may be seen by developers as a<br />
relatively modest <strong>in</strong>crement to the overall real estate development. Their op<strong>in</strong>ion on this can<br />
only be discovered through consultation and shar<strong>in</strong>g of feasibility studies completed to date.<br />
proposed capital structure and return on capacity.<br />
http://docksidegreenenergy.com/regulatory_applications.html.<br />
156
TRCA Pearson Eco-Bus<strong>in</strong>ess Zone <strong>District</strong> <strong>Energy</strong> <strong>Feasibility</strong> <strong>Study</strong> 10 April 2012<br />
Appendices<br />
Another caveat would be that even if land or real estate developers would like to develop DE,<br />
experienced energy utilities ought to be <strong>in</strong>volved.<br />
20.2.2 Strathcona Community <strong>Energy</strong> System<br />
Strathcona Community <strong>Energy</strong> System is owned and operated by Strathcona County, which is a<br />
special class of municipality <strong>in</strong> Alberta. The DES began supply<strong>in</strong>g heat to exist<strong>in</strong>g public<br />
build<strong>in</strong>gs and new development <strong>in</strong> Sherwood Park, near Edmonton, <strong>in</strong> 2006. It is a relatively<br />
small system but expected to cont<strong>in</strong>ue expand<strong>in</strong>g and is consider<strong>in</strong>g retrofitt<strong>in</strong>g a biomass<br />
boiler. This is another example of a municipally owned DE start up.<br />
The County is consider<strong>in</strong>g another DES to use waste heat from a plant that a private company,<br />
Enerkem is build<strong>in</strong>g to produce ethanol from municipal waste <strong>in</strong> Edmonton.<br />
The relatively low level of capital <strong>in</strong>vestment, small scale and government assistance made it<br />
more feasible for the municipality to undertake this project without partners.<br />
20.2.3 Revelstoke Community <strong>Energy</strong><br />
Revelstoke Community <strong>Energy</strong> is owned and operated as a wholly owned subsidiary of the City<br />
of Revelstoke. The base load energy source is a biomass thermal oil boiler hosted by a sawmill.<br />
The unit supplies the saw-mill with low pressure steam and also supplies hot water to a<br />
number of publicly owned build<strong>in</strong>gs. The small scale and forest products company town sett<strong>in</strong>g<br />
are not very relevant to <strong>Project</strong> <strong>Green</strong> except that it is another example of municipal ownership<br />
with senior government fund<strong>in</strong>g assistance, which has become the most common model <strong>in</strong><br />
Canada.<br />
20.2.4 Lonsdale <strong>Energy</strong> Corporation<br />
Lonsdale <strong>Energy</strong> Corporation (LEC) is a district energy utility wholly owned by the City of North<br />
Vancouver but operated as a separate company. It is a relatively small system serv<strong>in</strong>g <strong>in</strong> the<br />
order of approximately 1 million ft 2 . The technical concept is unusually based on m<strong>in</strong>i-plants.<br />
This is not recommended. It seemed like a good way to stage capital, but <strong>in</strong> practice has led to<br />
<strong>in</strong>stalled capacity <strong>in</strong> excess of actual requirements.<br />
Terasen Utility Services operates LEC under contract and provided a loan of $2 million. (The<br />
capital structure also <strong>in</strong>cluded $2 million from the City and a grant of $2 million with a low cost<br />
loan of $2 million from the Federation of Canadian Municipalities). Terasen Utility Services is a<br />
service company that provides field meter<strong>in</strong>g services to electric, gas, and water utilities,<br />
municipals and cooperatives throughout the US and Canada. Like Terasen <strong>Energy</strong> Services<br />
(part owner of Dockside <strong>Green</strong> <strong>Energy</strong>), it is a subsidiary of Terasen Gas (owned by Fortis,<br />
which also owns the Cornwall <strong>District</strong> Heat<strong>in</strong>g System).<br />
North Vancouver is unusual <strong>in</strong> hav<strong>in</strong>g a bylaw (8086), passed recently, that requires any new<br />
build<strong>in</strong>g <strong>in</strong> the City of more than 1,000 square meters to connect to the district heat<strong>in</strong>g system<br />
unless it is determ<strong>in</strong>ed by the City's Director of F<strong>in</strong>ance that the cost to the City would be<br />
excessive. A previous bylaw simply required hydronic heat<strong>in</strong>g of new build<strong>in</strong>gs with<strong>in</strong> a<br />
specified area. Part of the rationale for these bylaws was to avoid the bus<strong>in</strong>ess as usual<br />
<strong>in</strong>stallation of electric base board heat<strong>in</strong>g that has been practiced <strong>in</strong> BC because it is the lowest<br />
cost option, but this is no longer an issue <strong>in</strong> Ontario.<br />
Bylaw 8086 also allows LEC to provide cool<strong>in</strong>g services, but connection of properties to a LEC<br />
cool<strong>in</strong>g system (should it develop one) is optional.<br />
157
TRCA Pearson Eco-Bus<strong>in</strong>ess Zone <strong>District</strong> <strong>Energy</strong> <strong>Feasibility</strong> <strong>Study</strong> 10 April 2012<br />
Appendices<br />
LEC rates are regulated by the City and aim to recover all costs over 20 years, target<strong>in</strong>g a rate<br />
of return of 5%. The rate of return aims to match the return that the City would obta<strong>in</strong> if it<br />
<strong>in</strong>vested the same amount <strong>in</strong> the money market.<br />
LEC illustrates a possible model whereby a municipality could own the DES as a separate<br />
company, through a hold<strong>in</strong>g corporation, contract out the operation, make connection<br />
mandatory for larger new build<strong>in</strong>gs with<strong>in</strong> specified areas and regulate the rates to recover<br />
costs. A new bylaw would be required. There are probably external parties will<strong>in</strong>g to partner<br />
under such an arrangement. The issue is whether a similar consensus among local municipal<br />
staff and politicians (as to the most desirable DE development route) as occurred <strong>in</strong> North<br />
Vancouver would evolve <strong>in</strong> the Pearson Area. There are higher stakes for developers <strong>in</strong> <strong>Project</strong><br />
<strong>Green</strong> because of the much greater scale of expected new development so a more developerfriendly<br />
approach may be warranted.<br />
20.2.5 Hamilton Community <strong>Energy</strong><br />
Hamilton Community <strong>Energy</strong> was built <strong>in</strong> 2003, owned and operated by a subsidiary of the local<br />
electricity distribution company which is owned by the City. Its anchor customer was an exist<strong>in</strong>g<br />
city owned and operated central utility system. It also connected several private build<strong>in</strong>gs. This<br />
is another example of City ownership through a wholly owned electricity distribution company,<br />
as discussed previously for Calgary and others. It would be analogous to Enersource and/or<br />
Toronto Hydro be<strong>in</strong>g the proponents. This scenario is not seen as a likely outcome at this time,<br />
although it should not be regarded as impossible.<br />
20.2.6 Sudbury <strong>District</strong> <strong>Energy</strong> Corporation<br />
Sudbury <strong>District</strong> <strong>Energy</strong> Corporation (SDEC) was developed <strong>in</strong> 1998 and started as a 50:50<br />
Jo<strong>in</strong>t Venture between the City of Greater Sudbury and Toromont <strong>Energy</strong> Services, a private<br />
energy company that was selected by the City through a RFP process. Both the City and<br />
Sudbury Hydro were <strong>in</strong>volved <strong>in</strong> the development phase.<br />
Toromont <strong>Energy</strong> Services is an affiliate of Toromont Industries. They designed and supplied<br />
the CHP equipment used <strong>in</strong> the <strong>Energy</strong> Centre, contributed equal equity and a loan to SDEC.<br />
Toromont <strong>Energy</strong> Services is also <strong>in</strong>volved <strong>in</strong> management of the operation. The relatively high<br />
level of ownership, <strong>in</strong>vestment and management <strong>in</strong>volvement of Toromont <strong>in</strong> SDEC is <strong>in</strong> the<br />
context of it be<strong>in</strong>g a major equipment vendor to the project.<br />
A caveat to this model is that whereas Toromont Industries are an excellent and well respected<br />
supplier of CHP equipment, competitive procurement would normally be recommended, and it is<br />
generally not good practice for suppliers to be decision makers on energy sources.<br />
20.2.7 Cornwall <strong>District</strong> Heat<strong>in</strong>g<br />
Cornwall <strong>District</strong> Heat<strong>in</strong>g is another illustration of a district heat<strong>in</strong>g system developed by a local<br />
electricity distribution company that was, at that time, owned by the City. It is also an example<br />
of change of private ownership because Enbridge first bought Cornwall Electric from the City<br />
and then later sold it to the current owner, Fortis Ontario.<br />
It is unlikely that Fortis would be <strong>in</strong>terested <strong>in</strong> develop<strong>in</strong>g a DES from scratch but quite possible<br />
that they would be a candidate, among several others, <strong>in</strong>clud<strong>in</strong>g OMERS, to take over the DES<br />
after it had become big enough to engage their <strong>in</strong>terest.<br />
Although the electricity assets of Cornwall Electric were the primary <strong>in</strong>terest of Enbridge, it is<br />
understood they are currently <strong>in</strong>terested <strong>in</strong> DE, but only as a regulated bus<strong>in</strong>ess.<br />
158
TRCA Pearson Eco-Bus<strong>in</strong>ess Zone <strong>District</strong> <strong>Energy</strong> <strong>Feasibility</strong> <strong>Study</strong> 10 April 2012<br />
Appendices<br />
20.2.8 Oujé Bougoumou<br />
The Oujé-Bougoumou district heat<strong>in</strong>g system was built and is owned and operated by the Cree<br />
Nation band to meet the energy needs of their village. As a small and remote biomass based<br />
system it is not very relevant to <strong>Project</strong> <strong>Green</strong>, except as another example of local <strong>in</strong>itiative,<br />
ownership and application of hot water based district heat<strong>in</strong>g to planned new development.<br />
20.3 Summary of Ownership of DES Developed <strong>in</strong> Canada Recently<br />
To summarize observations made <strong>in</strong> this appendix: municipalities have played an important role<br />
<strong>in</strong> the development of all new utility DES of an appreciable size developed <strong>in</strong> Canada over the<br />
past two decades. Levels of current municipal ownership are shown <strong>in</strong> Table 31.<br />
Level of Municipal<br />
Ownership<br />
DES > 20 MW DES < 20 MW<br />
100% 3 5<br />
Majority 1 0<br />
50:50 0 1<br />
M<strong>in</strong>ority 1 0<br />
Split<br />
(distribution/generation)<br />
1 0<br />
Zero 0 2<br />
Total 6 8<br />
Table 31 Summary of DES Ownership<br />
The predom<strong>in</strong>ant role of municipalities <strong>in</strong> DES development <strong>in</strong> Canada is expected to cont<strong>in</strong>ue,<br />
judg<strong>in</strong>g by the lead proponents of DE projects that FVB is currently work<strong>in</strong>g on at the design or<br />
feasibility study stages. These <strong>in</strong>clude the municipalities of Surrey, Langley Township, Pr<strong>in</strong>ce<br />
George, Williams Lake, Quesnel, Saskatoon, Vaughan, Toronto and Corner Brook, as well as<br />
wholly owned municipal electric utilities <strong>in</strong> Guelph and Oakville. This is not surpris<strong>in</strong>g<br />
consider<strong>in</strong>g the nature of DE.<br />
DE requires a similar type of plann<strong>in</strong>g as municipal services. Municipalities have greater access<br />
to senior government fund<strong>in</strong>g that is especially helpful for start-ups. They control rights of way<br />
essential for distribution pip<strong>in</strong>g. Municipalities are generally <strong>in</strong>terested <strong>in</strong> community benefits,<br />
promot<strong>in</strong>g energy self-sufficiency and economic development while tak<strong>in</strong>g <strong>in</strong>to account global<br />
concerns such as greenhouse gas emissions. Such <strong>in</strong>terests provide rationale for DE beyond<br />
purely f<strong>in</strong>ancial ga<strong>in</strong>.<br />
As summarized <strong>in</strong> Table 6, DE case histories provide at least some precedent for all levels of<br />
municipal ownership <strong>in</strong>clud<strong>in</strong>g zero. But 100% or majority municipal ownership accounts for<br />
approximately two-thirds of the case histories exam<strong>in</strong>ed. The exceptions are poor precedents<br />
as noted <strong>in</strong> the follow<strong>in</strong>g paragraphs.<br />
159
TRCA Pearson Eco-Bus<strong>in</strong>ess Zone <strong>District</strong> <strong>Energy</strong> <strong>Feasibility</strong> <strong>Study</strong> 10 April 2012<br />
Appendices<br />
The majority private ownership <strong>in</strong> Enwave came gradually. The City <strong>in</strong>itially put up what was<br />
deemed to be a 50% share <strong>in</strong> the form of the exist<strong>in</strong>g assets of TDHC (their rights to which go<br />
back to a multi-million dollar loan the City provided to effect the orig<strong>in</strong>al <strong>in</strong>tegration of the steam<br />
system from several older systems). The private partner, Borealis (the <strong>in</strong>vestment arm of<br />
OMERS) has achieved its majority share through additional capital <strong>in</strong>vestment <strong>in</strong> system<br />
expansion.<br />
The orig<strong>in</strong>al bus<strong>in</strong>ess plan for the DES <strong>in</strong> W<strong>in</strong>dsor was back-stopped by an unusually large<br />
anchor customer, Cas<strong>in</strong>o W<strong>in</strong>dsor which ensured sufficient firm revenue <strong>in</strong> capacity charges (for<br />
four services; heat<strong>in</strong>g, cool<strong>in</strong>g, steam and emergency power) to support a DBFOM contract with<br />
an external developer of the <strong>Energy</strong> Centre that made split ownership orig<strong>in</strong>ally viable for all<br />
parties. This scenario cannot be relied on to be replicable for <strong>Project</strong> <strong>Green</strong>.<br />
The 50% share <strong>in</strong> SDEC by Toromont came with preferred vendor status.<br />
The only two case histories exam<strong>in</strong>ed where municipalities currently have zero ownership are<br />
both smaller systems, Cornwall <strong>District</strong> Heat<strong>in</strong>g and Dockside <strong>Green</strong>. Cornwall <strong>District</strong> Heat<strong>in</strong>g<br />
was orig<strong>in</strong>ally developed as a City <strong>in</strong>itiative and then acquired by Fortis later as a go<strong>in</strong>gconcern.<br />
Dockside <strong>Green</strong> <strong>Energy</strong> is a very small utility <strong>in</strong> its early stages, operat<strong>in</strong>g <strong>in</strong> a<br />
regulated environment <strong>in</strong> BC and its establishment was strongly mandated by the City of<br />
Victoria as a covenant on transfer of City land to the real estate developer.<br />
Dockside <strong>Green</strong> <strong>Energy</strong> is an early example of another DE developer model that may be<br />
emerg<strong>in</strong>g <strong>in</strong> Canada, which might be called the developer campus model. This is where a real<br />
estate developer plans and builds a small DES to serve only their own build<strong>in</strong>gs. There is<br />
another example under construction <strong>in</strong> Quebec City caller Cité Verte.<br />
Experience over the past two decades does not necessarily argue that non-municipally<br />
controlled utility DES development would not be possible <strong>in</strong> <strong>Project</strong> <strong>Green</strong>, only that it would be<br />
the first <strong>in</strong> Canada for many years of a comparably sized development.<br />
160
TRCA Pearson Eco-Bus<strong>in</strong>ess Zone <strong>District</strong> <strong>Energy</strong> <strong>Feasibility</strong> <strong>Study</strong> 10 April 2012<br />
Appendices<br />
21 Appendix K: Ontario M<strong>in</strong>istry of Environment Regulations<br />
This appendix outl<strong>in</strong>es the follow<strong>in</strong>g M<strong>in</strong>istry of Environment (MOE) regulations and guidel<strong>in</strong>es<br />
that may apply to the proposed project.<br />
• Regulation 116/01 – Environmental Assessment Requirements for Electricity <strong>Project</strong>s<br />
• Regulation 419/05 – Air Pollution – Local Air Quality<br />
• Guidel<strong>in</strong>e A-9 – NOX Emissions from Boilers-Heaters<br />
• Guidel<strong>in</strong>e A-10 - Procedure for Prepar<strong>in</strong>g an Emission Summary and Dispersion Model<strong>in</strong>g<br />
Report<br />
• Guidel<strong>in</strong>e A-12 – Guidel<strong>in</strong>e for the Implementation of Air Standards <strong>in</strong> Ontario (GIASO)<br />
• Guidel<strong>in</strong>e for the Installation and Operation of Cont<strong>in</strong>uous Emission Monitor<strong>in</strong>g Systems and<br />
their use for report<strong>in</strong>g under the provisions of O. Reg. 127/01<br />
21.1 Regulation 116/01 – Environmental Assessment Requirements for Electricity<br />
<strong>Project</strong>s<br />
This regulation establishes the EA requirements for new power generation facilities and related<br />
transmission l<strong>in</strong>es and transformer stations. The MOE have developed three categories that<br />
range from no requirements to an <strong>in</strong>dividual EA; the selection of which depends on the size of<br />
the undertak<strong>in</strong>g and the proposed fuel/energy source.<br />
The Regulation does not apply to cogeneration facilities, <br />
60%. Appropriate siz<strong>in</strong>g and phas<strong>in</strong>g of the project is necessary to ensure the 60% efficiency<br />
hurdle is met.<br />
21.2 Regulation 419/05 – Air Pollution – Local Air Quality<br />
A Certificate of Approval (C of A) must be obta<strong>in</strong>ed whenever contam<strong>in</strong>ants are discharged <strong>in</strong>to<br />
the environment from any equipment or structure. Typical contam<strong>in</strong>ants emitted from a CHP<br />
system <strong>in</strong>clude combustion products like oxides of nitrogen, carbon monoxide, sulphur dioxide,<br />
particulate matter and volatile organic compounds as well as noise and vibration.<br />
Section 9 of the Environmental Protection Act forms the basis for the Air and Noise Approval<br />
Program <strong>in</strong> Ontario and requires companies to obta<strong>in</strong> a C of A prior to the construction of new<br />
equipment that emits a contam<strong>in</strong>ant (air, noise or vibration) <strong>in</strong>to the natural environment. This<br />
regulation outl<strong>in</strong>es the air quality standards that apply to discharges of contam<strong>in</strong>ants <strong>in</strong>to the<br />
environment and the approved dispersion models that can be applied to confirm that<br />
concentrations at po<strong>in</strong>ts of imp<strong>in</strong>gements (POI). Report<strong>in</strong>g to the MOE must follow the Emission<br />
Summary and Dispersion Model<strong>in</strong>g (ESDM) format described <strong>in</strong> the Regulation. Regulation<br />
419/05 applies to the proposed EC and CHP system.<br />
21.2.1 Air Quality<br />
In order to obta<strong>in</strong> approval under Section 9 of the EPA, the proponent is required to<br />
demonstrate compliance with po<strong>in</strong>t of imp<strong>in</strong>gement limits through the preparation of a report,<br />
which will help determ<strong>in</strong>e the required stack height. In order to demonstrate compliance with<br />
this regulation it is generally necessary to engage an emissions consultant to perform air<br />
dispersion model<strong>in</strong>g.<br />
There are three tiers of air quality standards <strong>in</strong>cluded <strong>in</strong> O. Reg. 419/05. Schedule 1 conta<strong>in</strong>s<br />
half hour averaged POI limits, Schedule 2 conta<strong>in</strong>s updated standards with half hour averaged<br />
161
TRCA Pearson Eco-Bus<strong>in</strong>ess Zone <strong>District</strong> <strong>Energy</strong> <strong>Feasibility</strong> <strong>Study</strong> 10 April 2012<br />
Appendices<br />
limits, <strong>in</strong>clud<strong>in</strong>g the Future Effects-based POI Limits from Reg. 346, and the addition of POI<br />
limits for sixteen new contam<strong>in</strong>ants and Schedule 3 provides standards with variable averag<strong>in</strong>g<br />
times to better assess health and environmental impacts from a facility by us<strong>in</strong>g the most<br />
appropriate averag<strong>in</strong>g time for exposure and are predom<strong>in</strong>antly 24-hour average standards.<br />
All facilities must achieve the Schedule 3 by the year 2020. The MOE has recognized that with<br />
the implementation of stricter standards and the requirement to apply more advanced dispersion<br />
models, there is the potential for a facility to exceed standards at POI’s. Reg. 419/05 provides<br />
the opportunity for facilities to request an alteration to Schedule 3 standards <strong>in</strong> accordance with<br />
s. 32 of Reg. 419/05. Predictive air dispersion model<strong>in</strong>g of air contam<strong>in</strong>ants will be necessary to<br />
demonstrate compliance to a schedule POI limit.<br />
From 2011, there are also tight limits on emissions of NOx <strong>in</strong> terms of ppm per unit of energy<br />
production, such that Selective Reduction Catalysts (SRCs ) will be required for natural gas fired<br />
reciprocat<strong>in</strong>g eng<strong>in</strong>es. Specifically, SCR technology will be employed to meet the requirements<br />
of the proposed Ontario M<strong>in</strong>istry of Environment emission limit for NOx from non-emergency<br />
<strong>in</strong>ternal combustion eng<strong>in</strong>e generators of 0.40 kg/MWhe from 2011 onwards. The SCR will add<br />
to the capital and ma<strong>in</strong>tenance costs of the CHP facility.<br />
21.3 Noise<br />
In order to obta<strong>in</strong> approval under Section 9 of the EPA, the proponent is required to assess and<br />
document the impacts of all sound (noise) and vibration emissions from their facility on any<br />
sensitive locations def<strong>in</strong>ed as a Po<strong>in</strong>t(s) of Reception. If the results from the <strong>in</strong>itial screen<strong>in</strong>g<br />
assessment confirms that the closed Po<strong>in</strong>t of Reception is closer than the m<strong>in</strong>imum required<br />
distance calculated <strong>in</strong> the Noise Screen<strong>in</strong>g Process then further assessment will be required.<br />
Typically if receptors are >500/1000 metres away then no further noise assessment is<br />
necessary. If receptors are with<strong>in</strong> 500/1000 metres then model<strong>in</strong>g of noise impacts may be<br />
necessary. Results of the model<strong>in</strong>g are compared to either NPC-205 or NPC 232 Guidel<strong>in</strong>es to<br />
evaluate if mitigation measures are required.<br />
There are effective eng<strong>in</strong>eer<strong>in</strong>g solutions to noise that should be tailored to the location of the<br />
<strong>Energy</strong> Centre.<br />
The M<strong>in</strong>istry, similarly, enforces limits on noise and emissions from the cool<strong>in</strong>g towers that may<br />
be required for a district cool<strong>in</strong>g system and/or heat rejection from CHP.<br />
21.4 Use of Biomass or Waste wood<br />
It is not currently anticipated that the DES <strong>in</strong> <strong>Project</strong> <strong>Green</strong> will use biomass or waste wood fuel<br />
<strong>in</strong> the near future, but this is viewed as a possibility <strong>in</strong> future, which will trigger the need to<br />
comply with other regulations.<br />
Accord<strong>in</strong>g to the MOE Guide to Environmental Assessment Requirements for Electricity<br />
<strong>Project</strong>s, a project us<strong>in</strong>g waste biomass under 10 MWe would have no EA requirements, unless<br />
someone requests that the M<strong>in</strong>ister of Environment make the project subject to the<br />
Environmental Assessment Act (and the M<strong>in</strong>ister agrees).<br />
EPA Reg 101/94 requires conversion of leaf and yard waste <strong>in</strong>to compost for soil amendment is<br />
an overarch<strong>in</strong>g consideration that must be resolved prior to us<strong>in</strong>g this material for fuel.<br />
162
TRCA Pearson Eco-Bus<strong>in</strong>ess Zone <strong>District</strong> <strong>Energy</strong> <strong>Feasibility</strong> <strong>Study</strong> 10 April 2012<br />
Appendices<br />
As a general expectation, it may be easier to obta<strong>in</strong> the required permits for a biomass<br />
gasification process than for straight combustion. But experience is limited <strong>in</strong> Canada and more<br />
so <strong>in</strong> Ontario.<br />
The gasification unit at Dockside <strong>Green</strong> <strong>in</strong> Victoria, B.C., still has an Electro-static Precipitator<br />
(ESP) to clean-up Particulate Matter (PM) <strong>in</strong> the exhaust to acceptable levels. This suggests<br />
that PM from a gasifier may be less than from a combustor but is still higher than allowed,<br />
hence there is still a need for post-cleanup us<strong>in</strong>g either technology, whether combustion or<br />
gasification.<br />
Market<strong>in</strong>g gasifiers as clean has certa<strong>in</strong>ly <strong>in</strong>fluenced public op<strong>in</strong>ion and fund<strong>in</strong>g agencies, but<br />
this could change if they prove to be a disappo<strong>in</strong>tment <strong>in</strong> operation. They have good will on<br />
their side for now, but, to an extent, the jury is still out. The implication of this is that a careful<br />
judgment needs to be made as to whether to accept the reliability risks of gasification <strong>in</strong> a tradeoff<br />
to ga<strong>in</strong> greater public and government acceptance.<br />
21.5 Guidel<strong>in</strong>e A-9 – NOx Emissions from Boilers and Heaters<br />
Where the fuel energy <strong>in</strong>put from an <strong>in</strong>dividual new or modified boiler which burns oil or gas fuel<br />
exceeds 10 million British Thermal Units per hour (MMBtu/hr), the requirements of the MOE’s<br />
guidel<strong>in</strong>e must be met.<br />
21.6 Guidel<strong>in</strong>e A-10 - Procedure for Prepar<strong>in</strong>g an Emission Summary and<br />
Dispersion Modell<strong>in</strong>g (ESDM) Report, date July 2005<br />
This guidel<strong>in</strong>e provides direction on how to prepare of an Emission Summary and Dispersion<br />
Modell<strong>in</strong>g (ESDM) report, <strong>in</strong> accordance with s.26 of O.Reg 419/05 and the m<strong>in</strong>istry document<br />
titled Procedure for Prepar<strong>in</strong>g an Emission Summary and Dispersion Modell<strong>in</strong>g Report, July<br />
2005. Guidel<strong>in</strong>e A-10 applies to the proposed CHP facility.<br />
21.7 Guidel<strong>in</strong>e A-12 – Guidel<strong>in</strong>e for the Implementation of Air Standards <strong>in</strong><br />
Ontario (GIASO)<br />
This guidel<strong>in</strong>e presents the regulatory process to address situations where the implementation<br />
of new air standards or the use of the new models may result <strong>in</strong> barriers to compliance. These<br />
barriers <strong>in</strong>clude the need for more time, or consideration of technical or economic issues. New<br />
facilities that emit contam<strong>in</strong>ants listed <strong>in</strong> Schedule 7 of Reg. 419/05 must apply for its alternative<br />
standard before their <strong>in</strong>itial CofA is issued.<br />
21.8 Summary<br />
Several Ontario M<strong>in</strong>istry of Environment regulations and guidel<strong>in</strong>es would possibly apply to a<br />
proposed DES with or without a CHP facility.<br />
Our review of Reg. 116/01 identified that a gas-fired CHP facility of the size anticipated to be<br />
used for DE <strong>in</strong> <strong>Project</strong> <strong>Green</strong> would not require an EA.<br />
Even if a biomass fired plant was to be established later there is a low probability that the<br />
proposed CHP facility would require an EA; specifically, if either someone requests it, or the<br />
facility requires approval under Section 27 of the Environmental Protection Act, because it<br />
requires establishment of a waste management system or disposal site.<br />
A Certificate of Approval – Air & Noise is required from the MOE before construction of the CHP<br />
system. In order to evaluate if the proposed CHP system will demonstrate compliance to Reg.<br />
163
TRCA Pearson Eco-Bus<strong>in</strong>ess Zone <strong>District</strong> <strong>Energy</strong> <strong>Feasibility</strong> <strong>Study</strong> 10 April 2012<br />
Appendices<br />
419/05 predictive air dispersion model<strong>in</strong>g and a noise assessment (as m<strong>in</strong>imum) will be<br />
required.<br />
164